RESEARCH OUTPUTS / RÉSULTATS DE RECHERCHE
Author(s) - Auteur(s) :
Publication date - Date de publication :
Permanent link - Permalien :
Rights / License - Licence de droit d’auteur :
Bibliothèque Universitaire Moretus Plantin
Institutional Repository - Research Portal
Dépôt Institutionnel - Portail de la Recherche
researchportal.unamur.be
University of Namur
Towards Statistical Prioritization for Software Product Lines Testing
Devroey, Xavier; Cordy, Maxime; Perrouin, Gilles; Schobbens, Pierre-Yves; Legay, Axel;
Heymans, Patrick
Published in:
Proceedings of the Eighth International Workshop on Variability Modelling of Software-Intensive Systems
DOI:
10.1145/2556624.2556635
Publication date:
2014
Document Version
Early version, also known as pre-print
Link to publication
Citation for pulished version (HARVARD):
Devroey, X, Cordy, M, Perrouin, G, Schobbens, P-Y, Legay, A & Heymans, P 2014, Towards Statistical
Prioritization for Software Product Lines Testing. in A Wasowski & T Weyer (eds), Proceedings of the Eighth
International Workshop on Variability Modelling of Software-Intensive Systems: VaMoS '14 . vol. VaMoS '14, 10,
ACM Press, Sophia Antipolis, France, pp. 10:1-10:7, The 8th International Workshop on Variability Modelling of
Software-intensive Systems (VaMoS '14), Nice, France, 22/01/14. https://doi.org/10.1145/2556624.2556635
General rights
Copyright and moral rights for the publications made accessible in the public portal are retained by the authors and/or other copyright owners and it is a condition of accessing publications that users recognise and abide by the legal requirements associated with these rights. • Users may download and print one copy of any publication from the public portal for the purpose of private study or research. • You may not further distribute the material or use it for any profit-making activity or commercial gain
• You may freely distribute the URL identifying the publication in the public portal ? Take down policy
If you believe that this document breaches copyright please contact us providing details, and we will remove access to the work immediately and investigate your claim.
Towards Statistical Prioritization for Software Product
Lines Testing
Xavier Devroey,
Gilles Perrouin
∗,
Maxime Cordy
†,
Pierre-Yves Schobbens
PReCISE, Fac. of Computer Science, UNamur, Belgium
{xde,mcr,gpe,pys}
@info.fundp.ac.be
Axel Legay
INRIA Rennes Bretagne Atlantique, France
[email protected]
Patrick Heymans
PReCISE, Fac. of Computer Science, UNamur, Belgium
[email protected]
ABSTRACT
Software Product Lines (SPLs) are inherently difficult to test due to the combinatorial explosion of the number of products to consider. To reduce the number of products to test, sampling techniques such as combinatorial interac-tion testing have been proposed. They usually start from a feature model and apply a coverage criterion (e.g. pairwise feature interaction or dissimilarity) to generate tractable, fault-finding, lists of configurations to be tested. Prioritiza-tion can also be used to sort/generate such lists, optimizing coverage criteria or weights assigned to features. However, current sampling/prioritization techniques barely take prod-uct behaviour into account. We explore how ideas of statis-tical testing, based on a usage model (a Markov chain), can be used to extract configurations of interest according to the likelihood of their executions. These executions are gath-ered in featured transition systems, compact representation of SPL behaviour. We discuss possible scenarios and give a prioritization procedure validated on a web-based learning management software.
Keywords
SPL Testing, Prioritization, Statistical Testing
1.
INTRODUCTION
Software Product Line (SPL) engineering is based on the idea that products of the same family can be built by sys-tematically reusing assets, some of them being common to all members whereas others are only shared by a subset of the family. Such variability is commonly captured by the ∗FNRS Postdoctoral Researcher
†FNRS Research Fellow
Permission to make digital or hard copies of all or part of this work for personal or classroom use is granted without fee provided that copies are not made or distributed for profit or commercial advantage and that copies bear this notice and the full citation on the first page. Copyrights for components of this work owned by others than ACM must be honored. Abstracting with credit is permitted. To copy otherwise, or republish, to post on servers or to redistribute to lists, requires prior specific permission and/or a fee. Request permissions from [email protected].
VaMoS’14, January 22 - 24 2014, Sophia Antipolis, France Copyright 2014 ACM 978-1-4503-2556-1/14/01 ...$15.00.
http://dx.doi.org/10.1145/2556624.2556635.
notion of feature. Individual features can be specified using languages such as UML, while their inter-relationships are organized in a Feature Diagram (FD) [17].
SPL testing the most common quality assurance technique in SPL engineering. As opposed to single-system testing where the testing process considers only one software prod-uct, SPL testing is concerned about minimizing the test ef-fort for all the SPL products. Testing these products sepa-rately is clearly infeasible in real-world SPLs, which typically consist of thousands of products. Automated model-based testing [32] and shared execution [18] are established testing methods that allows test reuse across a set of software. They can thus be used to reduce the SPL testing effort. Even so, the problem remains entire as these methods still need to cover all the products.
Other approaches consist in testing only a representative sample of the products. Typical methods select these prod-ucts according to some coverage criterion on the FD (e.g. all the valid couples of features must occur in at least one tested product [7,25]). An alternative method is to associate each feature with a weight and prioritize the products with the highest weight [15, 16]. This actually helps testers to scope more finely and flexibly relevant products to test than a covering criteria alone. Yet, assigning meaningful weights is cumbersome in the absence of additional information re-garding their behaviour.
In this paper, we propose an approach to prioritize the products to test according to criteria based on the actual behaviour of the products, thereby increasing the relevancy of the testing activities and decreasing the risk of leaving errors undetected in many products. Our work leans on statistical testing [35], which generates test cases from a us-age model represented by a Discrete-Time Markov Chain (DTMC). This usage model represents the usage scenarios of the software under test as well as their respective prob-ability. The latter information allows one to determine the likelihood of execution scenarios, and to rank these accord-ingly. We postulate that this ranking method can serve as a basis for prioritizing the products to test in an SPL. For instance, one may be interested only in products that can produce the executions that have the highest probability of occurrence. Usage models being extracted from running systems in a black-box manner, they are agnostic on vari-ability and therefore cannot link a behaviour to the features
VendingMachine v CancelPurchase c Beverages b FreeDrinks f Currency cur Soda s Tea t Euro eur Dollar usd Or Xor
(a) Feature Diagram (FD)
1 2 3 4 5 6 7 8 9 pay/¬f change/¬f free / f take / f close/¬f open/¬f take/¬f cancel / c return / c soda / s serveSoda / s tea / t serveTea / t
(b) Featured Transition System (FTS)
1 2 3 4 6 7 8 9 0.1/pay 1/change 0.9/free 0.9/take 1/close 0.1/open 1/take 0.1/cancel 1/return 0.9/tea 1/serveTea (c) Usage model (DTMC)
Figure 1: The soda vending machine example [4] needed to execute it. To overcome this, we assume the ex-istence of design models describing the SPL behaviour. We then encode these models into a fundamental formalism – a Featured Transition System (FTS) – to obtain the missing link between executions and variability. The next step is to remove the behaviours of the FTS that were not selected during the analysis of the usage model. In our example, we would obtain a pruned FTS that exhibits only the most common behaviours, from which we can extract the prod-ucts able to execute them.
The remainder of this paper is organized as follows: Sec-tion 2 presents the theoretical background underlying our vision. Our approach is detailed in Section 3. The results of a preliminary experiment are presented in Section 4. Sec-tion 5 discusses related research and SecSec-tion 6 concludes the paper with challenges and future research directions.
2.
BACKGROUND
In this section, we present the foundations underlying our approach: SPL modeling and statistical testing.
2.1
SPL Modelling
A key concern in SPL modeling is how to represent
vari-ability. To achieve this purpose, SPL engineers usually rea-son in terms of features. Relations and constraints between features are usually represented in a Feature Diagram (FD) [17]. For example, Fig. 1a presents the FD of a soda vend-ing machine [4]. A common semantics associated to a FD d (noted [[d]]) is the set of all the valid products allowed by d. Different formalisms may be used to model the behaviour of a system. To allow the explicit mapping from feature to SPL behaviour, Featured Transition Systems (FTS) [4] were proposed. FTS are transition systems (TS) where each tran-sition is labelled with a feature expression (i.e., a boolean ex-pression over features of the SPL), specifying which products can execute the transition. Thus it is possible to determine products that are the cause of a violation or a failed test. Formally, an FTS is a tuple (S, Act, trans, i, d, γ) where S is a set of states; Act a set of actions; trans ⊆ S × Act × S is the transition relation (with (s1, α, s2) ∈ trans
some-times noted s1 α
−→ s2); i ∈ S is the initial state; d is
a FD; and γ : trans → [[d]] → {>, ⊥} is a total func-tion labelling each transifunc-tion with a boolean expression over the features, which specifies the products that can execute the transition. For instance: ¬f in Fig. 1b indicates that only products that have not the f ree feature may fire the pay, change, open, take and close transitions. A TS mod-elling the behaviour of a given product is obtained by remov-ing the transition whose feature expression is not satisfied by the product.
We define the semantics of an FTS as a function that as-sociates each valid product with its set of finite and infinite traces, i.e. all the alternating sequences of states and actions starting from the initial state available, satisfying the tran-sition relation and such that its trantran-sitions are available to that product. According to this definition, an FTS is indeed a behavioural model of a whole SPL. Fig. 1b presents the FTS modeling a vending machine SPL. For instance, tran-sition 3 pay/¬f−→ 4 is labelled with the feature expression c. This means that only the products that do have the feature Cancel (c) are able to execute the transition. This defini-tion differs from the one presented in [4], where only infinite paths are considered. In a testing context, one may also be interested in finite paths.
2.2
Statistical Testing
Whittaker and Thomason introduce the notion of usage model in [35] and define it as a TS where transitions have probability values defining their occurrence likelihood. For-mally, their usage model is actually equivalent to a DTMC where transitions are additionally decorated with actions, i.e. a tuple (S, Act, trans, P, τ ) where :
• (S, Act, trans) are defined as in FTS;
• P : S ×Act×S → [0, 1] is the probability function that associates each transition (si, α, sj) the probability for
the system in state si to execute action α and reach
state sj;
• τ : S → [0, 1] is the vector containing the probabilities to be in the initial state when the system starts, with the following constraint : ∃i : (τ (i) = 1 ∧ ∀j 6= i : τ (j) = 0);
• ∀si∈ S :Pα∈Act,s
j∈S•si−→sα jP (si, α, sj) = 1, that is,
the total of the probabilities of the transitions leaving a state must be equal to 1.
Note that in their original definition, DTMCs have no ac-tion. We need them here to relate transitions in a DTMC with their counterpart in an FTS. Still, our alternate def-inition remains in accordance with the action-less variant. Fundamentally, in both cases, the probability function asso-ciates probability values to transitions. Thus, the fact that transitions are defined either as sequences of states and ac-tions or as sequences of states is meaningless. Also, we con-sider that there is a single initial state i, that is, τ (i) = 1.
3.
STATISTICAL PRIORITIZATION IN SPL
TESTING
In our approach, we consider three models: a FD d to represent the features and their constraints (in Fig. 1a), an FTS f ts over d (in Fig. 1b) and a usage model rep-resented by a DTMC dtmc (in Fig. 1c) whose states, ac-tions, and transitions are subset of their counterpart in f ts: Sdtmc ⊆ Sf ts∧ Actdtmc ⊆ Actf ts∧ transdtmc ⊆ transf ts.
Moreover, the initial state i of f ts is in Sdtmc and has an
initial probability of 1, that is, τ (i) = 1.
An alternative would have been to rely on a unified for-malism able to represent both variability and stochasticity (see, e.g., [9]). However, we believe it is more appropriate to maintain a separation of concerns for several reasons. First, existing model-based testing tools relying on usage models (e.g., MaTeLO1) do not support DTMCs with variability. Implementing our approach on top of such tools would be made harder should we use the aforementioned unified for-malism. Second, the DTMC can be defined by a system expert, but also obtained from either users trying the soft-ware under test, extracted from logs, or from running code. These extractions methods are agnostic on the features of the system they are applied to. Third, since the DTMC is built from existing software executions, it may be incom-plete (as in Fig. 1c). Because of that, there may exist FTS executions that are not exercised in the usage model, result-ing in missresult-ing transitions in the DTMC. Keepresult-ing the FTS and usage models separate is helpful to identify and correct such issues.
Since the usage model does not consider features, there may exist paths in the DTMC that are inconsistent for the SPL. For example, in the usage model of Fig. 1c one can follow the path pay, change, tea, serveT ea, take. This path actually mixes “pay machine” (feature f not enabled) and “free machine” (feature f enabled). The combined use of DTMCs and FTS allows us to detect such inconsistencies.
We propose two testing scenarios: product-based test deriva-tion and family-based test prioritizaderiva-tion.
3.1
Product-Based Test Derivation
Product-based test derivation is straightforward: one se-lects one product (by selecting features in the FD), projects it onto the FTS, giving a TS with only the transitions of the product, prunes the DTMC to keep the following property true : Sdtmc⊆ Sts∧ Actdtmc⊆ Actts∧ transdtmc⊆ transts.
We assume that the probabilities of the removed transitions are uniformly distributed on adjacent transitions (since the probability axiom ∀si ∈ S : Psj∈SP (si, sj) = 1 holds).
Finally, we generate test cases using statistical testing algo-rithms on the DTMC [12, 35].
1see: http://all4tec.net/index.php/en/
model-based-testing/20-markov-test-logic-matelo
This scenario is proposed by Samih and Baudry [26]. Prod-uct selection is made on an orthogonal variability model (OVM) and mapping between the OVM and the DTMC (build by a system expert and implemented using MaTeLo) is provided via explicit traceability links to functional re-quirements. This process thus requires to perform selection of products of interest on the variability model and does not exploit probabilities and traces of the DTMC during such selection. Additionally, they assume that tests for all prod-ucts of the SPL are modeled in the DTMC. This assumption may be too strong in certain cases and delay actual testing since designing the complete DTMC for a large SPL may take time. We thus explore a scenario where the DTMC drives product selection and prioritization.
3.2
Family-Based Test Prioritization
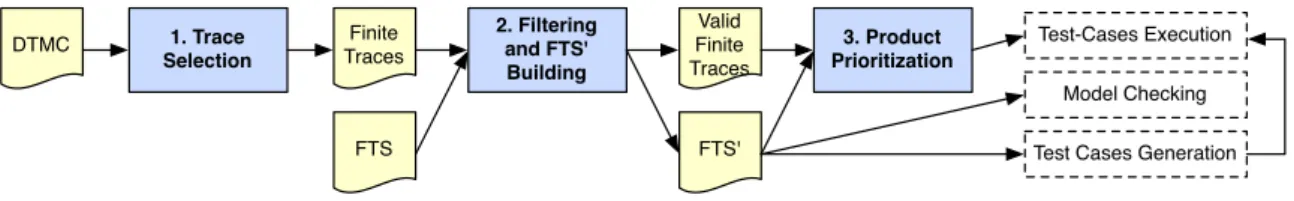
Contrary to product-based test derivation, our approach (in Fig. 2) only assumes partial coverage of the SPL by the usage model. For instance, the DTMC represented in Fig. 1c does not cover serving soda behaviour because no user exercised it. The key idea is to generate traces from the DTMC according to their probability to happen (step 1). For example, one may be interested in analyzing the “serving teas for free” behaviour, which will correspond to the following actions (f ree, tea, serveT ea, take), since it is highly probable (p = 0.729). On the contrary, one may be interested in low probability because it can mean poorly tested products.
The generated traces are filtered using the FTS in order to keep only sequences that may be executed by at least one product of the SPL (step 2). The result will be a FTS’, corre-sponding to a pruned FTS according to the extracted traces. Each valid trace is combined with the FTS’ to generated a set of products that may effectively execute this behaviour. The probability of the trace to be executed allows us to pri-oritize products exercising the behaviour described in the FTS’ (step 3).
3.2.1
Trace Selection in the DTMC
The first step is to extract traces from the DTMC accord-ing to desired parameters provided by the tester. Formally, a finite trace t is a finite alternating sequence t = (i = s0, α0, ..., αn−1, sn) such as (sj, αj+1, sj+1) ∈ trans, ∀j ∈
[0, n − 1]. To perform trace selection in a DTMC dtmc, we apply a depth-first Search (DFS) algorithm parametrized with a maximum length lmax for finite traces and an
in-terval [P rmin, P rmax] specifying the minimal and maximal
values for the probabilities of selected traces. Formally: DF S(lmax, P rmin, P rmax, dtmc) = {(i, α1, ..., αn, i)
∧ n < lmax ∧ (6 ∃k : 0 < k < n • i = sk)
∧ (P rmin≤ P r(i, α1, ..., αn, i) ≤ P rmax)}
where τdtmc(s0) = 1 and
P r(i, α0, . . . , sn) = τdtmc(i) × Πn−1i=0Pdtmc(si, αi, si+1).
We initially consider only finite traces starting from and ending in the initial state i (assimilate to an accepting state) without passing by i in between. Finite traces starting from and ending in i corresponds to a coherent execution scenario in the DTMC. With respect to partial finite traces (i.e., finite traces not ending in i), our trace definition involve a smaller state space to explore in the DTMC. This is due
DTMC FTS FTS' Finite Traces 1. Trace Selection 2. Filtering and FTS' Building 3. Product Prioritization Model Checking Test Cases Generation Valid
Finite Traces
Test-Cases Execution
Figure 2: Family-based test prioritization approach to the fact that the exploration of a part of the graph may
be stopped, without further checks of the existence of partial finite traces, as long as the partial trace is higher than lmax.
The DFS algorithm is hence easier to implement and may better scale to large DTMCs.
Practically, this algorithm will build a n-tree where a node represents a state with the probability to reach it and the branches are the αklabels of the transitions taken from the
state associated to the node. The root node corresponds to the initial state i and has a probability of 1. Since we are only interested in finite traces ending in the initial state, the exploration of a branch of the tree is stopped when the depth is higher than then maximal path lmax. This parameter is
provided to the algorithm by the test engineer and is only used to avoid infinite loops during the exploration of the DTMC. Its value will depend on the size of the DTMC and should be higher than the maximal “loop free” path in the DTMC in order to get coherent finite traces.
For instance, the execution of the algorithm on the soda vending machine (vm) example presented in Fig. 1b gives 5 finite traces:
DF S(7; 0; 0.1; DT M Cvm) = {
(pay, change, cancel, return); (f ree, cancel, return); (pay, change, tea, serveT ea, open, take, close); (pay, change, tea, serveT ea, take);
(f ree, tea, serveT ea, open, take, close)}
During the execution of the algorithm, the trace (f ree, tea, serveT ea, take) has been rejected since its probability (0.729) is is not between 0 and 0.1.
The downside is that the algorithm will possibly enumer-ate all the paths in the DTMC depending on the lmaxvalue.
This can be problematic and we plan in our future work to use symbolic executions techniques inspired by work in the probabilistic model checking area, especially automata-based representations in order to avoid a complete state space exploration.
3.2.2
FTS-Based Trace Filtering and FTS Pruning
Generated finite traces from the DTMC may be illegal: behaviour that cannot be executed any valid product of the SPL. The set of generated finite traces has to be filtered using the FTS such that the following property holds: for a given FTS f ts and a usage model dtmc, a finite trace t generated from dtmc represents a valid behaviour for the product line pl modelled by f ts if there exists a product p in pl such as t ⊆ [[f ts|p]]T S, where f ts|prepresents the
pro-jection of f ts using product p and [[ts]]T S represents all the
possible traces and their prefixes for a TS ts. The idea here is to use the FTS to detect invalid finite traces by running them on it.
Require: traces, f ts Ensure: traces, f ts0
1: Sf ts0 ← {if ts} ; if ts0 ← if ts ; df ts0 ← df ts
2: for all t ∈ traces do 3: if accept(f ts, t) then
4: Sf ts0← Sf ts0∪ states(f ts, t)
5: Actf ts0← Actf ts0∪ t
6: transf ts0 ← transf ts0∪ transitions(f ts, t)
7: γf ts0 ← f Labels(f ts, t)γf ts0 8: else 9: traces ← traces \ {t} 10: end if 11: end for 12: return f ts0
Figure 3: FTS’ building algorithm
Practically, we will build a second FTS’ which will rep-resent only the behaviour of the SPL appearing in the fi-nite traces generated from the DTMC. Fig. 3 presents the algorithm used to build an f ts0 from a set of traces (fil-tered during the algorithm) and a f ts. The initial state of f ts0 corresponds to the initial state of the f ts (line 1) and d in f ts0 is the same as for f ts (line 1). If a given trace is accepted by the f ts (line 3), then the states, ac-tions and transiac-tions visited in f ts when executing the trace t are added to f ts0(line 4 to 6). The accept(f ts, t) function on line 3 will return true if there exists at least one prod-uct in df ts that has t as one of its behaviours. On line 7,
the f Labels(f ts, t) function is used to enrich the γf ts0
func-tion with the feature expressions of the transifunc-tions visited when executing t on the f ts. It has the following signature: f Labels : (F T S, trace) → γ → γ and f Labels(f ts, t)γf ts0
will return a new function γ0f ts0 which will for a given
tran-sition tr = (si αk
−→ sj) return γf tstr if αk ∈ t or γf ts0tr
otherwise.
In our vm example, the set of finite traces generated from step 1 contains two illegal traces: (pay, change, tea, serveT ea, take) and (f ree, tea, serveT ea, open, take, close). Those 2 traces (mixing free and not free vending machines) cannot be executed on the f tsvm and will be rejected in
1 2 3 4 6 7 8 9 pay/¬f change/¬f free / f close/¬f open/¬f take/¬f cancel / c return / c tea / t serveTea / t
step 2. The generated f ts0vmis presented in Fig. 4.
3.2.3
Product Prioritization
At the end of step 2 in Fig. 2, we have an FTS’ and a set of finite traces in this FTS’. This set of finite traces (coming from the DTMC) covers all the valid behaviours of the FTS’. It is thus possible to order them according to their probability to happen. This probability corresponds to the the cumulated individual probabilities of the transitions fired when executing the finite trace in the DTMC. A valid finite trace t = (i, α1, . . . , αn, i) corresponding to a path
(i −→ . . .α1 −→ i) in the DTMC (and in the FTS’) has aαn
probability P r(t) (calculated as in step 1) to be executed. We may perform bookkeeping of P r(t).
The set of products able of executing a trace t may be calculated from the FTS’ (and its associated FD). It cor-responds to all the products (i.e., set of features) of the FD ([[d]]) that satisfy all the feature expressions associated to the transitions of t. Formally, for t and a FTS’ f ts0, the set of products prod(t, f ts0) =Tn
k=1{p | γf ts0(sk αk
−→ sk+1)p = true}. From a practical point of view, the set
of products corresponds to the products satisfying the con-junction of the feature expressions γf ts0(sk
αk
−→ sk+1) on
the path of t and the FD df ts0. As df ts0 may be
trans-formed to a boolean formula where features become vari-ables [10], the following formula can be calculated using a SAT solver:Vn
k=1(γf ts0(sk αk
−→ sk+1))∧booleanF orm(df ts0).
At this step, each valid finite trace t is associated to the set of products prod(t, f ts0) that can actually execute t with a probability P r(t). Product priortization may be done by classifying the finite traces according to their probability to be executed, giving t-behaviourally equivalent classes of products for each finite trace t. For instance, for the trace tvm = (pay, change, tea, serveT ea, open, take, close)
gener-ated for our vm example the products will have to satisfy the ¬f ∧ t feature expression and dvm. This gives us a set
of 8 products (amongst 32 possible):
{(v, b, cur, t, eur); (v, b, cur, t, usd); (v, b, cur, t, c, eur); (v, b, cur, t, c, usd); (v, b, cur, t, s, eur); (v, b, cur, t, s, usd); (v, b, cur, t, s, c, eur); (v, b, cur, t, s, c, usd)}
All of them executing tvm with a probability P r(tvm) =
0.009 which is the lowest probable behaviour of the soda vending machine.
4.
CASE STUDY
To assess the feasibility of our proposed approach, we de-cided to apply it on Claroline [3], an open-source web-based application dedicated to learning and online collaborative work. Analysing such systems using Markov Chains has already been investigated [28] (e.g., for link prediction) sug-gesting that our approach apply to this domain. The in-stance of Claroline at University of Namur2is the main
com-munication channel between students and lecturers. Stu-dents may register to courses and download documents, re-ceive announcements, submit their assignments, perform on-line exercises, etc. Due to space constraint, the complete models are not shown in this paper, but may be downloaded at http://info.fundp.ac.be/~xde/fts-testing.
2
http://webcampus.unamur.be
4.1
Inferring the Usage Model
To derive the DTMC usage model, we used the anonymized Apache access log provided by the IT support team of the university. This file (5,26 Go) contains all the HTTP re-quests made to access the Claroline instance from January 1st to October 1st 2013. We chose to consider only requests to access PHP pages accessible to users. It represents a to-tal of 12.689.030 HTTP requests. We setup an automated way to infer the usage model from the log, as it would be in-tractable to do so manually. First, Claroline Log was trans-lated into a MySQL database to ease processing of requests. Indeed, each entry of the table represents a single access to a page: we had to reconstruct the behaviour of a user by grouping requests. Our approach is similar to Sampath et al. [27]: we group visited PHP pages by the user (ac-cording to their line numbers in the log) to Claroline pages for a given IP and within a 45 minutes timeframe. Once these user traces are computed, we can learn an usage model from them. There are various machines learning approaches to learn such underlying DTMCs [33]: we elected n-grams (contiguous sequence of n elements) for their close relation-ship to DTMCs and their reported success in practice for real instances [33]. Our implementation can be thought of a gram one without smoothing (we do not consider unseen 2-grams as we focus only on observed behaviour). Concretely, each page is mapped to a state in the usage model and each trace is completed so that it ends in the start state. In the obtained DTMC, the set Act contains actions that indicate the target state of the transition (since they correspond to request to a page). In that setting, they cannot be more than one transition for any two given states. We can there-fore ignore actions in our probability computation method. Then, the probability of moving from state sito another sj
is given as
P (si, sj) =
occ(si, sj)
P
s∈Socc(si, s)
where occ(si, sj) is the occurrence count of the related
2-gram. We were able to process the entirety of our log database, ending up in an usage model formed of 96 states and 2149 transitions. The whole inference process took approximately two hours on a Ubuntu Linux machine with an Intel Core i3 (3.10GHz) processor and 4GB of memory.
4.2
Building Family Models
To obtain the Claroline FD and FTS we proceeded the fol-lowing way. The FD was built manually by inspecting a lo-cally installed Claroline instance (Claroline 1.11.7). The FD describes Claroline with three main features decomposed in sub-features: U ser, Course and Subscription. Subscription may be open to everyone (opt Open Subscription) and may have a password recovery mechanism (opt Lost P assword). User corresponds to the different possible user types pro-vided by default with a basic Claroline installation: unreg-istered users (U nregunreg-isteredU ser) who may access courses open to everyone and registered users (RegisteredU ser) who may access different functionalities of the courses according to their privilege level (Student, T eacher or Admin). The last main feature, Course, corresponds to the page dedi-cated to a course where students and teacher may inter-act. A course has a status (Available, AvailableF romT o or U navailable), may be publicly visible (P ublicV isibility) or not (M embersV isibility), may authorize registration to
Table 1: Traces generation
Run 1 Run 2 Run 3 Run 4 lmax 98 98 98 98 P rmin 1E−4 1E−5 1E−6 1E−7 P rmax 1 1 1 1 #DTMC tr. 211 1389 9287 62112 #Valid tr. 211 1389 9287 62112 Avg. size 4, 82 5, 51 6, 35 7, 17 σ size 1, 54 1, 54 1, 62 1, 66 Avg. proba. 2, 06E−3 3, 36E−4 5, 26E−5 8, 10E−6 σ proba 1, 39E−2 5, 46E−3 2, 12E−3 8, 18E−4 #FTS’ st. 16 36 50 69 #FTS’ tr. 66 224 442 844 identified users (AllowedRegistration) or not (Registration Denied) and may be accessed by everyone (F reeAccess), identified users (Identif iedAccess) or members of the course only (M embersAccess). Moreover, a course may have a list of tools (T ools) used for different teaching purposes, e.g., an agenda (opt CourseAgenda), an announcement panel (opt CourseAnnoucements), a document download section where teacher may post documents and students may down-load them (opt CourseDocument), an online exercise sec-tion (opt CourseExercise), etc. Since we are in a testing context, one instance of the FD does not represent a com-plete Claroline instance, but the minimal instance needed to play a test-set (i.e., test cases formed as sequences of HTTP requests). Basically, it will correspond to a Claroline instance with its subscription features, one particular user and one particular course. In order to represent a complete Claroline instance, we need to introduce cardinalities on the Course and U ser features [22]. Eventually we obtained a FD with 44 features.
Regarding the FTS, we employed a web crawler (i.e., a Python bot that systematically browse and record informa-tion about a website) [29] on our local Claroline instance to discover states of the FTS which as for the DTMC represent visited page on the website. Transitions have been added in such a way that every state may be accessed from any-where. This simplification, used only to ease the FTS build-ing, is consistent with the Web nature of the application and satisfy the inclusion property: Sdtmc ⊆ Sf ts∧ Actdtmc ⊆
Actf ts∧ transdtmc⊆ transf ts. Moreover, some user traces
show that the navigation in Claroline is not always as ob-vious as it seems (e.g., if the users access the website from an external URL sent by e-mail). Finally, transitions have been tagged manually with feature expressions based on the knowledge of the system (via the documentation and the lo-cal Claroline instance). To simulate a web browser access, we added a “0” initial state connected to and accessible from all states in the FTS. The final FTS consists of 107 states and 11236 transitions.
4.3
Setup and Results
The DF S algorithm has been applied four times to the Claroline DTMC with a maximal length of 98, which corre-sponds to the number of states, a maximal probability of 1 and four different minimal probabilities: 10−4, 10−5, 10−6 and 10−7 to observe patterns. Execution times range from less than a minute for the first run to ±8 hours for run 4. Additionally, the algorithm has been parametrized to
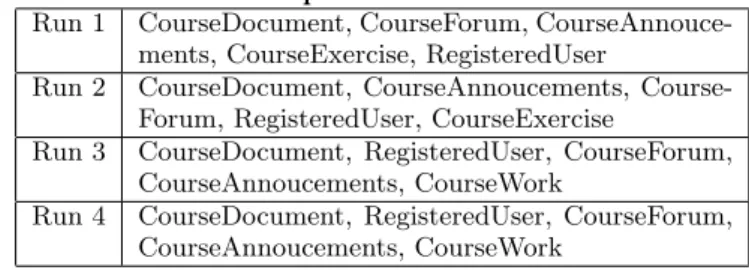
con-Table 2: Most frequent features in valid traces Run 1 CourseDocument, CourseForum,
CourseAnnouce-ments, CourseExercise, RegisteredUser
Run 2 CourseDocument, CourseAnnoucements, Course-Forum, RegisteredUser, CourseExercise
Run 3 CourseDocument, RegisteredUser, CourseForum, CourseAnnoucements, CourseWork
Run 4 CourseDocument, RegisteredUser, CourseForum, CourseAnnoucements, CourseWork
sider each transition only once. This modification has been made since we discovered after a few runs that the algorithm produced a lot of traces with repeated actions, which is of little interest for product prioritization. Repetitions were due to the huge number of loops in the Claroline DTMC.
Table 1 presents the parameters provided to the DF S and the resulting traces before (# DTMC tr.) and after checking with the FTS (# Valid tr.). Surprisingly, all traces gener-ated from the DTMC are valid. This is caused by the nature of the Claroline FD. Most of the features are independent from each other and few of them have exclusive constraints. As expected, the average size of the traces increase as the P rmindecrease to tend to 9, 88, the average size of the traces
used to generate the DTMC.
As explained in section 3, it is possible to prune the orig-inal FTS using the valid traces in order to consider only the valid products capable of executing those traces. In this case, it eventually reduces the number of states and tran-sitions from 107 and 11236 (resp.) to 16 and 66 (resp.) in run 1 and to 69 and 844 (resp.) in run 4. As expected, by controlling the interval size we can reduce the number of traces to be considered and yield easily analysable FTS’.
Table 2 presents the five most frequents features appearing in the feature expressions associated to the transitions of the valid traces. In all the runs, CourseDocument appears the most frequently, from 47% in run 1 to 53% in run 4.
4.4
Discussion
Our results on the Claroline case study led to the following observations:
First, the independence of the features in the FD and the low size of valid FTS traces does not allow to reduce signifi-cantly the number of products associate to each trace. This is caused by the web nature of the application which allows for liberal ways of exploring the FTS with many independent feature expressions (i.e., most feature expressions concern optional features with few dependencies to other features). In order to get a more concrete product, one could gen-erate longer traces in the DTMC by coupling probabilistic approach to more classical state/transition coverage crite-ria [21]. This is left for future work.
Although it is possible to generate the list of products for each trace by taking the conjunction of the feature expres-sions of the transitions of the trace and the FD, this seems of little interest in this case. The valid FTS traces are short and the FD has too much variability to get a reasonable list of products to test. However, we can tackle this problem by taking only needed features to ensure the execution of a valid trace on the FTS. For instance, if we take the less probable trace in run 1 (probability=1.0149×10⁻⁴) and its associated feature expression RegisteredU ser ∧ CourseDocument, the
minimal feature configuration to execute the trace on the FTS is obtained by conjuncting the feature expression with the FD and negating all optional features except Course Document and RegisteredU ser. This gives us a set of 260 possible products. This set is reduced to 20 products if we consider only courses available to student with an id, which is the most classical scenario in the UNamur Claro-line instance. The tester, with knowledge of the application domain, may also use the feature frequency (presented in ta-ble 2) in order to reduce the number of products associated to each trace.
Thirdly, Claroline has a fine grained access control system. In its basic setup, it comes with three user roles: Admin-istrator, Teacher and User. According to its role, a user may or may not perform different actions and access dif-ferent functionalities. Claroline also allows public access to some pages and functionalities (e.g., a course description) to anonymous users. We think that since those four user roles have very different usage profiles, a better approach would be to create four different usage models, one for each user role. This confirm our design choice to keep usage model and FTS separated. Unfortunately, it was not possible in our case with the provided Apache access log since the user roles have been erased in the anonymisation process.
Finally, we also tried to implement other selection criteria to apply the DTMC. One may want to get the most probable traces in the DTMC (max). On the Claroline case, this gives us a lot of small traces, most of them with two or three tran-sitions implying each time the download.php page. After in-vestigation, we discovered that this page is used to download documents, text, images, etc. from the platform and that it is the most frequent HTTP request in the Apache access log that we processed. This is coherent with the fact that all the states in the DTMC may return to the initial state, allowing very small traces. On the contrary, getting the less proba-ble traces (min) is hard since it requires a full exploration of the DTMC. Other abstraction/simulation techniques will be investigated in future work in order to allow such criteria and to improve the actual DF S algorithm.
The main threat to our case study is the nature of the con-sidered application. This first case study has been performed on a very particular kind of application: a web application accessible through PHP pages in a web browser. This kind of application allows a very flexible navigation from page to page either by clicking on the links in the different pages or by a direct access with a link in a bookmark or an e-mail for instance. In our future work, we will apply our approach on other cases from various domains (e.g., system engineering) where the transitions from state to state are more constrained.
5.
RELATED WORK
To the best of our knowledge, there is no approach prior-itizing behaviours statistically for testing SPLs in a family-based manner. The most related proposal (outlined in sec-tion 3) has been devised by Samih and Baudry [26]. This is a product-based approach and therefore requires selecting one or more products to test at the beginning of the method. One also needs that the DTMC covers all products of the SPL, which is not our assumption here.
There have been SPL test efforts to sample products for testing such as t-wise approaches (e.g. [7, 8, 25]). More re-cently sampling was combined with prioritization thanks to
the addition of weights on feature models and the definition of multiple objectives [15,16]. However, these approaches do not consider SPL behaviour in their analyses.
To consider behaviour in an abstract way, a full-fledged MBT approach [32] is required. Although behavioural MBT is well established for single-system testing [31], a survey [24] shows insufficient support of SPL-based MBT. How-ever, there have been efforts to combine sampling techniques with modelling ones (e.g. [20]). These approaches are also product-based, meaning that may miss opportunities to reuse tests amongst sampled products [34]. We believe that ben-efiting from the recent advances in behavioural modelling provided by the model checking community [1, 2, 5, 6, 13, 19], sound MBT approaches for SPL can be derived and interest-ing family-based scenarios combininterest-ing verification and testinterest-ing can be devised [11].
Our will is to apply ideas stemming from statistical testing and adapt them in an SPL context. For example, combining structural criteria with statistical testing has been discussed in [14, 30]. We do not make any assumption on the way the DTMC is obtained: via an operational profile [23] or by an-alyzing the source code or the specification [30]. However, a uniform distribution of probabilities over the DTMC would probably be less interesting. As noted by Witthaker [35], in such case only the structure of traces would be consid-ered and therefore basing their selection on their probabili-ties would just be a means to limit their number in a mainly random-testing approach. In such cases, structural test gen-eration has to be employed [12].
6.
CONCLUSION
In this paper, we combine concepts stemming from statis-tical testing with SPL sampling to extract products of in-terest according to the probability of their execution traces gathered in a discrete-time markov chain representing their usages. As opposed to product-based sampling approaches, we select a subset of the full SPL behaviour given as Fea-tured Transition Systems (FTS). This allows us to construct a new FTS representing only the executions of relevant prod-ucts. This such pruned FTS can be analyzed all at once, to enable allow test reuse amongst products and/or to scale model-checking techniques for testing and verification activ-ities. Future work will proceed to the improvement of the first implementation and its validation on other cases from various domains. There remains a number of challenges, the main one being an efficient trace extraction algorithm using abstraction and/or simulation techniques. We will also asso-ciate statistical prioritization to more classical test selection criteria like transition coverage and state coverage in order to improve the quality of the extracted traces.
Acknowledgments. Thanks to Jean-Roch Meurisse and Didier Belhomme for providing the Webcampus’ Apache ac-cess log.
7.
REFERENCES
[1] P. Asirelli, M. H. ter Beek, A. Fantechi, S. Gnesi, and F. Mazzanti. Design and validation of variability in product lines. In PLEASE ’11, pages 25–30. ACM, 2011.
[2] P. Asirelli, M. H. ter Beek, S. Gnesi, and A. Fantechi. Formal description of variability in product families. In SPLC ’11, pages 130–139. IEEE, 2011.
[3] Claroline. http://www.claroline.net/.
[4] A. Classen, M. Cordy, P.-Y. Schobbens, P. Heymans, A. Legay, and J.-F. Raskin. Featured Transition Systems : Foundations for Verifying
Variability-Intensive Systems and their Application to LTL Model Checking. TSE, PP(99):1–22, 2013. [5] A. Classen, P. Heymans, P. Schobbens, and A. Legay.
Symbolic model checking of software product lines. In ICSE ’11, 2011.
[6] A. Classen, P. Heymans, P. Schobbens, A. Legay, and J. Raskin. Model checking lots of systems: efficient verification of temporal properties in software product lines. In ICSE ’10, pages 335–344. ACM, 2010. [7] M. Cohen, M. Dwyer, and J. Shi. Interaction testing
of highly-configurable systems in the presence of constraints. In ISSTA 07, pages 129–139, 2007. [8] M. B. Cohen, M. B. Dwyer, and J. Shi. Coverage and
adequacy in software product line testing. In ROSATEA ’06, pages 53–63, 2006.
[9] M. Cordy, P. Heymans, P.-Y. Schobbens, A. M. Sharifloo, C. Ghezzi, and A. Legay. Verification for reliable product lines. arXiv:1311.1343, 2013.
[10] K. Czarnecki and A. Wasowski. Feature Diagrams and Logics: There and Back Again. In SPLC ’07, pages 23–34. IEEE, Sept. 2007.
[11] X. Devroey, M. Cordy, G. Perrouin, E.-Y. Kang, P.-Y. Schobbens, P. Heymans, A. Legay, and B. Baudry. A Vision for Behavioural Model-Driven Validation of Software Product Lines. ISoLA ’12, pages 208–222. Springer-Verlag, 2012.
[12] A. Feliachi and H. Le Guen. Generating transition probabilities for automatic model-based test generation. In ICST ’10, pages 99–102. IEEE, 2010. [13] D. Fischbein, S. Uchitel, and V. Braberman. A
foundation for behavioural conformance in software product line architectures. In ROSATEA ’06, pages 39–48. ACM, 2006.
[14] S.-D. Gouraud, A. Denise, M.-C. Gaudel, and
B. Marre. A new way of automating statistical testing methods. In ASE ’01. IEEE Computer Society, 2001. [15] C. Henard, M. Papadakis, G. Perrouin, J. Klein, and
Y. L. Traon. Multi-objective test generation for software product lines. SPLC ’13, pages 62–71. ACM, 2013.
[16] M. F. Johansen, Ø. Haugen, F. Fleurey, A. G. Eldegard, and T. Syversen. Generating better partial covering arrays by modeling weights on sub-product lines. In MoDELS ’12, pages 269–284, 2012. [17] K. C. Kang, S. G. Cohen, J. A. Hess, W. E. Novak,
and A. Spencer Peterson. Feature-Oriented domain analysis (FODA) feasibility study. Technical report, Soft. Eng. Inst., Carnegie Mellon Univ., 1990. [18] C. H. P. Kim, S. Khurshid, and D. S. Batory. Shared
execution for efficiently testing product lines. In
ISSRE ’12, pages 221–230, 2012.
[19] K. Lauenroth, K. Pohl, and S. Toehning. Model checking of domain artifacts in product line
engineering. In ASE ’09, pages 269–280. IEEE, 2009. [20] M. Lochau, S. Oster, U. Goltz, and A. Sch¨urr.
Model-based pairwise testing for feature interaction coverage in software product line engineering. Software Quality Journal, 20(3-4):567–604, 2012.
[21] A. P. Mathur. Foundations of software testing. Pearson Education, 2008.
[22] R. Michel, A. Classen, A. Hubaux, and Q. Boucher. A formal semantics for feature cardinalities in feature diagrams. VaMoS ’11, pages 82–89. ACM, 2011. [23] J. D. Musa, G. Fuoco, N. Irving, D. Kropfl, and
B. Juhlin. The operational profile. NATO ASI series F Comp. and Syst. Sc., 154:333–344, 1996.
[24] S. Oster, A. W¨obbeke, G. Engels, and A. Sch¨urr. Model-based software product lines testing survey. In Model-Based Testing for Embedded Systems, pages 339–382. CRC Press, 2011.
[25] G. Perrouin, S. Oster, S. Sen, J. Klein, B. Baudry, and Y. L. Traon. Pairwise testing for software product lines: comparison of two approaches. Software Quality Journal, 20(3-4):605–643, 2012.
[26] H. Samih and B. Baudry. Relating variability modelling and model-based testing for software product lines testing. In ICTSS ’12 DS, 2012. [27] S. Sampath, R. Bryce, G. Viswanath, V. Kandimalla,
and A. Koru. Prioritizing user-session-based test cases for web applications testing. In ICST ’08, pages 141–150, 2008.
[28] R. R. Sarukkai. Link prediction and path analysis using markov chains. Computer Networks, 33(1-6):377–386, 2000.
[29] Scrapy. http://scrapy.org/.
[30] P. Th´evenod-Fosse and H. Waeselynck. An investigation of statistical software testing. Softw. Test., Verif. Reliab., 1(2):5–25, 1991.
[31] J. Tretmans. Model based testing with labelled transition systems. In Formal methods and testing, pages 1–38. Springer-Verlag, 2008.
[32] M. Utting and B. Legeard. Practical model-based testing: a tools approach. Morgan Kaufmann, 2007. [33] S. Verwer, R. Eyraud, and C. Higuera. Pautomac: a
probabilistic automata and hidden markov models learning competition. Machine Learning, pages 1–26, 2013.
[34] A. von Rhein, S. Apel, C. K¨astner, T. Th¨um, and I. Schaefer. The PLA model: on the combination of product-line analyses. In VaMoS ’13. ACM, 2013. [35] J. A. Whittaker and M. G. Thomason. A markov chain model for statistical software testing. IEEE TSE, 20(10):812–824, 1994.
![Figure 1: The soda vending machine example [4]](https://thumb-eu.123doks.com/thumbv2/123doknet/14517362.721963/3.892.91.432.79.654/figure-the-soda-vending-machine-example.webp)