RESEARCH OUTPUTS / RÉSULTATS DE RECHERCHE
Author(s) - Auteur(s) :
Publication date - Date de publication :
Permanent link - Permalien :
Rights / License - Licence de droit d’auteur :
Bibliothèque Universitaire Moretus Plantin
Dépôt Institutionnel - Portail de la Recherche
researchportal.unamur.be
University of Namur
Children's microvascular traits and ambient air pollution exposure during pregnancy
and early childhood
Luyten, Leen J.; Dockx, Yinthe; Provost, Eline B.; Madhloum, Narjes; Sleurs, Hanne; Neven,
Kristof Y.; Janssen, Bram G.; Bové, Hannelore; Debacq-Chainiaux, Florence; Gerrits, Nele;
Lefebvre, Wouter; Plusquin, Michelle; Vanpoucke, Charlotte; De Boever, Patrick; Nawrot, Tim
S.
Published in: BMC Medicine DOI: 10.1186/s12916-020-01586-x Publication date: 2020 Document VersionPublisher's PDF, also known as Version of record
Link to publication
Citation for pulished version (HARVARD):
Luyten, LJ, Dockx, Y, Provost, EB, Madhloum, N, Sleurs, H, Neven, KY, Janssen, BG, Bové, H, Debacq-Chainiaux, F, Gerrits, N, Lefebvre, W, Plusquin, M, Vanpoucke, C, De Boever, P & Nawrot, TS 2020, 'Children's microvascular traits and ambient air pollution exposure during pregnancy and early childhood: Prospective evidence to elucidate the developmental origin of particle-induced disease', BMC Medicine, vol. 18, no. 1, 128. https://doi.org/10.1186/s12916-020-01586-x
General rights
Copyright and moral rights for the publications made accessible in the public portal are retained by the authors and/or other copyright owners and it is a condition of accessing publications that users recognise and abide by the legal requirements associated with these rights. • Users may download and print one copy of any publication from the public portal for the purpose of private study or research. • You may not further distribute the material or use it for any profit-making activity or commercial gain
• You may freely distribute the URL identifying the publication in the public portal ?
Take down policy
If you believe that this document breaches copyright please contact us providing details, and we will remove access to the work immediately and investigate your claim.
R E S E A R C H A R T I C L E
Open Access
Children
’s microvascular traits and ambient
air pollution exposure during pregnancy
and early childhood: prospective evidence
to elucidate the developmental origin of
particle-induced disease
Leen J. Luyten
1,2, Yinthe Dockx
1, Eline B. Provost
1,3, Narjes Madhloum
1, Hanne Sleurs
1, Kristof Y. Neven
1,
Bram G. Janssen
1, Hannelore Bové
1, Florence Debacq-Chainiaux
2, Nele Gerrits
3, Wouter Lefebvre
3,
Michelle Plusquin
1, Charlotte Vanpoucke
4, Patrick De Boever
1,3and Tim S. Nawrot
1,5*Abstract
Background: Particulate matter exposure duringin utero life may entail adverse health outcomes later in life. The microvasculature undergoes extensive, organ-specific prenatal maturation. A growing body of evidence shows that cardiovascular disease in adulthood is rooted in a dysfunctional fetal and perinatal development, in particular that of the microcirculation. We investigate whether prenatal or postnatal exposure to PM2.5(particulate matter with a
diameter≤ 2.5 μm) or NO2is related to microvascular traits in children between the age of four and six.
Methods: We measured the retinal microvascular diameters, the central retinal arteriolar equivalent (CRAE) and central retinal venular equivalent (CRVE), and the vessel curvature by means of the tortuosity index (TI) in young children (mean [SD] age 4.6 [0.4] years), followed longitudinally within the ENVIRONAGE birth cohort. We modeled daily prenatal and postnatal PM2.5and NO2exposure levels for each participant’s home address using a
high-resolution spatiotemporal model.
Results: An interquartile range (IQR) increase in PM2.5exposure during the entire pregnancy was associated with a
3.85-μm (95% CI, 0.10 to 7.60; p = 0.04) widening of the CRVE and a 2.87-μm (95% CI, 0.12 to 5.62; p = 0.04)
widening of the CRAE. For prenatal NO2exposure, an IQR increase was found to widen the CRVE with 4.03μm (95%
CI, 0.44 to 7.63;p = 0.03) and the CRAE with 2.92 μm (95% CI, 0.29 to 5.56; p = 0.03). Furthermore, a higher TI score was associated with higher prenatal NO2exposure. We observed a postnatal effect of short-term PM2.5exposure on
the CRAE and a childhood NO2exposure effect on both the CRVE and CRAE.
(Continued on next page)
© The Author(s). 2020 Open Access This article is licensed under a Creative Commons Attribution 4.0 International License, which permits use, sharing, adaptation, distribution and reproduction in any medium or format, as long as you give appropriate credit to the original author(s) and the source, provide a link to the Creative Commons licence, and indicate if changes were made. The images or other third party material in this article are included in the article's Creative Commons licence, unless indicated otherwise in a credit line to the material. If material is not included in the article's Creative Commons licence and your intended use is not permitted by statutory regulation or exceeds the permitted use, you will need to obtain permission directly from the copyright holder. To view a copy of this licence, visithttp://creativecommons.org/licenses/by/4.0/. The Creative Commons Public Domain Dedication waiver (http://creativecommons.org/publicdomain/zero/1.0/) applies to the data made available in this article, unless otherwise stated in a credit line to the data.
* Correspondence:[email protected]
1
Centre for Environmental Sciences, Hasselt University, Diepenbeek, Belgium 5Department of Public Health & Primary Care, Occupational and
Environmental Medicine, Leuven University, Leuven, Belgium Full list of author information is available at the end of the article
(Continued from previous page)
Conclusions: Our results link prenatal and postnatal air pollution exposure with changes in a child’s microvascular traits as a fundamental novel mechanism to explain the developmental origin of cardiovascular disease.
Keywords: CRAE, CRVE, Tortuosity index, Air pollution, Child health
Background
A growing body of evidence shows that particulate-induced health effects are rooted in dysfunctional fetal and perinatal development [1]. At least four lines of evi-dence contribute to this statement. First, during the earliest phases of life, the fetus can be exposed to par-ticulate matter via the placenta. An ex vivo human pla-cental perfusion model has shown that trans-plapla-cental transport is able to channel particles with a diameter smaller than 240 nm [2]. In addition, an in vivo rabbit model exposed to diesel exhaust demonstrated that par-ticles can even be transferred into the fetal bloodstream [3]. Accordingly, in human context, it was recently found that even low concentrations of ambient particles, including black carbon, are present in detectable quan-tities at the fetal side of the placenta [4]. Second, in utero exposure to particulate air pollution can increase oxidative stress and inflammatory markers, which poten-tially leads to molecular modifications in for example placental tissue [5]. Third, both DNA damage, measured by for example DNA adducts [6], elevated levels of micronuclei [7], and DNA methylation levels [8], and epigenetic markers such as DNA methylation [9], his-tone modification, and miRNAs expression [10], which ultimately regulate chromatin structure or gene activity, have been associated with in utero exposure to particu-late air pollution. Finally, several postnatal effects reparticu-lated to prenatal particulate exposure have been elaborated in re-cent research, for example on molecular longevity, as reflected by telomere length [11], or on clinical factors such as birth weight [12]. In turn, these effects have been linked to (markers of) disease development later in life, such as in-creased stiffness of the carotid artery or an inin-creased risk of cardiovascular disease development [13,14].
The microcirculation makes up a large part of the hu-man vasculature and undergoes extensive, organ-specific perinatal maturation [15, 16]. Over the past years, fun-dus photography has increasingly been used to assess microvascular health [17]. A strong correlation exists be-tween macrovascular and microvascular parameters in adults, which has been shown for example by Seidel-mann and colleagues: in 2617 persons with the highest quartile of retinal venular diameter, contrasting the per-sons with the lowest venular diameter quartile, this re-sulted in a 2.4% higher risk of atherosclerotic events during a 10-year follow-up [18]. Therefore, changes in the microvasculature of the retina at an early age can be
an indicator of cardiovascular disease later in life [19,
20]. Furthermore, particulate matter air pollution is an important risk factor for adverse cardiovascular effects later in life [21–24]. Recently, our research group de-scribed an association between short-term ambient air pollution exposure at school and an increase in retinal arteriolar diameter in 10-year-old children [25]. How-ever, to date, no studies have considered changes in the maturation of the microvasculature in relation to pre-natal exposure to particulate air pollution. By making use of the prospective ENVIRonmental influence ON AGEing in early life (ENVIRONAGE) birth cohort, we tested the hypothesis in 4- to 6-year-olds that prenatal and postnatal particulate air pollution exposures are as-sociated with changes in the diameter and curvature of retinal blood vessels in early childhood.
Materials and methods
Study population
The participants of this study are enrolled in the on-going prospective ENVIRONAGE birth cohort. Detailed information on data collection within this cohort is de-scribed in the article of Janssen and colleagues [26]. Be-fore delivery, an initial informed consent form was signed by the mothers, and after delivery, the participants filled out a questionnaire which provided us detailed med-ical and lifestyle data, including their residential ad-dress(es) during pregnancy, maternal age, maternal weight and height, maternal pre-pregnancy body mass index (BMI), maternal education, and maternal smoking habits and alcohol consumption throughout pregnancy. Add-itionally, perinatal parameters, such as the date of birth, gestational age, sex, birth weight, and birth length, were obtained from the participant’s medical files. Maternal education was coded as low (no diploma or primary school), middle (high school diploma), and high (college or university degree). Smoking status was classified as non-smokers, stopped smoking before pregnancy, and current smokers (smoked during pregnancy). Alcohol use was subdivided in mothers who did not consume alcohol during pregnancy and mothers who consumed alcohol at least occasionally during gestation.
The follow-up examinations in this study population were performed between October 3, 2014, and July 12, 2018. Within this timeframe, 587 children were between 4 and 6 years old and could hence participate in the first follow-up step of ENVIRONAGE. Thirteen mother-child
pairs were not eligible for participation since their child had passed away (n = 1) or they had moved to another country or too far from the location where the examin-ation took place (n = 12). Of the remaining 574 mother-child pairs, 74 people could not be contacted by e-mail or phone since no up-to-date contact details could be retrieved, three mother-child pairs could not be con-tacted at the moment that the child had an age between four and six, 165 women refused to participate, and 332 renewed consent (i.e., a final participation rate of 58%) (Additional file 1: Fig. S1). A second questionnaire was filled out by the participants on the day of the follow-up examination, which provided us with information on lifestyle conditions of the child, for example on the pas-sive exposure to parental smoking. Paspas-sive smoking sta-tus was classified as not exposed, exposed by one parent, or exposed via smoking of both parents.
Clinical measurements
The clinical investigation of the retinal blood vessels and blood pressure was performed by a single trained exam-iner, following standardized guidelines. Children always gave their assent before measurements were initiated. The blood pressure of the participants was measured with an automated oscillometric upper-arm blood-pressure monitor (Omron 705IT, Omron Corporation, Japan). To ensure accurate measurements, cuffs adapted for children were used depending on the child’s right upper arm circumference. Measurements were per-formed by a standardized method, as described by the European Society of Hypertension [27]. In summary, after the child had rested for 10 min in supine position, a trained observer obtained five consecutive readings of the systolic (SBP) and diastolic (DBP) blood pressure of the right arm, with 1-min intervals. Average SBP and DBP were based on the last three readings. Mean arterial pressure (MAP) was calculated via the equation: MAP =
(2/3 × DBP) + (1/3 × SBP).
We used retinal vascular imaging as a proxy to exam-ine the systemic microvasculature between the age of four and six. This approach has been proven successful in other studies that examined early lifestyle factors re-lated to cardiovascular disease [28]. To determine the retinal blood vessel parameters, fundus pictures of the oculus dextrus and oculus sinister were taken with a Canon CR-2 plus 45° 6.3 megapixel digital non-mydriatic retinal camera (Hospithera, Brussels, Belgium). These pictures were subsequently analyzed with the MONA® software (version 2.1.1, VITO Health, Mol, Belgium). First, the diameter of the optic disk (OD) was determined for each picture, since all distance measure-ments within the fundus were set relative to this value. Next, the widths of the retinal arterioles and venules were calculated within the predetermined area of 0.5
and 1 times the OD diameter, starting from the margin of the optic disk (Additional file1: Fig. S2). The diame-ters of the six largest arterioles and six largest venules in this zone were used in the revised Parr-Hubbard formula to calculate the central retinal arteriolar equivalent (CRAE) and central retinal venular equivalent (CRVE) [29]. The tortuosity index (TI) of the retinal vasculature was determined between 1.5 and 5 times the radius of the OD and can be described as a measure for the curva-ture of the retinal vessels in this zone. The normalized tortuosity is calculated as the average tortuosity of the branch segments, where the tortuosity of a branch seg-ment is the ratio of the line traced on each tree along the vessel axis between 0.5 and 2 times the OD diameter and the line connecting the endpoints. Segmentations are cropped centered on the OD whereby the inner and outer radii were taken at 1.5 and 5.0 times the radius of the OD [30].
Of the 332 mother-child pairs, 74 were not included in the statistical analyses since no (good quality) images of the retinal vasculature of either one eye were available (Additional file 1: Fig. S1). Pictures could not be taken due to the participant having autism spectrum disorder (n = 2), severe mental retardation (n = 1), blindness (n = 1), and lack of concentration or unwillingness to partici-pate (n = 20). For 50 participants, the quality of the pic-tures was suboptimal, due to children’s movement of their body or eyes during the capturing of the images. Of the remaining 258 mother-child pairs, the data on al-cohol use during pregnancy were missing for three mothers, and for ten children, no blood pressure could be determined at the moment of the follow-up visit. Therefore, these 13 participants were excluded, and final statistics were performed on 245 mother-child pairs.
Exposure assessment
The maternal residential address was used to interpolate regional background levels of PM2.5and NO2
concentra-tions (μg/m3
) during pregnancy and for the postnatal period, based on a high-resolution spatial-temporal interpolation method [31], as described in the cohort profile paper of Janssen et al. The overall model per-formance was assessed by leave-one-out cross-validation, including 44 monitoring stations for NO2 and 34
sta-tions for PM2.5. The validation statistics of the
interpolation tool explained more than 78% of the tem-poral and spatial variability in Flanders for NO2and 80%
for PM2.5 [32,33]. Furthermore, accuracy of our
expos-ure models was recently proven by the correlation be-tween the urinary load of nano-sized black carbon particles in children and residential levels of PM2.5 and
NO2[34], and for prenatal exposure by a correlation
be-tween this exposure model and the placental black car-bon load [4].
The described model provided daily air pollution levels for each participant. Daily values were averaged for each specific time window during the pregnancy: first trimes-ter (i.e., date of conception until 13 weeks of pregnancy), second trimester (i.e., 14 weeks until 26 weeks of preg-nancy), third trimester (i.e., 27 weeks of pregnancy until delivery), and the entire period of pregnancy, from the date of conception until the date of delivery. Ultrasound imaging data combined with the first day of the mother’s last menstrual period were used to estimate the date of conception [35]. Postnatal PM2.5 and NO2 exposures
were averaged for the day of the follow-up visit, the day before the follow-up visit, and the week before the follow-up visit as short-term exposure windows, and the average exposure during childhood (i.e., the average daily exposure from the day of birth until the day before the follow-up visit) as long-term exposure window. Exposure data during childhood were available for 226 out of the 245 participants. For mothers who moved during preg-nancy (n = 21) and between birth and follow-up examin-ation (n = 69), we calculated the specific exposures, allowing for the changes in the corresponding period.
Statistics
We used the SAS software (version 9.4; SAS Institute Inc., Cary, NC, USA) for data analysis. Normality and equality of variances, as assumptions of model linearity, were tested with the Shapiro-Wilk statistic and Q-Q plots of the residuals, respectively. Differences in charac-teristics between participants and non-participants of the follow-up study were tested by means of a two-sided t test for continuous variables and with a chi-square test for the categorical variables. Unadjusted correlations be-tween prenatal exposure to PM2.5and NO2, and the
ret-inal microvascular characteristics, as well as between prenatal and postnatal air pollution levels, were exam-ined by means of Pearson’s correlation. In the main ana-lyses, the association of retinal vessel widths (CRAE and CRVE) and vessel curvature (TI) with either prenatal or postnatal PM2.5 and NO2exposures was assessed using
multivariable linear regression modeling. Pregnancy trimester-averaged PM2.5 and NO2exposure levels were
entered into the same model in order to estimate inde-pendent trimester-specific effects. Minimally adjusted models were adjusted for sex and age (years), and we ad-justed the analyses for the following variables: age (years), sex, ethnicity, mean arterial blood pressure and BMI of the child at the moment of the follow-up visit, the season in which the follow-up examination took place, birth weight (grams), the age of the mother during pregnancy and her pre-pregnancy BMI, the education level of the mother, alcohol use of the mother during pregnancy, the smoking habits of the mother before and during pregnancy, and the exposure of the child to
passive smoking. The interaction between whole preg-nancy air pollution exposure and age, sex, MAP, and BMI on the microvascular parameters was explored using continuous variables. We found a significant inter-action for MAP and prenatal NO2 exposure on CRAE
and CRVE; therefore, we additionally constructed a vari-able indicating high and low MAP (based on the me-dian) and stratified the analysis accordingly. In the secondary analyses, we combined entire pregnancy ex-posure and postnatal exex-posures during either the day of the up examination, the week before the follow-up visit, or the entire childhood exposure in the same model. The magnitude of all associations was expressed for an interquartile range (IQR; between the 25th and 75th percentile) increase in the observed exposure.
We performed three separate sensitivity analyses. Firstly, a sensitivity analysis was conducted to assess the association between prenatal air pollution exposure and the CRVE, CRAE, and TI in a population excluding mothers with diagnosed hypertension during pregnancy (n = 8) and those with gestational diabetes (n = 15). Fur-thermore, Wei and colleagues found that prematurity could also affect the retinal vessel characteristics of chil-dren later in life [36]. Therefore, we performed an add-itional sensitivity analysis excluding the children who were born before 37 weeks of gestation (n = 12). Finally, a third sensitivity analysis was conducted, excluding mothers who smoked during pregnancy (n = 32).
Results
Study population characteristics
Background characteristics of the 242 non-participants were similar to those of the participants with analyzed retinal images and full data (n = 245) and the partici-pants of the follow-up study with poor quality pictures or without full data (n = 87) with respect to parity, pre-pregnancy BMI and smoking behavior, child’s sex distri-bution, birth weight, and birth length (Additional file1: Table S1). However, mothers that renewed consent were significantly older at the birth of their child and were more likely to have a higher education level and to be of European ancestry compared with non-participants. Pre-natal levels of residential particulate air pollution by tri-mester did not differ, while the total gestational exposure was on average slightly higher in participants compared with non-participants. For prenatal NO2, none
of the exposure windows showed difference between participants and non-participants. The postnatal PM2.5
and NO2 exposures did not differ between the three
groups.
The characteristics of the 245 mother-child pairs participating in this study are summarized in Table 1. At the time of birth, the mothers had an average (standard deviation) age of 29.9 (4.1) years. Their
pre-pregnancy BMI was 24.4 (4.6) kg/m2. Most of the mothers had never smoked (n = 167; 68.2%) or stopped smoking before pregnancy (n = 46; 18.8%), and 78.8% of the mothers did not consume alcohol throughout their pregnancy. Almost three quarters of
all women were highly educated (67.4%), having a college degree or higher.
At the moment of the follow-up examination, the chil-dren (52.6% girls) had an average age of 4.6 (0.4) years, an average height of 107.3 (4.9) cm, and an average
Table 1 Average (SD) or numbers (%) of the characteristics of the mother-child pairs included in this study (n = 245), and the girls (n = 129) and boys (n = 116) separately. The p value depicts the difference between girls and boys
Characteristic Combined Girls Boys p value
Mother
Age at birth child, years 29.9 (4.1) 30.1 (4.1) 29.7 (4.1) 0.41
Pre-pregnancy BMI, kg/m2 24.4 (4.6) 24.4 (4.9) 24.3 (4.3) 0.78
Smoking behavior during pregnancy 0.48
Never smoked 167 (68.2) 90 (36.8) 77 (31.4)
Stopped smoking before pregnancy 46 (18.8) 24 (9.8) 22 (9.0)
Smoked during pregnancy 32 (13.0) 15 (6.1) 17 (6.9)
Alcohol consumption during pregnancy 0.67
Yes 52 (21.2) 26 (10.6) 26 (10.6)
No 193 (78.8) 103 (42.1) 90 (36.7)
Education level 0.59
Low (no high school diploma) 16 (6.5) 7 (2.9) 9 (3.7) Middle (high school diploma) 64 (26.1) 34 (13.9) 30 (12.2) High (college degree or higher) 165 (67.4) 88 (35.9) 77 (31.4) Child
Ethnicity 0.26
European 230 (93.9) 119 (48.6) 111 (45.3)
Non-European 15 (6.1) 10 (4.1) 5 (2.0)
Birth weight, g 3446.6 (429.8) 3413.3 (412.9) 3483.5 (446.8) 0.20 Age at time of follow-up, years 4.6 (0.4) 4.6 (0.4) 4.5 (0.4) 0.75 Height at time of follow-up, cm 107.3 (4.9) 107.9 (5.1) 107.8 (4.6) 0.81 Weight at time of follow-up, kg 18.7 (2.7) 18.8 (2.7) 18.7 (2.7) 0.70 BMI at time of follow-up, kg/m2 16.0 (1.4) 16.1 (1.4) 16.0 (1.4) 0.68
Season at follow-up 0.82
Spring 83 (33.9) 46 (18.8) 37 (15.1)
Summer 48 (19.6) 25 (10.2) 23 (9.4)
Autumn 42 (17.1) 18 (7.3) 24 (9.8)
Winter 72 (29.4) 40 (16.3) 32 (13.1)
Systolic blood pressure, mmHg 97.6 (8.2) 98.1 (8.0) 97.0 (8.5) 0.30 Diastolic blood pressure, mmHg 53.9 (6.9) 54.5 (6.6) 53.2 (7.1) 0.13 Mean arterial pressure, mmHg 68.5 (6.0) 69.1 (5.6) 67.8 (6.3) 0.10
Exposure to passive smoking 0.43
Not exposed 170 (69.4) 88 (35.9) 82 (33.5)
Exposed via one parent 46 (18.8) 23 (9.4) 23 (9.4)
Exposed via both parents 29 (11.8) 18 (7.3) 11 (4.5)
CRAE,μm 180.8 (14.2) 182.5 (13.0) 178.9 (15.3) 0.05
CRVE,μm 251.0 (19.4) 253.7 (18.1) 247.9 (20.5) 0.02
TI 0.889 (0.012) 0.891 (0.012) 0.887 (0.013) 0.04
weight of 18.7 (2.7) kg. Mean arterial pressure averaged 68.5 (6.0) mmHg. Most of the follow-up visits took place during spring (33.9%) and winter (29.4%). Most children were not exposed to passive smoking in their home en-vironment (n = 170), while 18.8% of the children were exposed via one parent and 11.8% of the children were exposed to passive smoking via both parents.
Exposure characteristics
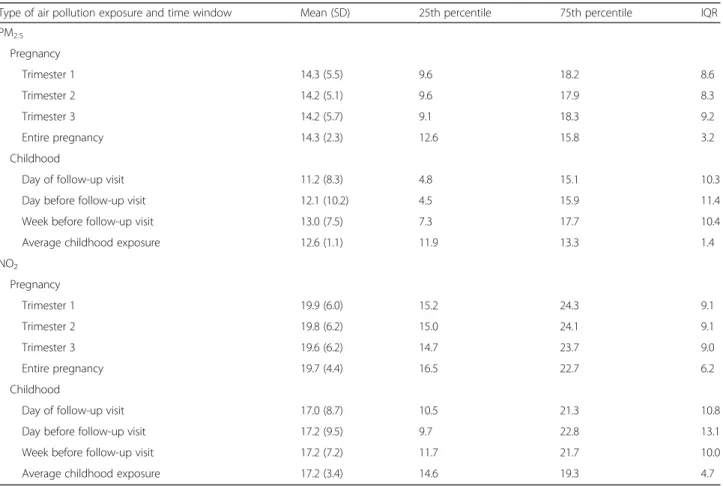
Table 2 summarizes the PM2.5 and NO2exposure
char-acteristics of the study population during pregnancy and early childhood. The average exposures for both air pol-lution components were comparable between the three trimesters and the entire pregnancy. For PM2.5, an
aver-age exposure (IQR) of 14.3 (12.6–15.8) μg/m3
was calcu-lated for the entire pregnancy, and for the same period, the average NO2level was 19.7 (16.5–22.7) μg/m3. The
average (IQR) childhood exposure level calculated for PM2.5 was 12.6 (11.9–13.3) μg/m3, while for NO2, this
was 17.2 (14.6–19.3) μg/m3
. All PM2.5 and NO2
expo-sures of the three trimesters and whole pregnancy were strongly correlated (p ≤ 0.02), except for the first and third trimester NO2(r = − 0.07, p = 0.29), third trimester
NO2and second trimester PM2.5 (r = 0.03, p = 0.65), and
first trimester PM2.5and whole pregnancy NO2exposure
(r = − 0.04, p = 0.51). A strong correlation was identified for exposure during the entire pregnancy and lifetime of the children, both for PM2.5 (r = 0.32, p < 0.0001) and
NO2exposures (r = 0.81, p < 0.0001). Microvasculature characteristics
The average CRAE, CRVE, and TI values of both eyes were used for each child if both pictures were available. For 200 participants, the retina pictures of both eyes were used; for 27 individuals, only that of the left eye; and for 18 children, only the picture of the right eye was available for analysis since the picture of the other eye was of insufficient quality. There was no difference be-tween the values of either one or two eyes for the CRAE (p = 0.38), CRVE (p = 0.38), or TI (p = 0.38).
For all children, the average (SD) CRAE and CRVE were 180.8 (14.2) μm and 251.0 (19.4) μm, respectively, and the average TI was 0.889 (0.012) (Table 1). The CRAE, CRVE, and TI were slightly higher in girls than in boys (Table 1). A positive correlation was found be-tween both CRVE and CRAE (r = 0.60, p < 0.0001),
Table 2 Exposure details on PM2.5and NO2air pollution (μg/m3) during different time windows of pregnancy and different periods
during the childhood of the participants (n = 245)
Type of air pollution exposure and time window Mean (SD) 25th percentile 75th percentile IQR PM2.5 Pregnancy Trimester 1 14.3 (5.5) 9.6 18.2 8.6 Trimester 2 14.2 (5.1) 9.6 17.9 8.3 Trimester 3 14.2 (5.7) 9.1 18.3 9.2 Entire pregnancy 14.3 (2.3) 12.6 15.8 3.2 Childhood
Day of follow-up visit 11.2 (8.3) 4.8 15.1 10.3
Day before follow-up visit 12.1 (10.2) 4.5 15.9 11.4
Week before follow-up visit 13.0 (7.5) 7.3 17.7 10.4
Average childhood exposure 12.6 (1.1) 11.9 13.3 1.4
NO2 Pregnancy Trimester 1 19.9 (6.0) 15.2 24.3 9.1 Trimester 2 19.8 (6.2) 15.0 24.1 9.1 Trimester 3 19.6 (6.2) 14.7 23.7 9.0 Entire pregnancy 19.7 (4.4) 16.5 22.7 6.2 Childhood
Day of follow-up visit 17.0 (8.7) 10.5 21.3 10.8
Day before follow-up visit 17.2 (9.5) 9.7 22.8 13.1
Week before follow-up visit 17.2 (7.2) 11.7 21.7 10.0
Average childhood exposure 17.2 (3.4) 14.6 19.3 4.7
between CRVE and TI (r = 0.19, p = 0.003), and between CRAE and TI (r = 0.14, p = 0.02).
Main analyses
Associations between prenatal air pollution exposure and retinal microvasculature
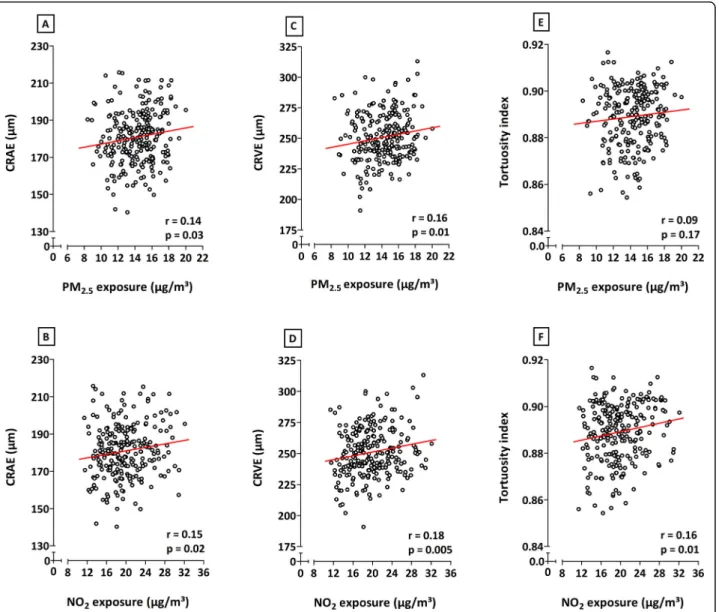
Correlations analyses, without additional adjustments, showed positive relationships between in utero exposure to both PM2.5and NO2during the entire pregnancy and
the CRAE, CRVE, and TI (Fig. 1). Only the association between entire pregnancy exposure to PM2.5 and the
tortuosity of the retinal vessels was not significant (p ≤ 0.05). Correlations between microvascular traits and PM2.5or NO2exposure during the separate trimesters of
pregnancy were only significant between the third tri-mester NO2exposure and TI (data not shown).
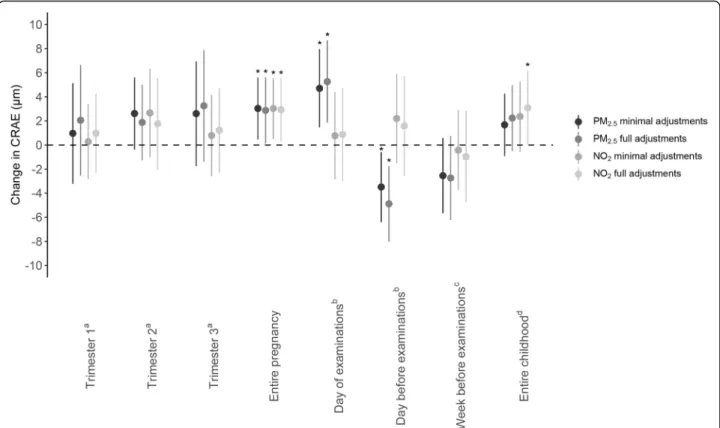
Multiple linear regression modeling showed a positive association between entire pregnancy exposure to PM2.5
and CRAE in both minimally and fully adjusted models (Fig.2). With full adjustments, for every IQR increase in PM2.5 air pollution exposure during pregnancy, a
2.87-μm widening of the arteriolar diameter was observed (95% CI, 0.12 to 5.62;p = 0.04). For whole pregnancy ex-posure to NO2, a widening of 2.92μm of the arterial
diameter was determined for every IQR increase in ex-posure (95% CI, 0.29 to 5.56; p = 0.03). No significant changes in CRAE were observed for increased levels of either NO2or PM2.5exposure during the three separate
trimesters of pregnancy. An IQR increment in prenatal
Fig. 1 Correlations between exposure to either PM2.5(first row) or NO2(second row) during the entire pregnancy and CRAE (a, b), CRVE (c, d),
and tortuosity index (e, f). The respectiver and p values are depicted on each plot. Abbreviations: CRAE, central retinal arteriolar equivalent; CRVE, central retinal venular equivalent; NO2, nitrogen dioxide; PM2.5, particulate matter with a diameter smaller than 2.5μm
air pollution exposure during the entire pregnancy was associated with a 3.85-μm (95% CI, 0.10 to 7.60; p = 0.04) higher CRVE for PM2.5 and a 4.03-μm (95% CI,
0.44 to 7.63;p = 0.03) widening of the retinal venules for NO2 exposure in the fully adjusted models (Fig. 3).
Again, as observed for the CRAE, no significant changes in CRVE were determined in association with trimester-specific exposure. PM2.5exposure during pregnancy was
not associated with the tortuosity index. However, an as-sociation between TI and in utero NO2 exposure was
found in both minimally and fully adjusted models. In fully adjusted models, an IQR increase in prenatal NO2
exposure over the entire pregnancy was associated with a 0.0028 (95% CI, 0.0005 to 0.0051,p = 0.02) higher TI, which was mainly driven by the exposure in the third trimester (Fig.4).
With same full adjustments as before, we explored the interaction between age, sex, MAP and BMI, and micro-vascular parameters using continuous variables. These
interaction terms were all non-significant (p ≥ 0.18) ex-cept borderline significance for mean arterial pressure in association with both CRAE and CRVE for whole preg-nancy NO2 exposure. Categorizing MAP above and
below the median revealed stronger prenatal NO2
expos-ure effects on CRAE and CRVE associations in children in the high MAP group (Additional file1: Table S2).
Associations between postnatal PM2.5and NO2exposures and retinal microvasculature
Exposure to PM2.5 on the day of the follow-up
examin-ation and the day before the visit had a significant effect on the CRAE (Fig. 2) but not on the CRVE (p ≥ 0.10)
(Fig. 3). The arterial diameter was 5.26μm wider (95% CI, 1.86 to 8.67, p = 0.003) for every IQR increase in PM2.5exposure on the day of the measurements, while a
narrowing of 4.89μm (95% CI, − 8.02 to − 1.76, p = 0.002) was determined for every IQR higher PM2.5
ex-posure on the day before the follow-up visit. No
Fig. 2 Associations between CRAE and PM2.5or NO2exposure during pregnancy or during childhood. Estimates are given as change (95% CI) for
every IQR increase in PM2.5(two darker gray dots) or NO2(two lighter gray dots). Minimally adjusted models were adjusted for sex and age
(years); fully adjusted models were adjusted for age (years), sex, ethnicity, mean arterial blood pressure and BMI of the child at the moment of the follow-up visit, the season in which the follow-up examination took place, birth weight (grams), maternal age at the birth of her child and pre-pregnancy BMI, maternal education level, alcohol use of the mother during pre-pregnancy, smoking habits of the mother before and during pregnancy, and the exposure of the child to passive smoking.aModel adjusted for the three pregnancy trimester-averaged exposures levels. bModel adjusted for exposure on the day of the follow-up visit and exposure of the day preceding the follow-up visit.cModel adjusted for
exposure on the day of the follow-up visit and exposure of the week preceding the follow-up visit.dModel adjusted for exposure on the day of
the follow-up visit and average childhood exposure from the day of birth until the day before the follow-up examination.Abbreviations: CI, confidence interval; CRAE, central retinal arteriolar equivalent; IQR, interquartile range; NO2, nitrogen dioxide; PM2.5, particulate matter with a
associations were found between NO2exposure and either
CRAE, CRVE, or TI for exposure on the day on which, or the day before, the retinal images were taken. When the exposure of the week before the follow-up examination was considered, an association between NO2 exposure
and CRVE could be identified in the minimally adjusted model, which disappeared following full adjustment (Fig.3). In case of average exposure during the lifetime of the children, in fully adjusted models, we observed a 3.08-μm (95% CI, − 0.01 to 6.18, p = 0.05) widening of the CRAE (Fig.2) and a 4.17-μm (95% CI, − 0.01 to 8.35, p =
0.05) widening of the CRVE (Fig.3) for every IQR increase in NO2during the child’s lifetime.
Secondary analyses
Associations between retinal microvasculature and
residential air pollution in combined prenatal and postnatal exposure models
In the secondary analyses, we combined prenatal expos-ure during the entire pregnancy and postnatal exposexpos-ure
to either PM2.5 or NO2 in one model. NO2 exposure
during the entire gestation was correlated with both short-term exposure (day of the follow-up, day before the follow-up, and week before follow-up; r = 0.35, r = 0.34, andr = 0.45 respectively, p < 0.0001) and long-term exposure (entire childhood;r = 0.81, p < 0.0001) to ambi-ent NO2. For PM2.5, we only noted a correlation
be-tween entire pregnancy exposure and postnatal exposure during the entire childhood (r = 0.32, p < 0.0001).
Only the associations between postnatal exposure to PM2.5 on the day of, or the day before, the follow-up
visit and CRAE remained significant (p = 0.003) in models mutually adjusted for exposure during the entire pregnancy (results not shown). However, adjusting mod-eled entire pregnancy exposure for short-term postnatal exposure (i.e., on the day of the follow-up, or on the day or the week before the examination) increased the effect estimates for both the CRAE and CRVE, while the esti-mates for the TI did not substantially change. Moreover, the associations with entire pregnancy exposure and the
Fig. 3 Associations between CRVE and PM2.5or NO2exposure during pregnancy or during childhood. Estimates are given as change (95% CI) for
every IQR increase in PM2.5(two darker gray dots) or NO2(two lighter gray dots). Minimally adjusted models were adjusted for sex and age (years);
fully adjusted models were adjusted for age (years), sex, ethnicity, mean arterial blood pressure and BMI of the child at the moment of the follow-up visit, the season in which the follow-up examination took place, birth weight (grams), maternal age at the birth of her child and pre-pregnancy BMI, maternal education level, alcohol use of the mother during pregnancy, smoking habits of the mother before and during pregnancy, and the exposure of the child to passive smoking.aModel adjusted for the three pregnancy trimester-averaged exposures levels.bModel adjusted for exposure on the
day of the follow-up visit and exposure of the day preceding the follow-up visit.cModel adjusted for exposure on the day of the follow-up visit and
exposure of the week preceding the follow-up visit.dModel adjusted for exposure on the day of the follow-up visit and average childhood exposure
from the day of birth until the day before the follow-up examination.Abbreviations: CI, confidence interval; CRVE, central retinal venular equivalent; IQR, interquartile range; NO2, nitrogen dioxide; PM2.5, particulate matter with a diameter smaller than 2.5μm. *p ≤ 0.05
retinal vessel diameter and tortuosity remained, except for CRVE and TI after adjustment of the model for NO2
exposure during the day or in the week before the follow-up examination (Table 3). Including exposure during the entire childhood into the model decreased the estimates of both the CRVE and TI in association with every IQR increase in whole pregnancy PM2.5 and
NO2exposures and that of the CRAE in association with
prenatal NO2, while a higher estimate for the CRAE was
found in association with increased prenatal PM2.5
ex-posure after mutual adjustment for entire childhood PM2.5 exposure. Only the latter association remained
significant in the model including whole postnatal air pollution exposure (Table3).
Sensitivity analyses
Excluding mothers who were diagnosed with hyperten-sion (n = 8) and gestational diabetes (n = 15) during pregnancy slightly decreased the reported estimates of all three retinal vessel characteristics, in association with
both of the examined whole pregnancy exposures (Add-itional file1: Table S3). The associations between the en-tire pregnancy PM2.5 exposure and both CRVE and
CRAE, and between NO2 exposure during the entire
gestation and CRAE lost their significance (p > 0.06). Similar findings could be concluded for the sensitivity analysis excluding newborns with a gestational age lower than 37 weeks (n = 12) (Additional file 1: Table S4). However, the association between entire pregnancy NO2
exposure and CRAE remained significant in this sub-group. Finally, a third sensitivity analysis excluding mothers who had smoked during pregnancy (n = 30) did not substantially alter the described relationships be-tween the retinal vessel characteristics and either PM2.5
or NO2 exposure during pregnancy (Additional file 1:
Table S5).
Discussion
We have evaluated the associations between gestational and childhood exposures to ambient air pollution and
Fig. 4 Associations between TI and PM2.5or NO2exposure during pregnancy or during childhood. Estimates are given as change (95% CI) for every IQR
increase in PM2.5(two darker gray dots) or NO2(two lighter gray dots). Minimally adjusted models were adjusted for sex and age (years); fully adjusted
models were adjusted for age (years), sex, ethnicity, mean arterial blood pressure and BMI of the child at the moment of the follow-up visit, the season in which the follow-up examination took place, birth weight (grams), maternal age at the birth of her child and pre-pregnancy BMI, maternal education level, alcohol use of the mother during pregnancy, smoking habits of the mother before and during pregnancy, and the exposure of the child to passive smoking.aModel adjusted for the three pregnancy trimester-averaged exposures levels.bModel adjusted for exposure on the day of the follow-up visit and
exposure of the day preceding the follow-up visit.cModel adjusted for exposure on the day of the follow-up visit and exposure of the week preceding the follow-up visit.dModel adjusted for exposure on the day of the follow-up visit and average childhood exposure from the day of birth until the day before
the follow-up examination.Abbreviations: CI, confidence interval; IQR, interquartile range; NO2, nitrogen dioxide; PM2.5, particulate matter with a diameter
microvascular structure by using retinal vessel metrics in 4- to 6-year-old children. The key findings are as fol-lows: (1) retinal venular and arterial diameters of chil-dren widen with a higher exposure of their mother to PM2.5 and NO2during the entire pregnancy period, and
(2) the retinal blood vessel curvature is affected by in utero exposure to NO2, represented by an increase in
tortuosity index for the entire pregnancy and the third trimester. To our knowledge, we are the first to find an association between air pollution exposure during gestation and effects on the retinal microvas-culature later in life.
Several studies found associations between retinal vas-cular characteristics and both acute and chronic expos-ure to air pollution in middle-aged or older populations. One of these studies was performed in a population of healthy adults with an average age of 64 from the Multi-Ethnic Study of Atherosclerosis (MESA) cohort study [21]. In this group, narrower retinal arterioles and wider venules were observed with increased 2-year exposure to PM2.5. A Belgian study focused on the effects of
short-term air pollution exposure on retinal microcirculation in adults between the age of 22 and 63. Both the average CRAE and CRVE in this research decreased with in-creasing exposure to PM10and black carbon [37]. These
results were further supported and even associated with changes in specific miRNAs linked to inflammatory and oxidative stress pathways [38]. Provost et al. were the first to describe the relationship between retinal vessel diameter and both short-term and long-term exposures to PM2.5 air pollution in children [25]. They determined
exposures on the day of the retinal examinations, as well
as in the year prior to their measurements. In accord-ance with our results, the authors found that there was a more significant effect of short-term exposure on the CRAE, although they found an association with a narrowing of the retinal arterioles, in contrast to our population. For long-term average annual ex-posure, no effects could be observed on both the CRAE and CRVE in this population in 8- to 12-year-old children.
Although studies focus on different forms and time windows of ambient air pollution exposure during the lifetime, there is a clear indication that the diameter of retinal venules is affected. Several systemic and en-vironmental factors have been attributed to a wider CRVE over the course of life. For example, retinal venular widening has been associated not only with the effects of active smoking but also with systemic diseases such as diabetes and obesity [39, 40]. Re-search conducted within the Rotterdam Study, in a population of people over the age of 55, showed that both the venular and arteriolar retinal diameters wid-ened when the participants had formerly smoked or were active smokers, with the largest effect on the retinal venules [41]. Widening of the retinal venules has also been considered as a potential biomarker for adverse health conditions. A meta-analysis combining the results of six individual prospective cohort studies has shown that a wider CRVE can be an indicator of coronary heart disease in adult women [42]. Further-more, a recent long-term follow-up cohort study has described that the width of retinal venules could be a potential predictor of ischemic stroke in both men
Table 3 Associations between retinal microvascular characteristics and PM2.5or NO2exposure during pregnancy: results from
secondary analyses with models combining entire pregnancy exposure with different postnatal exposure periods
Model CRAE,μm CRVE,μm TI
PM2.5
Entire pregnancy + day of follow-up 3.76 (0.76 to 6.75)* 4.29 (0.24 to 8.33)* 0.0022 (− 0.0003 to 0.0047) Entire pregnancy + day before follow-up 3.75 (0.75 to 6.74)* 4.32 (0.26 to 8.39)* 0.0022 (− 0.0003 to 0.0048) Entire pregnancy + week before follow-up 3.73 (0.71 to 6.74)* 4.71 (0.68 to 8.74)* 0.0024 (− 0.0002 to 0.0049) Entire pregnancy + entire childhood 3.25 (0.13 to 6.37)* 3.53 (− 0.69 to 7.74) 0.0022 (− 0.0005 to 0.0048) NO2
Entire pregnancy + day of follow-up 2.96 (0.05 to 5.87)* 4.24 (0.32 to 8.16)* 0.0027 (0.0002 to 0.0051)* Entire pregnancy + day before follow-up 2.89 (− 0.01 to 5.79)* 3.90 (− 0.01 to 7.81)* 0.0027 (0.0002 to 0.0051)* Entire pregnancy + week before follow-up 3.83 (0.74 to 6.91)* 3.25 (− 0.90 to 7.40) 0.0021 (− 0.0005 to 0.0047) Entire pregnancy + entire childhood 1.68 (− 3.22 to 6.58) 3.09 (− 3.51 to 9.70) 0.0024 (− 0.0017 to 0.0065)
Estimates are given as change (95% CI) per IQR increase in exposure to either PM2.5or NO2during the entire pregnancy. All models were adjusted for exposure to
either PM2.5or NO2during the entire pregnancy, age (years), sex, ethnicity, mean arterial blood pressure and BMI of the child at the moment of the follow-up
visit, the season in which the follow-up examination took place, birth weight (grams), maternal age at the birth of her child and pre-pregnancy BMI, maternal education level, alcohol use of the mother during pregnancy, smoking habits of the mother before and during pregnancy, and the exposure of the child to passive smoking. The separate models were additionally adjusted for exposure during either the day of the follow-up visit, the day before the follow-up examination, the week preceding the follow-up visit, or the average childhood exposure from the day of birth until the day of the follow-up examination. Abbreviations: CI confidence interval, CRAE central retinal arteriolar equivalent, CRVE central retinal venular equivalent, TI tortuosity index
and women and, in accordance with the former meta-analysis, of coronary heart disease in women [18].
In this research, we have described a positive asso-ciation between CRAE and prenatal exposure to PM2.5 and NO2. In the context of exposure to air
pol-lution, studies on changes in CRAE mostly seem to show negative relationships between the exposure variable and retinal arterial diameter [21, 37, 38]. In-deed, a narrower CRAE has been associated with sev-eral detrimental cardiovascular health outcomes, such as hypertension and arterial stiffness [43]. However, environmental exposures or adverse conditions associ-ated with an increase of the CRAE have also been de-scribed over the past years. A wider CRAE was linked with high cholesterol in a population of the Locomo-tive Syndrome and Health Outcome in Aizu Cohort Study [40] and with cigarette smoking in the Multi-Ethnic Study of Atherosclerosis (MESA) study. Poten-tial mechanisms explaining these effects are endothe-lial dysfunction and elevated oxidative stress as observed in mouse models [44]. A widening of the retinal arterial diameter has also been associated with several disease outcomes. Rhee et al. found that people who were diagnosed with intracranial arterial stenosis had a higher CRAE compared to those with-out the condition [45], while another study conducted within an Asian population showed an association be-tween wider CRAE values and a higher incidence of diabetes [46]. Since both narrowing and widening of the retinal arterioles have been associated with detri-mental health outcomes later in life, our findings should be traced further within the follow-up cohort, to be able to evaluate the changes in CRAE and the correlated health changes in these children through-out their life course.
Not only the diameter of the retinal vessels was de-scribed to be affected by exposure to air pollution in utero. In this study, the tortuosity of the vessel network was found to increase with higher exposure to NO2
dur-ing the entire period of pregnancy. Tortuosity can be regarded as a measure for vessel curvature and has been found to be influenced by conditions such as diabetes and hypertension [47]. Although this microvascular characteristic has been studied to a lesser extent than the retinal vascular diameter, with an apparent lack of studies on the relation to environmental exposures, vessel tortuosity has also been identified as a potential marker for the risk of developing cardiovascular dis-ease. For example, higher microvascular tortuosity in the retina has been associated with an increased risk of developing cerebral microbleeds [48] and ischemic stroke [49].
The World Health Organization (WHO) and Euro-pean limits that have been determined on the
short-term (1-h mean) and long-short-term (annual mean) expo-sures to NO2 are 200 and 40μg/m3, respectively [50].
However, the effects described in this research have been determined for a mean exposure of 19.7μg/m3 NO2 over the entire pregnancy, which is merely half
of the WHO annual guideline value. A recent meta-analysis has shown that exposure to increased levels of NO2 augments both respiratory and cardiovascular
mortality and is in itself, apart from PM2.5, an
im-portant catalyst in disease development and even mortality [51]. These results thus show that the ef-fects of NO2 exposure on the (micro-) circulation
cannot be underestimated and should be further stud-ied in terms of the effect of prenatal exposures on development later in life.
We acknowledge that this study has several strengths and limitations. A first strength is that this project is the first of its kind, investigating the ef-fects of environmental PM2.5 and NO2 air pollution
exposures occurring before birth, and during the child’s lifetime in both short- and long-term periods, on the microvasculature later in life. These results originate from a prospective birth cohort study, and thanks to extensive bio-banking, data collection at birth, and at follow-up examination, we were able to give a very precise estimation of the effect of expos-ure to air pollution on retinal vessel characteristics at the age of four to six. In this way, we contribute to the field of knowledge studying the complex rela-tionships between prenatal and postnatal environ-mental exposures and (disease) development later in life. Secondly, we used data from a large population-based sample size of children, representative for the reproductive segment of the Flemish population of Belgium [26]. A third strength of this study is that retinal image analysis has been performed by one re-searcher blinded for the exposure data, excluding examiner bias. A limitation of this study is that al-though the confounding factors in our statistical model were selected following an a priori thorough examination, residual confounding posed by other environmental factors or population characteristics cannot be fully excluded. Another limitation is the potential misclassification of exposure. Our results are based on daily levels of residential particulate ex-posure during prenatal and postnatal life but do not account for exposures other than residential. How-ever, the accuracy of our exposure models and rele-vance for personal and internal exposures have been proven, since air pollution levels at the residential address and proxies thereof, such as proximity of the home to major roads, correlate with the levels of nano-sized black carbon levels measured in the urine of children living in the same study area [34].
Conclusions
Both prenatal and early childhood exposures to PM2.5
and NO2 were associated with changes in retinal vessel
diameters and altered vessel tortuosity in young chil-dren. Our study adds to the knowledge of basic funda-mental mechanisms on the complex relationship between early life exposure to ambient air pollution and cardiovascular disease development later in life. In future research projects, focus should be put on the implica-tions of our findings on the cardiovascular development of the children in our prospective cohort.
Supplementary information
Supplementary information accompanies this paper athttps://doi.org/10. 1186/s12916-020-01586-x.
Additional file 1.
Abbreviations
BMI:Body mass index; CI: Confidence interval; CRAE: Central retinal arteriolar equivalent; CRVE: Central retinal venular equivalent; IQR: Interquartile range; MAP: Mean arterial pressure; NO2: Nitrogen dioxide; OD: Optic disk;
PM: Particulate matter; PM2.5: Particulate matter with a diameter smaller than
2.5μm; TI: Tortuosity index Acknowledgements
The authors want to express their greatest gratitude to the participating parents and children, as well as the staff of the maternity ward, midwives, and the staff of the clinical laboratory of East-Limburg Hospital in Genk.
Authors’ contributions
All authors read and approved the final manuscript. LJL, YD, HS, NM, and EBP have organized the fieldwork and have performed all clinical measurements. LJL performed the analyses of all retinal images. BGJ developed the PM2.5
and NO2exposure matrixes with input from CV and WL. LJL wrote the first
draft of the manuscript, after which YD, NM, HS, KYN, BGJ, HB, MP, FDC, and TSN provided critical revisions on the overall manuscript, and NG and PDB provided specific revisions on the methodology of the retinal imaging and analyses. LJL, YD, NM, KYN, and TSN had full access to all data in this study and checked the completeness, correctness, and integrity of the data and the accuracy of the data analyses.
Funding
This work was funded by the European Research Council (ERC-2012-StG 310898) and the Flemish Scientific Fund (FWO, N1516112/G.0.873.11.N.10). Leen J. Luyten was financed by the Bijzonder Onderzoeksfonds (BOF) partnership between the UHasselt (Diepenbeek, Belgium) and the UNamur (Namur, Belgium) (BOF15DOCNA01). Florence Debacq-Chainiaux is a Re-search Associate of the FNRS, Belgium. Hannelore Bové and Bram G. Janssen are postdoctoral fellows of the FWO (12P6819N and 12W3218N, respectively).
Availability of data and materials
The datasets used and/or analyzed during the current study are available from the corresponding author on reasonable request.
Ethics approval and consent to participate
The study protocols of both the recruiting and the follow-up phase were ap-proved by the ethical committees of Hasselt University (Diepenbeek, Belgium) and East-Limburg Hospital (Genk, Belgium). An initial informed con-sent form was signed by the mothers before delivery, and concon-sent for the second phase was renewed at the follow-up visit.
Consent for publication Not applicable.
Competing interests
The authors declare that they have no competing interests.
Author details
1Centre for Environmental Sciences, Hasselt University, Diepenbeek, Belgium. 2Unité de Recherche en Biologie Cellulaire (URBC) - Namur Research Institute for Life Sciences (Narilis), Namur University, Namur, Belgium.3Health Unit, Flemish Institute for Technological Research (VITO), Mol, Belgium.4Belgian Interregional Environment Agency (IRCELINE), Brussels, Belgium.5Department of Public Health & Primary Care, Occupational and Environmental Medicine, Leuven University, Leuven, Belgium.
Received: 7 January 2020 Accepted: 6 April 2020
References
1. Luyten LJ, Saenen ND, Janssen BG, Vrijens K, Plusquin M, Roels HA, et al. Air pollution and the fetal origin of disease: a systematic review of the molecular signatures of air pollution exposure in human placenta. Environ Res. 2018;166(March):310–23.
2. Wick P, Malek A, Manser P, Meili D, Maeder-Althaus X, Diener L, et al. Barrier capacity of human placenta for nanosized materials. Environ Health Perspect. 2010;118(3):432–6.
3. Valentino SA, Tarrade A, Aioun J, Mourier E, Richard C, Dahirel M, et al. Maternal exposure to diluted diesel engine exhaust alters placental function and induces intergenerational effects in rabbits. Part Fibre Toxicol. 2016; 13(1):39.
4. Bové H, Bongaerts E, Slenders E, Bijnens E, Saenen ND, Gyselaers W, et al. Ambient black carbon particles reach the fetal side of human placenta. Nat Commun. 2019;10(1):3866.
5. Saenen ND, Vrijens K, Janssen BG, Madhloum N, Peusens M, Gyselaers W, et al. Placental nitrosative stress and exposure to ambient air pollution during gestation: a population study. Am J Epidemiol. 2016;184(6):442–9. 6. Topinka J, Binková B, Mracková G, Stávková Z, Benes I, Dejmek J, et al. DNA
adducts in human placenta as related to air pollution and to GSTM1 genotype. Mutat Res. 1997;390(1–2):59–68.
7. Pedersen M, Wichmann J, Autrup H, Dang DA, Decordier I, Hvidberg M, et al. Increased micronuclei and bulky DNA adducts in cord blood after maternal exposures to traffic-related air pollution. Environ Res. 2009;109(8): 1012–20.
8. Neven KY, Saenen ND, Tarantini L, Janssen BG, Lefebvre W, Vanpoucke C, et al. Placental promoter methylation of DNA repair genes and prenatal exposure to particulate air pollution: an ENVIRONAGE cohort study. Lancet Planet Heal. 2018;2(4):e174–83.
9. Gruzieva O, Xu C, Breton CV, Annesi-Maesano I, Antó JM, Auffray C, et al. Epigenome-wide meta-analysis of methylation in children related to NO2 air pollution exposure. Environ Health Perspect. 2017;125(1):104–10. 10. Tsamou M, Vrijens K, Madhloum N, Lefebvre W, Vanpoucke C, Nawrot TS. Air
pollution-induced placental epigenetic alterations in early life: a candidate miRNA approach. Epigenetics. 2018;13(2):135–46.
11. Martens DS, Nawrot TS. Air pollution stress and the aging phenotype: the telomere connection. Curr Environ Heal Reports. 2016;3(3):258–69. 12. Pedersen M, Giorgis-allemand L, Bernard C, Aguilera I, Andersen AN,
Ballester F, et al. Ambient air pollution and low birthweight: a European cohort study ( ESCAPE ). Lancet. 2013;1:695–704.
13. Nawrot TS, Staessen JA, Holvoet P, Struijker-boudier HA, Schiffers P, Van Bortel LM, et al. Telomere length and its associations with oxidized-LDL, carotid artery distensibility and smoking. Front Biosci (Elite Ed). 2010;2: 1164–8.
14. Smith CJ, Ryckman KK, Barnabei VM, Howard B, Isasi CR, Sarto G, et al. The impact of birth weight on cardiovascular disease risk in the Women’s Health Initiative. Nutr Metab Cardiovasc Dis. 2016;26(3):239–45.
15. Rhodin JAG. Anatomy of the microcirculation. In: Microcirculation: current physiologic, medical, and surgical concepts; 1981. p. 11–7.
16. Clough GF, Norman M. The microcirculation : a target for developmental priming. Microcirculation. 2011;18(4):286–97.
17. De Boever P, Louwies T, Provost E, Int Panis L, Nawrot TS. Fundus photography as a convenient tool to study microvascular responses to cardiovascular disease risk factors in epidemiological studies. J Vis Exp. 2014; 92:1–9.
18. Seidelmann SB, Claggett B, Bravo PE, Gupta A, Farhad H, Klein BE, et al. Retinal vessel calibers in predicting long-term cardiovascular outcomes: the atherosclerosis risk in communities study. Circulation. 2016;134(18):1328–38. 19. Ogagarue ER, Lutsey PL, Klein R, Klein BE, Folsom AR. Association of ideal
cardiovascular health metrics and retinal microvascular findings: the atherosclerosis risk in communities study. J Am Heart Assoc. 2013;2(6): e000430.
20. Newman AR, Andrew NH, Casson RJ. Review of paediatric retinal microvascular changes as a predictor of cardiovascular disease. Clin Exp Ophthalmol. 2017;45(1):33–44.
21. Adar SD, Klein R, Klein BEK, Szpiro AA, Cotch MF, Wong TY, et al. Air pollution and the microvasculature: a cross-sectional assessment of in vivo retinal images in the population-based multi-ethnic study of atherosclerosis (MESA). PLoS Med. 2010;7(11):1–11.
22. Beelen R, Stafoggia M, Raaschou-Nielsen O, Andersen ZJ, Xun WW, Katsouyanni K, et al. Long-term exposure to air pollution and cardiovascular mortality: an analysis of 22 European cohorts. Epidemiology. 2014;25(3):368–78.
23. Zhang M, Mueller NT, Wang H, Hong X, Appel LJ, Wang X. Maternal exposure to ambient particulate matter≤2.5 μm during pregnancy and the risk for high blood pressure in childhood. Hypertension. 2018;72(1):194–201. 24. Hoffmann B, Moebus S, Möhlenkamp S, Stang A, Lehmann N, Dragano N,
et al. Residential exposure to traffic is associated with coronary atherosclerosis. Circulation. 2007;116(5):489–96.
25. Provost EB, Int Panis L, Saenen ND, Kicinski M, Louwies T, Vrijens K, et al. Recent versus chronic fine particulate air pollution exposure as determinant of the retinal microvasculature in school children. Environ Res. 2017;159: 103–10.
26. Janssen BG, Madhloum N, Gyselaers W, Bijnens E, Clemente DB, Cox B, et al. Cohort profile: the ENVIRonmental influence ON early AGEing
(ENVIRONAGE): a birth cohort study. Int J Epidemiol. 2017;46(5):1386–1387m. 27. Parati G, Stergiou GS, Asmar R, Bilo G, de Leeuw P, Imai Y, et al. European
Society of Hypertension guidelines for blood pressure monitoring at home : a summary report of the Second International Consensus Conference on Home Blood Pressure Monitoring. J Hypertens. 2008;26(8):1505–30. 28. Li L, Ikram MK, Wong TY. Retinal vascular imaging in early life: insights into
processes and risk of cardiovascular disease. J Physiol. 2016;594(8):2175–203. 29. Knudtson M, Lee K, Hubbard L, Wong T, Klein R, Klein B. Revised formulas
for summarizing retinal vessel diameters. Curr Eye Res. 2003;27(3):143–9. 30. Nguyen UTV, Bhuiyan A, Park LAF, Ramamohanarao K. An effective retinal
blood vessel segmentation method using multi-scale line detection. Pattern Recogn. 2013;46(3):703–15.
31. Janssen S, Dumont G, Fierens F, Mensink C. Spatial interpolation of air pollution measurements using CORINE land cover data. Atmos Environ. 2008;42(20):4884–903.
32. Lefebvre W, Vercauteren J, Schrooten L, Janssen S, Degraeuwe B, Maenhaut W, et al. Validation of the MIMOSA-AURORA-IFDM model chain for policy support : modeling concentrations of elemental carbon in Flanders. Atmos Environ. 2011;45:6705–13.
33. Maiheu B, Veldeman N, Viaene P, De Ridder K, Lauwaet D, Smeets N, et al. Identifying the best available large-scale concentration maps for air quality in Belgium. https://www.milieurapport.be/publicaties/2013/bepaling-van-de- best-beschikbare-grootschalige-concentratiekaarten-luchtkwaliteit-voor-belgie. 2013. In Dutch, Accessed 16 Apr 2019.
34. Saenen ND, Bové H, Steuwe C, Roeffaers MBJ, Provost EB, Lefebvre W, et al. Children’s urinary environmental carbon load: a novel marker reflecting residential ambient air pollution exposure? Am J Respir Crit Care Med. 2017; 196(7):873–81.
35. Janssen BG, Munters E, Pieters N, Smeets K, Cox B, Cuypers A, et al. Placental mitochondrial DNA content and particulate air pollution during in utero life. Environ Health Perspect. 2012;120(9):1346–52.
36. Wei F, Raaijmakers A, Zhang Z, van Tienoven TP, Huang Q, Yang W, et al. Association between cognition and the retinal microvasculature in 11-year old children born preterm or at term. Early Hum Dev. 2018;118:1–7. 37. Louwies T, Int Panis L, Kicinski M, De Boever P, Nawrot TS. Retinal
microvascular responses to short-term changes in particulate air pollution in healthy adults. Environ Health Perspect. 2013;121(9):1011–6.
38. Louwies T, Vuegen C, Int Panis L, Cox B, Vrijens K, Nawrot TS, et al. miRNA expression profiles and retinal blood vessel calibers are associated with short-term particulate matter air pollution exposure. Environ Res. 2016;147: 24–31.
39. Sun C, Wang JJ, Mackey DA, Wong TY. Retinal vascular caliber: systemic, environmental, and genetic associations. Surv Ophthalmol. 2009;54(1):74–95. 40. Tano T, Ono K, Hiratsuka Y, Otani K, Sekiguchi M, Konno S, et al. Retinal
vessel diameters in a Japanese population : the locomotive syndrome and health outcome in Aizu cohort study. Acta Ophthalmol. 2016;94(6):432–41. 41. Ikram MK, De Jong FJ, Vingerling JR, Witteman JCM, Hofman A, Breteler
MMB, et al. Are retinal arteriolar or venular diameters associated with markers for cardiovascular disorders? The Rotterdam study. Investig Ophthalmol Vis Sci. 2004;45(7):2129–34.
42. McGeechan K, Liew G, Macaskill P, Irwig L, Klein R, Klein BEK, et al. Meta-analysis : retinal vessel caliber and risk for coronary heart disease. Ann Intern Med. 2009;151(6):404–13.
43. Triantafyllou A, Anyfanti P, Gavriilaki E, Zabulis X, Gkaliagkousi E, Petidis K, et al. Association between retinal vessel caliber and arterial stiffness in a population comprised of normotensive to early-stage hypertensive individuals. Am J Hypertens. 2014;27(12):1472–8.
44. Wiest EF, Walsh-wilcox MT, Walker MK. Omega-3 polyunsaturated fatty acids protect against cigarette smoke-induced oxidative stress and vascular dysfunction. Toxicol Sci. 2017;156(1):300–10.
45. Rhee E, Chung P, Wong TY, Song JS. Relationship of retinal vascular caliber variation with intracranial arterial stenosis. Microvasc Res. 2016;108:64–8. 46. Jeganathan VSE, Sabanayagam C, Tai ES, Lee J, Lamoureux E, Sun C, et al.
Retinal vascular caliber and diabetes in a multiethnic Asian population. Microcirculation. 2009;16(6):534–43.
47. Bribiesca E. A measure of tortuosity based on chain coding. Pattern Recogn. 2013;46(3):716–24.
48. Hilal S, Ong YT, Cheung CY, Tan CS, Venketasubramanian N, Niessen WJ, et al. Microvascular network alterations in retina of subjects with cerebral small vessel disease. Neurosci Lett. 2014;577:95–100.
49. Ong YT, De Silva DA, Cheung CY, Chang HM, Chen CP, Wong MC, et al. Microvascular structure and network in the retina of patients with ischemic stroke. Stroke. 2013;44(8):2121–7.
50. World Health Organization. WHO air quality guidelines for particulate matter, ozone, nitrogen dioxide and sulfur dioxide; 2005. p. 1–21. 51. Faustini A, Rapp R, Forastiere F. Nitrogen dioxide and mortality: review and
meta-analysis of long-term studies. Eur Respir J. 2014;44(3):744–53. Publisher’s Note
Springer Nature remains neutral with regard to jurisdictional claims in published maps and institutional affiliations.