HAL Id: hal-02284950
https://hal-amu.archives-ouvertes.fr/hal-02284950
Submitted on 12 Sep 2019HAL is a multi-disciplinary open access archive for the deposit and dissemination of sci-entific research documents, whether they are pub-lished or not. The documents may come from teaching and research institutions in France or abroad, or from public or private research centers.
L’archive ouverte pluridisciplinaire HAL, est destinée au dépôt et à la diffusion de documents scientifiques de niveau recherche, publiés ou non, émanant des établissements d’enseignement et de recherche français ou étrangers, des laboratoires publics ou privés.
Copyright
Modified 3D-printed device for mercury determination
in waters
Elodie Mattio, Nadia Ollivier, Fabien Robert-Peillard, Robert Di Rocco,
André Margaillan, Christophe Brach-Papa, Joel Knoery, Damien Bonne,
Jean-Luc Boudenne, Bruno Coulomb
To cite this version:
Elodie Mattio, Nadia Ollivier, Fabien Robert-Peillard, Robert Di Rocco, André Margaillan, et al.. Modified 3D-printed device for mercury determination in waters. Analytica Chimica Acta, Elsevier Masson, 2019, 1082, pp.78-85. �10.1016/j.aca.2019.06.062�. �hal-02284950�
1 Modified 3D-printed device for mercury determination in waters
1 2
Elodie Mattio1, Nadia Ollivier1, Fabien Robert-Peillard1, Robert Di Rocco1, Catherine
3
Branger2, André Margaillan2, Christophe Brach-Papa3, Joël Knoery3, Damien Bonne4,
Jean-4
Luc Boudenne1, Bruno Coulomb1*
5
1 Aix Marseille Univ, CNRS, LCE, Marseille, France.
6
2 University of Toulon, MAPIEM, La Garde, France.
7
3 IFREMER, LBCM, Nantes, France.
8
4 Aix Marseille Univ, CNRS, Centrale Marseille, ISM2, Marseille, France.
9 10
*Corresponding author: [email protected]
11
Full postal address: LCE, Case 29, 3 place Victor Hugo, 13331 Marseille cedex 3, France.
12 13
Abstract 14
3D printing technology is increasingly used in flow analysis, to develop low cost and
tailor-15
made devices. The possibility of grafting specific molecules onto 3D printed parts offers new
16
perspectives for the development of flow systems. In this study, a MPFS system including a
17
dicarboxylate 1,5-diphenyl-3-thiocarbazone grafted 3D-printed device has been developed for
18
mercury determination. For this purpose, the surface of 3D-printed cuboids was first modified
19
with amine functional groups and then grafted with dicarboxylate
1,5-diphenyl-3-20
thiocarbazone. This new grafted device resulted in selective mercury preconcentration with
21
extraction and elution yields higher than 90% even at high sampling flow rates. The detection
22
can then be carried out in two ways: a direct detection of mercury extracted onto 3D-printed
23
grafted cuboids by atomic absorption spectrophotometry after amalgam on gold or a detection
24
of mercury in solution after elution with L-cysteine by spectrophotometry or cold vapor atomic
25
absorption spectrometry.
26 27
Keywords: stereolithography; Poly(MethylMethacrylate) grafting; dicarboxylate
1,5-diphenyl-28
3-thiocarbazone; Multi Pumping Flow System; mercury.
29 30
Introduction 31
Mercury is one of the most toxic metal, present in the environment in different chemical forms.
32
This post-transition metal has a high toxicity at low levels and may accumulate in organisms
33
[1] which increases its dangerousness. The exposition to mercury can cause damages to organs
34
[2] as respiratory and kidney diseases, dysfunctions of the nervous system [3,4] with memory
35
troubles and developmental delay for exposed children, or troubles in the development of
36
foetus. Mercury has the capacity to be exchanged between the different reservoirs of the
37
biosphere [5], whether in organic or in inorganic form. There are few natural sources of mercury
38
such as volcanism and geothermal sources [6], while anthropogenic sources are very important:
39
mining, combustion of fossil fuels [7,8], production of batteries from mercury oxide, use in
40
electrolytic processes for chemical or pesticides production. A recent study [9] estimated
41
anthropic mercury in the environment at 1 540 000 tonnes, of which 73% was emitted between
42
1850 and 2010.
2
In the light of its toxicity and its numerous sources of pollution, the World Health Organization
44
has recommended a guideline value of 6 μg L−1 for inorganic mercury in drinking water and
45
European regulations have set a maximal allowable concentration (MAC) in natural waters at
46
0.07 µg L-1 for mercury and its compounds. Accordingly, the development of simple, rapid and
47
sensitive methods for on-line Hg determination in natural waters has attracted widespread
48
attention in modern analytical chemistry. Flow analysis seems to be appropriate to meet these
49
specific requirements: this technology allows the decrease of instrumentation size and of
50
reagents and energy consumption, which are significant advantages to simplify the
51
manipulations required for the assays.
52
Many flow systems have been developed for quantification of mercury in waters, with a
53
detection step often performed by cold vapor atomic absorption spectrometry (CV-AAS)
[10-54
12]. Colorimetric detection has been also used for high concentrations of mercury [13,14].
55
Independently of the detection method, the quantification of low levels of mercury is usually
56
difficult because of sample storage problems [15]. A portable analytical system would avoid
57
these problems, but the coupling with complex laboratory detection techniques (atomic
58
absorption spectrometry (AAS), inductively coupled plasma mass spectrometry (ICP-MS) or
59
inductively coupled plasma atomic emission spectrometry (ICP-AES)) would remain difficult
60
to handle. A colorimetric detection step may be considered if a pre-concentration module is
61
used for low mercury concentrations.
62
3D printing eases the creation of three-dimensional custom fluidic modules as columns and
63
mixers and several flow systems based on such 3D-printed modules have been reported
64
previously for the determination of lead [16], cadmium [17] or chromium [18].
65
In this study, the 3D printing resin was used directly after the photopolymerization process as
66
a support for the grafting of a ligand for the selective extraction of mercury. Dicarboxylate
1,5-67
diphenyl-3-thiocarbazone (DTZc) was chosen for this purpose because of its affinity for
68
mercury [19]. The grafting procedure is performed in two stages: first, amine functions are
69
integrated on the surface of the photopolymerized resin and then dicarboxylate
1,5-diphenyl-3-70
thiocarbazone is grafted by reaction between its carboxylic function and the amine function
71
added to the resin. Various detection methods have been considered and several applications
72
are discussed here as examples to illustrate the opportunity of using a 3D printed grafted
73
module.
74 75
2. Materials and methods 76
2.1. Reagents and solutions
77
All chemicals used were of analytical grade and used without further purification. Solutions
78
were prepared with ultra-pure water (Millipore, resistivity > 18 MΩ cm) and stocked in high
79
density polyethylene or Teflon flasks. Mercury standard solutions were prepared by dilution of
80
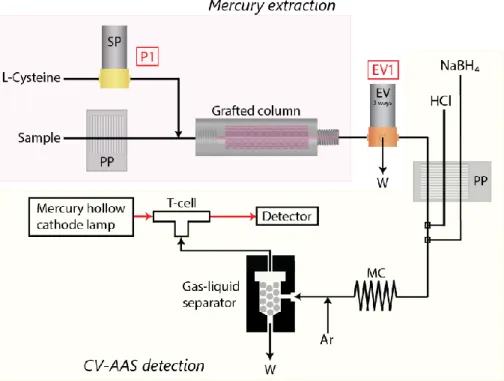
a commercial 1 g.L-1 AAS mercury stock solution (Fisher Chemical, USA) and stabilized with
81
1% v/v nitric acid trace metal grade (Fisher Chemical, USA).
82
A multi-metal solution (10 µmol.L-1 for each metal) was prepared by diluting and mixing eleven
83
commercial AAS stock solutions of aluminium, cadmium, calcium, cobalt, copper, iron, lead,
84
magnesium, mercury, silver and zinc at 1 g.L-1 (Fisher Chemical, USA) in ultra-pure water.
3
Modification of 3D printed devices was carried out with hexane diamine (Fisher Chemical,
86
USA), N-(3-Dimethylaminopropyl)-N′-ethylcarbodiimide (EDC, GenScript, USA) and
1-87
Hydroxybenzotriazole (HOBt, Fluka, USA).
88
Detection was performed by two techniques: spectrophotometric detection with a reagent
89
composed of dithizone (Sigma-Aldrich, USA) and thiourea (Sigma-Aldrich, USA) prepared in
90
a glycine buffer solution (Sigma-Aldrich, USA) in 30% absolute ethanol v/v (Sigma-Aldrich,
91
USA), whereas hydrochloric trace metal grade (Fisher Chemical, USA) and sodium
92
borohydride (Sigma-Aldrich, USA) were prepared in hydroxide solution (Fisher Chemical,
93
USA) for CV-AAS detection.
94 95
2.2 Synthesis of DTZc
96
Dicarboxylate 1,5-diphenyl-3-thiocarbazone (DTZc) was synthesized following the conditions
97
defined by Shenashen et al. [19]. Briefly, 1.9 g of hydrazinobenzoic acid were mixed with 0.6
98
mL of carbon disulfide, 20 mL of ethanol, 0.5 g of sodium hydroxide and 15 mL of distilled
99
water. The mixture was heated to reflux for 5 hours; then DTZc was precipitated as a white
100
solid by addition of ethanol, filtered, washed and dried. The reaction yield was 22% (0.95 g of
101
dicarboxylate 1,5-diphenyl-3-thiocarbazone).
102 103
2.3 Modification of 3D printed device
104
3D printed devices were post-processed by cleaning in isopropyl alcohol for 10 minutes and
105
curing for 1 hour under UV light. Integration of amine functions was carried out by immersion
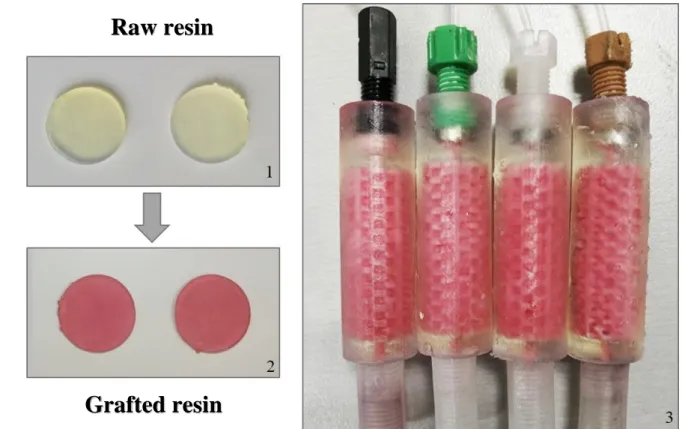
106
of 3D printed post-cured parts for 1 h in a 10% m/v solution of hexane diamine prepared in a
107
solution of borate buffer adjusted to pH 11.5. The aminated parts were carefully cleaned by
108
successive baths in water, in ethanol and in water afresh. The DTZc grafting was then carried
109
out by immersion in a mixture of 5 g.L-1 solution of
N-(3-Dimethylaminopropyl)-N′-110
ethylcarbodiimide (EDC), 5 g.L-1 solution of 1-Hydroxybenzotriazole (HOBt) and 1 g.L-1
111
solution DTZc in absolute ethanol for 30 min at room temperature. Modified supports were
112
then cleaned by successive immersions in water, in sodium hydroxide 10 mM, in water, in
113
ethanol and in water again, and kept at 4 °C until use.
114 115
2.4 Detection
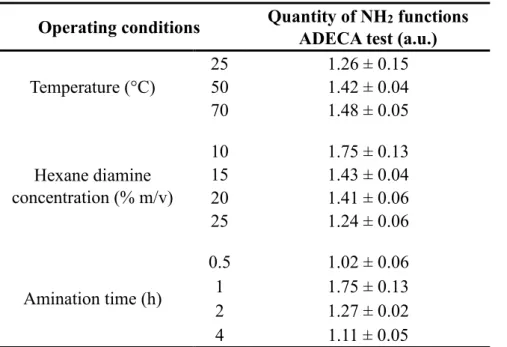
116
Elution of modified supports after mercury extraction was carried out with a 0.5% m/v solution
117
prepared from L-cysteine.
118
For CV-AAS detection, a 6 mol.L-1 solution of hydrochloric acid (trace metal grade) was used
119
with a 0.135 mol.L-1 solution of sodium borohydride prepared in 0.125 mol.L-1 sodium
120
hydroxide solution.
121
Concerning the colorimetric detection, a post-elution photo-oxidation step was first performed
122
using hydrogen peroxide and hydrochloric acid in order to obtain a final concentration of 0.5
123
mol.L-1 of each reagent in the eluent. At the end of the photo-oxidation step, a 1.1 mol.L-1
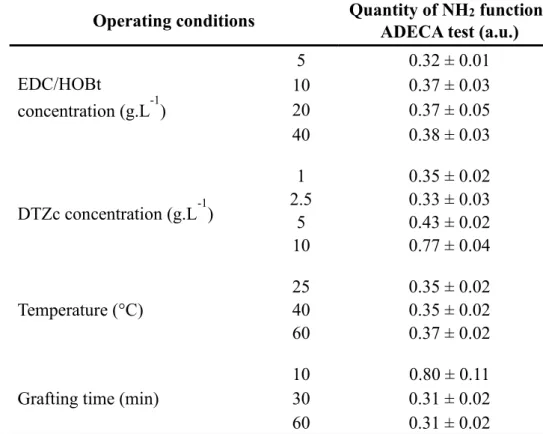
124
solution of ascorbic acid was then added to eliminate the excess of hydrogen peroxide before
125
detection. The final colorimetric reagent was prepared according to the conditions described by
126
Theraulaz et al. [20] with a 0.01 mmol.L-1 solution of dithizone prepared in a 0.01 mol.L-1
127
glycine buffer solution with 30% ethanol v/v, and mixed with a 0.001 mol.L-1 thiourea solution
128
(Sigma-Aldrich, USA).
4 130 2.5. Apparatus 131 2.5.1. Metal analysis 132
Cold vapour atomic absorption spectrometry (CV-AAS) was used to quantify mercury in
133
standard solutions and real samples. The measurements were carried out on a Thermo Scientific
134
ICE3500 (USA) atomic absorption spectrometer equipped with a mercury hollow-cathode lamp
135
operated at 6 mA (wavelength of 253.7 nm) and a VP 100 Vapour System, with a peristaltic
136
pump operated at 30 rpm. Determinations were carried out with the following parameters: acid
137
flow rate 0.7 mL.min-1, reductant flow rate 1.6 mL.min-1, sample flow rate 7.0 mL.min-1,
138
measuring time 6 seconds, argon flow rate 104 mL.min-1.
139
Interferences of other metals on mercury extraction/elution were studied by inductively coupled
140
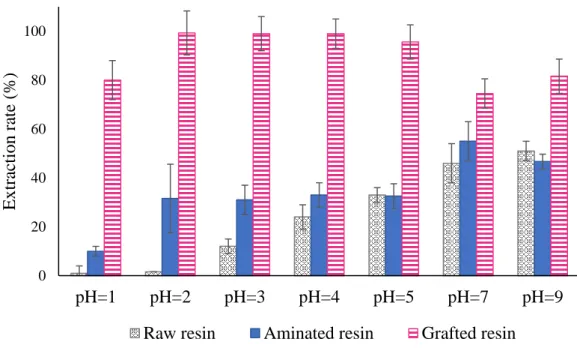
plasma–atomic emission spectrometry (ICP–AES) with a Jobin YVON JY2000 Ultratrace
141
spectrometer, equipped with a CMA spray chamber and a Meinhard R50-C1 glass nebuliser.
142
Determinations were performed with the following settings: power 1000W, pump speed 20
143
mL.min-1, plasma flow rate 12 L.min-1, coating gas flow rate 0.15 L.min−1, nebuliser flow rate
144
1.08 L.min−1 and nebuliser pressure 2.6 bar.
145 146
2.5.2. 3D printing 147
The DTZc grafting procedure was optimized on 3D printed disks and cuboids. These pieces
148
were designed with Rhinoceros® 5.0 3D software (Robert McNeel & Associates Europe,
149
Spain) and then printed on the Form1+ stereolithographic printer (Formlabs, USA), using an
150
acrylate/methacrylate transparent resin (Clear, BV-002, Formlabs, USA). The integration of
151
amines functions and the DTZc grafting were first tested and optimized on 3D printed disks
152
(diameter 19 mm, thickness 2 mm) in batch experiments. Then the optimized parameters were
153
applied on a cuboids’ column (14.1 x 54.1 mm, 284 cubes with a 1.5 mm diameter) which had
154 a grafted surface of 37.2 cm². 155 156 2.5.3. Flow systems 157
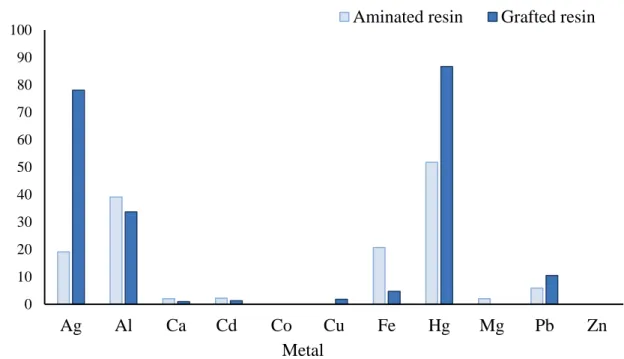
Sample was propelled using a peristaltic pump (Labcraft, Armtop, France). Reagents were
158
introduced by means of solenoid micro-pumps (Bio-ChemValve Inc., USA) with a stroke
159
volume of 20 µL and a highest frequency of 250 cycles/min and 3-way solenoid valves
160
(Takasago Electric Inc., Japan). The pumps and valves were computer-controlled by a
161
MCFIA/MPFS system (Sciware, Spain) with eight digital 12V output channels. Two flow
162
systems were developed according to the detection method used (CV-AAS or colorimetry),
163
their operating scheme is presented in Fig. 1 and Fig. 2.
5
165
Figure 1: Flow system for mercury determination with CV-AAS detection [P1: solenoid micropump; PP: 166
peristaltic pump; EV: solenoid valve; MC: mixing coil; W: waste; OF: optical fiber; Ar: argon].
167 168
169
Figure 2: Flow system for mercury determination with colorimetric detection [P1-P4: solenoid micropumps; PP: 170
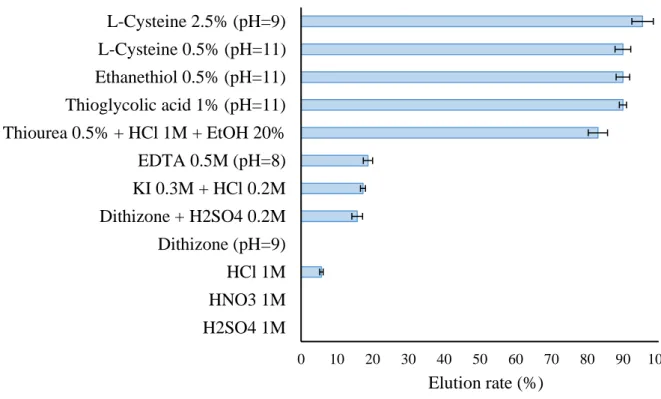
peristaltic pump; EV: solenoid valve; MC: mixing coil; W: waste; OF: optical fiber; DTZ: dithizone].
171 172
In both systems, the first step of the analytical procedure was the mercury extraction from the
173
sample (PP and EV1 to waste) on the DTZc grafted 3D printed cuboid column. Then, a solution
174
of L-cysteine was pumped (P1) to elute the mercury extracted onto the grafted column.
6
The first system included a CV-AAS detection system directly after the elution step, previously
176
described in section 2.5.1 (Fig. 1).
177
The second system offered a simple colorimetric detection (Fig. 2). This detection was based
178
on a photo-oxidation step to liberate the mercury from L-cysteine before a final colorimetric
179
detection with a dithizone reagent. A photo-oxidation module was used with a low-pressure
180
mercury lamp emitting at 254nm (90%) and 185 nm (10%), with a radiating part of 22.86 cm
181
in height and 0.95 cm in diameter, covered by a Suprasil quartz loop with an inner diameter of
182
2 mm (UVP PenRay, USA). Hydrogen peroxide oxidant solution (P2) was added to the eluate
183
to enhance photo-oxidation of L-cysteine and the mixture was exposed under UV-lamp for 30
184
minutes (P3 and EV2). An ascorbic acid solution (P4) was added at the end of this step to
185
eliminate excess of oxidant. The dithizone reagent (P5) was introduced in the system for the
186
detection of dithizone-mercury complex at 480 nm. Detection was carried out in a black 3D
187
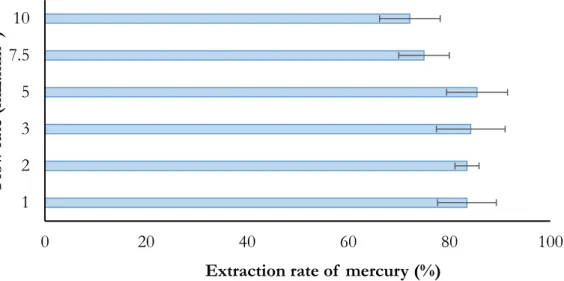
printed spectroscopic flow-cell with a 5 cm optical pathlength. Two FC-UV600 optical fibers
188
(OF) (Ocean Optics, USA) were connected at the ends of optical pathlength, and isolated from
189
the reaction mixture with two tailor-made quartz discs, to guide the light from the source to the
190
spectrophotometric detector. The radiation of the halogen bulb of a DH-2000 UV-Vis light
191
source (Ocean Optics, USA) was transmitted to a USB2000 miniature spectrometer detector
192
(Ocean Optics, USA). The whole system was controlled by AutoAnalysis 5.0 software
193
(Sciware, Spain).
194 195
3. Results and discussion 196
3.1. Modification of 3D printed device
197
Stereolithography resins are mainly composed of methyl methacrylate, which is an ester
198
monomer. After photopolymerization and poly(methyl methacrylate) (PMMA) formation, this
199
ester group can be used to graft molecules onto the surface of 3D printed objects. This grafting
200
procedure requires two steps (global procedure is summarized in Fig. 3): first amine functions
201
were introduced onto 3D printed surface by amination reaction of the ester functions of the
202
PMMA with hexane diamine [21], followed by grafting of DTZc using an amidation reaction
203
with carboxylate function of DTZc. A pink coloration of the solid surface after cleaning at the
204
end of the procedure demonstrates efficiency of the DTZc grafting (supplementary materials
205
Fig. S1).
206
207
Figure 3: Grafting pattern of DTZc onto PMMA. 208
7
These two steps were optimized in batch experiments on 3D printed disks thanks to the results
209
of ADECA test (Amino Density Estimation by Colorimetric Assay). This test allows
210
quantification of the amine functions on a solid surface [22]. A chromogenic reagent, the
211
Coomassie brilliant blue, reacts with amine functions in acidic medium. Then the quantity of
212
Coomassie brilliant blue which has reacted with the amine functions is extracted in basic
213
medium and finally quantified by colorimetric detection in acidic medium at a wavelength of
214
611 nm.
215 216
3.1.1. PMMA amination step 217
The PMMA amination step was carried out according to the method previously described by
218
Fixe et al. [21] with a heated solution of hexane diamine in borate buffer (pH=11.5). 3D printed
219
disks were immersed in this solution with a reaction time between 30 min and 4 h. Three
220
parameters were studied by a one-factor-at-a-time method: temperature, percentage of hexane
221
diamine in solution, and time. The results of ADECA test obtained with the various operating
222
conditions are summarized in Table 1 (the higher the result of ADECA test, the better the
223
efficiency of the amination step). The results showed first the advantage of heating the hexane
224
diamine solution to at least 50°C. There was no significant difference between 50 and 70°C
225
with 1.42 ±0.04 and 1.48 ±0.05 respectively. Moreover, the 3D printed disks have shown signs
226
of premature aging at 70°C with undesired cracking on the surface. Consequently, a temperature
227
of 50°C was chosen as the optimal condition. Concerning the other parameters, a 10% m/v
228
hexane diamine solution and a reaction time of 1 h were the best conditions to obtain a
229
maximum amination efficiency (1.75 ± 0.13).
230 231 232
Table 1. Optimization of the PMMA amination reaction according to the ADECA test (n=3) 233
Operating conditions Quantity of NH2 functions ADECA test (a.u.)
Temperature (°C) 25 1.26 ± 0.15 50 1.42 ± 0.04 70 1.48 ± 0.05 Hexane diamine concentration (% m/v) 10 1.75 ± 0.13 15 1.43 ± 0.04 20 1.41 ± 0.06 25 1.24 ± 0.06 Amination time (h) 0.5 1.02 ± 0.06 1 1.75 ± 0.13 2 1.27 ± 0.02 4 1.11 ± 0.05 234 235 3.1.2 DTZc grafting 236
The DTZc grafting was studied after amination of 3D printed disks according to the best
237
operating conditions described previously. Four parameters have been optimized by a
8
factor-at-a-time method: activating agents (EDC and HOBt) concentration, DTZc
239
concentration, temperature and grafting time. The influence of each parameter on the grafting
240
efficiency was evaluated based on the results of the ADECA test. In this case, a low value of
241
the ADECA test indicates a good efficiency of the grafting reaction, as it shows a decrease in
242
the number of free amine groups onto the PMMA surface.
243
The results are summarized in Table 2. Concerning activating agents EDC and HOBt, a
244
concentration of 5 g.L-1 for both reagents was enough to obtain the best grafting rate (0.32 ±
245
0.01). For the DTZc concentration, we observed no significant difference between 1 and 2.5
246
g.L-1 (with ADECA test results at 0.35 ± 0.02 and 0.33 ± 0.03 respectively). A concentration of
247
1 g.L-1 was thus selected for further experiments in order to limit the consumption of the reagent.
248
No effect of temperature has been observed and the grafting reaction could therefore be
249
performed at room temperature (25°C). Finally, a minimum reaction time of 30 min was
250
necessary to obtain a good grafting efficiency and no significant difference was observed
251
between 30 and 60 min.
252 253
Table 2. Optimization of the PMMA grafting reaction [EDC: N-(3-Dimethylaminopropyl)-N′-ethylcarbodiimide; 254
HOBt = 1-Hydroxybenzotriazole; DTZc = dicarboxylate 1,5-diphenyl-3-thiocarbazone] (n=3)
255
Operating conditions Quantity of NH2 functions ADECA test (a.u.)
EDC/HOBt concentration (g.L-1) 5 0.32 ± 0.01 10 0.37 ± 0.03 20 0.37 ± 0.05 40 0.38 ± 0.03 DTZc concentration (g.L-1) 1 0.35 ± 0.02 2.5 0.33 ± 0.03 5 0.43 ± 0.02 10 0.77 ± 0.04 Temperature (°C) 25 0.35 ± 0.02 40 0.35 ± 0.02 60 0.37 ± 0.02
Grafting time (min)
10 0.80 ± 0.11 30 0.31 ± 0.02 60 0.31 ± 0.02
256 257
3.2. Solid phase extraction of mercury on grafted 3D printed device
258
3.2.1 Extraction of metals 259
Shenashen et al. [19] have previously demonstrated that mercury was bonded to two molecules
260
of DTZc through S and one N atom, which is consistent with dithizone reactivity, a well-known
261
ligand which forms ML2 complexes with various metals (including mercury) through S and N
262
bonding.
9
After the optimization of the grafting procedure, mercury extraction was studied following
264
various conditions. Raw resin, aminated resin, and grafted resin disks were immersed for 1 h in
265
a 100 µg.L-1 mercury solution in PTFE tubes, at pH values between 1 and 9. The mercury
266
solution was analysed by CV-AAS before and after extraction. The results obtained (extraction
267
rate calculated from the concentrations before and after extraction) are summarized in Fig. 4.
268
For pH value above 4, an average extraction of 38% of mercury by raw resin was observed (min
269
24% at pH = 4; max 51% at pH = 9), which is characteristic of the adsorption of a metal on a
270
plastic material surface, as it was previously demonstrated for polyethylene [23]. In acidic
271
medium (pH=2), mercury was thus not extracted by the raw resin material (less than 1%): this
272
result shows the importance to work at acidic pH to avoid the contamination of 3D printed
273
pieces during the flow procedure. Aminated resin disks also showed a partial extraction of
274
mercury in a pH range between 2 and 9, probably due to the complexation of mercury by the
275
amine functions (min 32% at pH = 2, max 55% at pH = 7).
276 277
278
Figure 4: Batch extraction of a 100 µg.L-1 mercury solution (V=50 mL) on raw resin, aminated resin and DTZc
279
grafted resin disks versus pH (n=3).
280 281
Results showed complexation of mercury by DTZc onto the surface of disks, as shown by the
282
significant increase of extraction rate between the raw resin disks and the grafted resin disks at
283
acidic pH values. Concerning the grafted resin disks, the extraction in acidic medium was very
284
efficient, with a mercury extraction rate of 99%. The acidification of the samples at pH=2 before
285
extraction by the grafted resin was the best compromise to obtain good extraction performance
286
and to avoid adsorption phenomena on the plastic surfaces. At this pH value, extraction kinetics
287
was rapid since a mercury extraction rate of 90% was reached after a contact time of 1 minute
288
(supplementary materials Fig. S2).
289
The selectivity of the DTZc grafted resin was tested with a multi-metal solution (aluminium,
290
calcium, cadmium, cobalt, copper, iron, lead, magnesium, mercury, silver and zinc) at pH=2.
291
This solution was extracted on the aminated and the grafted resins, and solutions were analysed
292 0 20 40 60 80 100 pH=1 pH=2 pH=3 pH=4 pH=5 pH=7 pH=9 Ex tra cti on ra te (% )
10
by ICP-AES before and after extraction (Fig. 5). The results showed a good extraction of silver,
293
a partial extraction of aluminium and a low extraction of lead both for aminated and grafted
294
resins. Iron was also partially extracted on the aminated resin (20%), but extraction rate on
295
DTZc grafted resin was below 5%.
296 297
298
Figure 5: Batch extraction of a multi-metal solution at 10 µmol.L-1 (aluminium, calcium, cadmium, cobalt, copper,
299
iron, lead, magnesium, mercury, silver, and zinc; V=50 mL) at pH=2 on the aminated resin disks and the grafted
300
resin disks.
301 302
Three metals presented thus a noticeable affinity with the DTZc grafted resin: silver, aluminium
303
and lead. These interferences will be eliminated during the detection step: in the first flow
304
system the colorimetric dithizone reagent contains a masking agent (thiourea) to limit foreign
305
ions interferences, especially for silver, and in the second system the CV-AAS is a selective
306
analytical method for Hg.
307 308
3.2.2 Elution 309
After the extraction step, it was necessary to find a suitable eluent to recover the mercury
310
extracted by the DTZc grafted resin. Several reagents were studied, and the tests are
311
summarized in Fig. 6 (elution rates were calculated by the difference between the amount of
312
mercury extracted on the grafted supports and the amount of mercury in the eluate solutions).
313
Inorganic acids (hydrochloric, sulfuric and nitric acid), which are well known eluents for
314
metals, were not efficient to elute mercury, even with 1 mol.L-1 concentration (higher
315
concentrations were not tested to avoid the 3D resin degradation). Dithizone, EDTA and
316
potassium iodide were also tested, but resulted respectively in 16%, 19% and 18% elution rates.
317
Several eluents with thiol or thiocarbonyl functions were also studied: L-cysteine, ethanethiol,
318
thioglycolic acid and thiourea. These four reagents were very efficient to elute mercury with
319
elution rates higher than 90 %, except thiourea with 83%. These results are consistent with the
320
high mercury affinity for thiolate compounds (R-SH) [24]. Recently Liem-Nguyen et al. [25]
321
determined a formation constant of Hg(L)2 complexes with cysteine and thioglycolic acid of
322 0 10 20 30 40 50 60 70 80 90 100 Ag Al Ca Cd Co Cu Fe Hg Mg Pb Zn Ex tra cti on (% ) Metal
11
41.5 and 37.5 respectively. The three thiol compounds tested showed almost identical elution
323
rates, and L-cysteine was chosen for further experiments as the least toxic and malodorous
324
sulfur compound.
325 326
327
Figure 6: Batch elution of mercury extracted on DTZc grafted resin with different eluents (V=50 mL; n=3). 328 329 3.3. Application 330 3.3.1. Off-line sampling 331 332
Given the difficulties of on-site analysis of mercury and real sample storage for further
333
laboratory analysis, a cuboid column was used to carry out on-site mercury extraction. For this
334
purpose, a column was developed to incorporate a removable rectangular assembly of grafted
335
cuboids (Fig. 7), these latter ones being able to be changed for each sample.
336 337
338 339
Figure 7: Scheme of removable column of grafted cuboids. 340 341 342 0 10 20 30 40 50 60 70 80 90 100 H2SO4 1M HNO3 1M HCl 1M Dithizone (pH=9) Dithizone + H2SO4 0.2M KI 0.3M + HCl 0.2M EDTA 0.5M (pH=8) Thiourea 0.5% + HCl 1M + EtOH 20% Thioglycolic acid 1% (pH=11) Ethanethiol 0.5% (pH=11) L-Cysteine 0.5% (pH=11) L-Cysteine 2.5% (pH=9) Elution rate (%)
12
To optimize the efficiency of the extraction step, the mercury extraction flow rate was studied
343
between 1 and 10 mL.min-1 by means of a peristaltic pump. The results are depicted in Fig. 8.
344
Flow rate showed no significant effect on extraction rate between 1 and 5 mL.min-1 with an
345
average mercury extraction rate of 85%. Comparison of extraction efficiency versus higher
346
sample flow rates showed a 12% and 17% decrease respectively for sample flow rates of 7.5
347
mL.min-1 (mercury extraction rate of 75%) and 10 mL.min-1 (mercury extraction rate of 72%).
348
Nevertheless, despite the 17% loss, a sample flow rate of 10 mL.min-1 could be a good
349
compromise between the extraction efficiency and the extraction time (or sample volume). A
350
sample flow rate of 10 mL.min-1 enables in a given time a significant increase of the
351
preconcentration factor by percolating higher volumes of sample. For a 1 h sample percolation,
352
a preconcentration factor of 23 is thus obtained for a sample flow rate of 5 mL.min-1 versus 38
353
for a sample flow rate of 10 mL.min-1.
354 355
356
Figure 8: Influence of flow rate on the extraction of a 100 µg.L-1 mercury solution in a grafted cuboids column
357
(n=3).
358 359
After the extraction step, the entire cuboids assembly can be removed from the column and
360
introduced in a nickel boat of a mercury analyzer Altec AMA 254 which is specifically
361
conceived for the fast, precise and simple determination of mercury traces in solids samples.
362
Note that with this technique, it was necessary to perform a blank on grafted cuboids before
363
extraction, because the analysis of the raw resin used for 3D printing has showed a mercury
364 concentration of 9.6 ± 3.2 ng.g-1. 365 366 3.3.2. Flow systems 367
Mercury can also be quantified in solution after elution by L-cysteine by CV-AAS (Fig. 1). As
368
the mercury concentration is usually low in environmental samples, it is necessary to work with
369
large sample volumes to achieve a large preconcentration factor. In this study, the sample
370
volume was set at 500 mL to limit the analysis time (mercury extraction was successfully tested
371
for sample volumes up to 1 L). Experiments were carried out to determine the minimum volume
372
of L-cysteine which has to be used to quantitatively elute the mercury extracted on modified
373
supports. Results showed that a minimum volume of 10 mL of 0.5% m/v L-cysteine in borate
374 0 20 40 60 80 100 1 2 3 5 7.5 10
Extraction rate of mercury (%)
F lo w rat e (m L .m in -1)
13
buffer (pH=11) should be used to elute 92% of the mercury extracted on the modified support
375
(Supplementary materials, Figure S3).
376
The analytical features of this procedure were thus determined for a sample volume of 500 mL
377
and an elution volume of 10 mL: a limit of detection (LOD, 3σ; n=10) of 2.6 ng.L-1 and a limit
378
of quantification (LOQ, 10σ; n=10) of 8.6 ng.L-1 were achieved, with a linear range from 8.6
379
to 200 ng.L-1. The overall analysis time by this analytical procedure was 60 minutes. The 3D
380
printed DTZc grafted supports can be reused for 3 successive extractions. The tests showed a
381
decrease in the extraction rate to 65% from the fourth extraction. This method was validated on
382
two samples of fresh water and drinking water: as the mercury concentration was below the
383
LOD, samples were spiked to 40 ng.L-1. The results obtained were consistent with 38.2 ± 5.1
384
ng.L-1 for fresh water and 44.1 ± 4.2 ng.L-1 for drinking water (recovery rates ranged from 83%
385
to 120% in sample replicates).
386
The analytical procedure of the second flow system (Fig. 2) was divided in four steps: extraction
387
of mercury, elution, photo-oxidation, and colorimetric detection. Dithizone reagent was used
388
for the mercury detection because of its sensibility to mercury and to avoid interferences with
389
other extracted metals (silver and aluminium). A linear domain was observed between 1 and
390
200 µg.L-1 for a 500 mL sample volume and a 10 mL elution volume. The limit of detection
391
was 0.3 µg.L-1 (n=10), and the limit of quantification was 1.0 µg.L-1. Coefficient of variation
392
obtained for a mercury concentration of 50 μg L−1 was 2.2%. The overall analysis time by this
393
analytical procedure was 90 minutes.
394
Given these results, the flow system with colorimetric detection was more intended for analysis
395
of wastewater or industrial water, while the CV-AAS flow system was most adapted for fresh
396
water and seawater because of its lower LOD and LOQ.
397 398
Conclusion 399
In this study, a new possibility offered by 3D printing has been explored. The
400
acrylate/methacrylate resin can be used as an inert support to graft selective molecules. The two
401
steps of the grafting procedure were developed and optimized. The first step was the integration
402
of amine functions on PMMA, followed by reaction between these amine functions and the
403
carboxylate function of DTZc. A very good extraction of mercury was observed, and the grafted
404
resin can be eluted with thiol eluents, more particularly with L-cysteine, which has a high
405
affinity with mercury.
406
A 3D printed column of cuboids has been grafted and several applications of this module have
407
been presented to show the different opportunities of the grafting of 3D resin. Other molecules
408
with carboxylate functions could also be grafted by the same procedure for the extraction of
409
various metals. This type of column (cubes were spaced 1.2 mm from each other) could lead to
410
many advantages for solid phase extraction: no clogging, use of unfiltered or prefiltered samples
411
and compatibility with high flow rates.
412 413
Acknowledgment 414
This work was included in the project “Lab-on-Ship” funded by the French Research Agency
415
(ANR-14-CE04-0004). The authors are thankful to Françoise Marco-Miralles and Michelle
416
Brochen from IFREMER for Hg analysis with Altec AMA 254.
417 418
14 References
419
[1] E. Pelletier, Mercury-selenium interactions in aquatic organisms: A review, Marine
420
Environmental Research. 18 (1986) 111–132. doi:10.1016/0141-1136(86)90003-6.
421
[2] Cancer du poumon et exposition professionnelle aux métaux : une revue des études
422
épidémiologiques - Article de revue - INRS, (2018).
423
http://www.inrs.fr/media.html?refINRS=TC%20120 (accessed April 16, 2018).
424
[3] C. Freire, R. Ramos, M.-J. Lopez-Espinosa, S. Díez, J. Vioque, F. Ballester, M.-F.
425
Fernández, Hair mercury levels, fish consumption, and cognitive development in preschool
426
children from Granada, Spain , Environmental Research. 110 (2010) 96–104.
427
doi:10.1016/j.envres.2009.10.005.
428
[4] T. Yorifuji, T. Tsuda, S. Inoue, S. Takao, M. Harada, Long-term exposure to
429
methylmercury and psychiatric symptoms in residents of Minamata, Japan, Environment
430
International. 37 (2011) 907–913. doi:10.1016/j.envint.2011.03.008.
431
[5] Prévention du risque chimique - Mercure, cycle et toxicité, (2018).
432
http://www.prc.cnrs.fr/spip.php?rubrique42 (accessed April 25, 2018).
433
[6] J.C. Varekamp, P.R. Buseck, Global mercury flux from volcanic and geothermal
434
sources, Applied Geochemistry. 1 (1986) 65–73. doi:10.1016/0883-2927(86)90038-7.
435
[7] S. Tang, X. Feng, J. Qiu, G. Yin, Z. Yang, Mercury speciation and emissions from coal
436
combustion in Guiyang, Southwest China., Environ Res. 105 (2007) 175–182.
437
doi:10.1016/j.envres.2007.03.008.
438
[8] D.G. Streets, Z. Lu, L. Levin, A.F.H. ter Schure, E.M. Sunderland, Historical releases
439
of mercury to air, land, and water from coal combustion, Science of The Total Environment.
440
615 (2018) 131–140. doi:10.1016/j.scitotenv.2017.09.207.
441
[9] D.G. Streets, H.M. Horowitz, D.J. Jacob, Z. Lu, L. Levin, A.F.H. Ter Schure, E.M.
442
Sunderland, Total Mercury Released to the Environment by Human Activities, Environ. Sci.
443
Technol. 51 (2017) 5969–5977. doi:10.1021/acs.est.7b00451.
444
[10] A.N. Anthemidis, G.A. Zachariadis, J.A. Stratis, Development of a sequential injection
445
system for trace mercury determination by cold vapour atomic absorption spectrometry
446
utilizing an integrated gas–liquid separator/reactor, Talanta. 64 (2004) 1053–1057.
447
doi:10.1016/j.talanta.2004.05.003.
448
[11] H. Erxleben, J. Ruzicka, Atomic Absorption Spectroscopy for Mercury, Automated by
449
Sequential Injection and Miniaturized in Lab-on-Valve System, Analytical Chemistry. 77
450
(2005) 5124–5128. doi:10.1021/ac058007s.
451
[12] L.O. Leal, O. Elsholz, R. Forteza, V. Cerdà, Determination of mercury by multisyringe
452
flow injection system with cold-vapor atomic absorption spectrometry, Analytica Chimica
453
Acta. 573–574 (2006) 399–405. doi:10.1016/j.aca.2006.04.078.
454
[13] M. Garrido, M.S. Di Nezio, A.G. Lista, M. Palomeque, B.S. Fernández Band,
Cloud-455
point extraction/preconcentration on-line flow injection method for mercury determination,
456
Analytica Chimica Acta. 502 (2004) 173–177. doi:10.1016/j.aca.2003.09.070.
457
[14] J.F. van Staden, R.E. Taljaard, Determination of Lead(II), Copper(II), Zinc(II),
458
Cobalt(II), Cadmium(II), Iron(III), Mercury(II) using sequential injection extractions, Talanta.
459
64 (2004) 1203–1212. doi:10.1016/j.talanta.2004.06.020.
15
[15] C. R. Hammerschmidt, K. L. Bowman, M.D. Tabatchnick, C. H. Lamborg, Storage
461
bottle material and cleaning for determination of total mercury in seawater, Limnol. Oceanogr.:
462
Methods 9 (2011) 426-431. doi:10.4319/lom.2011.9.426
463
[16] E. Mattio, F. Robert-Peillard, C. Branger, K. Puzio, A. Margaillan, C. Brach-Papa, J.
464
Knoery, J.-L. Boudenne, B. Coulomb, 3D-printed flow system for determination of lead in
465
natural waters, Talanta. 168 (2017) 298–302. doi:10.1016/j.talanta.2017.03.059.
466
[17] E. Mattio, F. Robert-Peillard, L. Vassalo, C. Branger, A. Margaillan, C. Brach-Papa, J.
467
Knoery, J.-L. Boudenne, B. Coulomb, 3D-printed lab-on-valve for fluorescent determination
468
of cadmium and lead in water, Talanta. 183 (2018) 201–208. doi:10.1016/j.talanta.2018.02.051.
469
[18] C. Calderilla, F. Maya, V. Cerdà, L.O. Leal, 3D printed device for the automated
470
preconcentration and determination of chromium (VI), Talanta. 184 (2018) 15–22.
471
doi:10.1016/j.talanta.2018.02.065.
472
[19] M.A. Shenashen, S.A. El-Safty, E.A. Elshehy, Architecture of optical sensor for
473
recognition of multiple toxic metal ions from water, Journal of Hazardous Materials. 260 (2013)
474
833–843. doi:10.1016/j.jhazmat.2013.06.025.
475
[20] F. Théraulaz, O.P. Thomas, Complexometric determination of mercury(II) in waters by
476
spectrophotometry of its dithizone complex, Microchimica Acta. 113 (1994) 53–59.
477
doi:10.1007/BF01243137.
478
[21] F. Fixe, M. Dufva, P. Telleman, C.B.V. Christensen, Functionalization of poly(methyl
479
methacrylate) (PMMA) as a substrate for DNA microarrays, Nucleic Acids Res. 32 (2004) e9.
480
doi:10.1093/nar/gng157.
481
[22] G. Coussot, C. Perrin, T. Moreau, M. Dobrijevic, A. Le Postollec, O.
Vandenabeele-482
Trambouze, A rapid and reversible colorimetric assay for the characterization of aminated solid
483
surfaces, Anal Bioanal Chem. 399 (2011) 1061–1069. doi:10.1007/s00216-010-4363-7.
484
[23] A. Turner, L.A. Holmes, Adsorption of trace metals by microplastic pellets in fresh
485
water, Environ. Chem. 12 (2015) 600–610. doi:10.1071/EN14143.
486
[24] P. Pohl, B. Prusisz, Preconcentration of Mercury Using Duolite GT-73 in the Analysis
487
of Water Samples by Inductively Coupled Plasma Atomic Emission Spectrometry, Analytical
488
Sciences. 20 (2004) 1367–1370. doi:10.2116/analsci.20.1367.
489
[25] V. Liem-Nguyen, U. Skyllberg, K. Nam, E. Björn., Thermodynamic stability of
490
mercury(II) complexes formed with environmentally relevant low-molecular-mass thiols
491
studied by competing ligand exchange and density functional theory, Environmental Chemistry
492
14 (2017) 243-253doi:10.1071/EN17062.
493 494
16 Modified 3D-printed device for mercury determination in waters
495
Supplementary Materials 496
Elodie Mattio1, Nadia Ollivier1, Fabien Robert-Peillard1, Robert Di Rocco1, Catherine
497
Branger2, André Margaillan2, Christophe Brach-Papa3, Joël Knoery3, Damien Bonne4,
Jean-498
Luc Boudenne1, Bruno Coulomb1*
499 500
1 Aix Marseille Univ, CNRS, LCE, Marseille, France.
501
2 University of Toulon, MAPIEM, La Garde, France.
502
3 IFREMER, LBCM, Nantes, France.
503
4 Aix Marseille Univ, CNRS, Centrale Marseille, ISM2, Marseille, France.
504 505
*Corresponding author: [email protected]
506
Full postal address: LCE, Case 29, 3 place Victor Hugo, 13331 Marseille cedex 3, France.
507 508 509 510 511 512 513 514 515 516 517 518 519 520 521
Figure S1: Pictures of 3D printed objects during grafting steps (1: raw resin disks; 2: grafted
522
resin disks; 3: grafted cuboids columns).
523 524
Raw resin
17 525
Figure S2: Extraction rate versus contact time at pH=2.
526 527 528
529
Figure S3: Elution rate by L-cysteine versus eluent volume (L-cysteine 0.5% m/v in 100 mM
530 borate buffer pH=11). 531 532 533 534 535 536 537 0 10 20 30 40 50 60 70 80 90 100 0 2 4 6 8 10 12 14 16 18 20 22 Extr ac tion r ate ( % ) Time (min) 0 20 40 60 80 100 5 7.5 10 15 20 E lu tio n r ate (%) Eluent volume (mL)