HAL Id: insu-02182518
https://hal-insu.archives-ouvertes.fr/insu-02182518
Submitted on 13 Jan 2021
HAL is a multi-disciplinary open access
archive for the deposit and dissemination of
sci-entific research documents, whether they are
pub-lished or not. The documents may come from
teaching and research institutions in France or
abroad, or from public or private research centers.
L’archive ouverte pluridisciplinaire HAL, est
destinée au dépôt et à la diffusion de documents
scientifiques de niveau recherche, publiés ou non,
émanant des établissements d’enseignement et de
recherche français ou étrangers, des laboratoires
publics ou privés.
F. Y. Jiang, Roger Yelle, S. K. Jain, J. Cui, Franck Montmessin, N. M.
Schneider, Justin Deighan, H. Gröller, Loïc Verdier
To cite this version:
F. Y. Jiang, Roger Yelle, S. K. Jain, J. Cui, Franck Montmessin, et al.. Detection of Mesospheric
CO2 Ice Clouds on Mars in Southern Summer. Geophysical Research Letters, American Geophysical
Union, 2019, 46 (14), pp.7962-7971. �10.1029/2019GL082029�. �insu-02182518�
Detection of Mesospheric CO
2
Ice Clouds on Mars in
Southern Summer
F. Y. Jiang1,2 , Roger V. Yelle1 , S. K. Jain3 , J. Cui2,4,5 , F. Montmessin6 ,
N. M. Schneider3 , J. Deighan3 , H. Gröller1 , and L. Verdier6
1Lunar and Planetary Laboratory, University of Arizona, Tuscon, AZ, USA,2CAS Key Laboratory of Lunar and Deep Space Exploration, National Astronomical Observatories, Chinese Academy of Sciences, Beijing, China,3Laboratory for Atmospheric and Space Physics, University of Colorado Boulder, Boulder, CO, USA,4School of Atmospheric Sciences, Sun Yat-Sen University, Zhuhai, China,5CAS Center for Excellence in Comparative Planetology, Chinese Academy of Sciences, Hefei, China,6Laboratoire Atmosphères, Milieux, Observations Spatiales (LATMOS), UVSQ Université Paris-Saclay, Sorbonne Université, CNRS, Paris, France
Abstract
This paper reports the first detections of two high-altitude nighttime CO2clouds on Marsduring southern summer (Ls=264◦and Ls=330◦) with stellar occultation measurements by the Imaging
Ultraviolet Spectrograph on board the Mars Atmosphere and Volatile Evolution spacecraft. Interpretation of the transmission spectra with Mie theory indicates particle radii of ∼90–110 nm assuming a
monodisperse distribution. The altitude profile of extinction indicates that the cloud layers are confined horizontally to sizes less than ∼500–700 km. Examination of the CO2density and temperature profiles reveals strong wave-like perturbations. Supersaturated temperatures occur at the maximum negative extent of these wave-like perturbations, which are organized in longitude with a dominant m = 3 zonal harmonic. This suggests that tides are important in the formation of CO2clouds.
1. Introduction
The existence of mesospheric CO2ice clouds on Mars was first suggested by Clancy and Sandor (1998) based
on temperature profiles with a minimum that falls below the CO2saturation conditions (hereafter referred
to as cold pocket) detected by Pathfinder (Schofield et al., 1997) and later observationally confirmed by Mars Reconnaissance Orbiter (Clancy et al., 2019; Vincendon et al., 2011), Mars Odyssey THermal EMis-sion Imaging System (McConnochie et al., 2010), and various instruments on board Mars Express (MEx): SPectroscopy for the Investigation of the Characteristics of the Atmosphere of Mars (SPICAM; Montmessin et al., 2006), Planetary Fourier Spectrometer (Aoki et al., 2018), Observatoire pour la Minéralogie, l'Eau, les Glaces et l'Activité (OMEGA; Määttänen et al., 2010; Montmessin et al., 2007; Scholten et al., 2010), and High Resolution Stereo Camera (Määttänen et al., 2010; Scholten et al., 2010).
Four main types of Martian CO2ice clouds have been reported, one forming in the troposphere during the polar night with particle sizes of several tens or hundreds of micrometers (Colaprete & Toon, 2002; Hayne et al., 2012, 2014; Ivanov & Muhleman, 2001; Pettengill & Ford, 2000; Tobie et al., 2003), one appearing between 60 and 85 km during equatorial daytime with particle sizes of 0.5–3 μm (Määttänen et al., 2010; Montmessin et al., 2007), one occurring at night between 80 and 100 km in equatorial regions with particle sizes around 100 nm (Montmessin et al., 2006) and one emerging in the midlatitude mesosphere with parti-cle sizes of 0.5–3 μm (Määttänen et al., 2010; McConnochie et al., 2010). The presence of temperatures below the CO2saturation point is a prerequisite for the formation of CO2ice clouds (Forget et al., 2009; Listowski
et al., 2014; Montmessin et al., 2006; Schofield et al., 1997). Forget et al. (2009) investigated 616 temperature profiles measured by stellar occultations with Mars Express SPICAM and found that 45 profiles exhibited temperatures below the CO2saturation point. Montmessin et al. (2006) identified four low-latitude CO2ice
clouds in the supersaturated nighttime atmosphere during the southern winters out of 412 SPICAM stellar occultation measurements. The cloud particle effective radius derived from Mie theory ranged from 80 to 130 nm when assuming a pure CO2ice composition and spherical particles. More recently, Stevens et al.
(2017) reported numerous clouds in the 60- to 80-km region from Mars Atmosphere and Volatile Evolu-tioN (MAVEN)/Imaging UltraViolet Spectrograph (IUVS) limb measurements of solar scattered radiation. Nearby measurements by Mars Reconnaissance Orbiter/Mars Climate Sounder (MCS) did not show
super-RESEARCH LETTER
10.1029/2019GL082029
Key Points:
• We report the first detections of two high-altitude nighttime CO2clouds on Mars during southern summer • The altitude profile of extinction
indicates that the cloud layers are confined horizontally to sizes less than∼500–700 km
• Examination of the CO2density and temperature profiles reveals that tides are important in the formation of Martian CO2clouds Supporting Information: • Supporting Information S1 • Table S1 Correspondence to: F. Y. Jiang, fjiang@lpl.arizona.edu Citation:
Jiang, F. Y., Yelle, R. V., Jain, S. K., Cui, J., Montmessin, F., Schneider, N. M., et al. (2019). Detection of mesospheric CO2ice clouds on Mars in southern summer. Geophysical Research Letters, 46, 7962–7971. https://doi.org/10.1029/2019GL082029
Received 12 JAN 2019 Accepted 19 JUN 2019
Accepted article online 24 JUN 2019 Published online 19 JUL 2019
©2019. American Geophysical Union. All Rights Reserved.
saturated temperatures near the IUVS clouds, but the IUVS and MCS observations were not colocated or simultaneous and there might be undetected cold regions on small spatial or temporal scales that cause CO2condensation. Thermal tides (González-Galindo et al., 2011) and mesoscale gravity waves (Spiga et al.,
2012; Yiggit et al., 2015) have been suggested to be responsible for the generation of supersaturated cold pockets. In addition, the presence of nuclei is necessary for the heterogeneous nucleation of CO2ice clouds (Listowski et al., 2014; Määttänen et al., 2010; Plane et al., 2018).
The IUVS (Gröller et al., 2015, 2018; McClintock et al., 2015) on board the MAVEN (Jakosky et al., 2015) is designed to utilize stellar occultations to characterize the mesosphere of Mars with high sensitivity and spectral resolution of which the midultraviolet (MUV) channels from 180 to 340 nm are sensitive to CO2, O2, O3, and clouds and aerosols. In this study, we report the detection of aerosol layers with stellar occultation profiles obtained by the IUVS. The aerosol layers occur at altitudes of 90–100 km and are coincident with cold temperature regions yielding supersaturated CO2densities. We therefore interpret the aerosol layers as
CO2ice clouds. We provide estimates of the horizontal extent and mass of the CO2clouds and investigate
the role of atmospheric waves in the formation of clouds.
2. Observations
Ultraviolet stellar occultation is a well-established technique probing the Martian mesosphere (Bertaux et al., 2006; McClintock et al., 2015). By monitoring the ratio of the attenuated spectra through the atmo-sphere to the unattenuated spectrum outside the atmoatmo-sphere as a star rises or sets behind the horizon, the transmission spectrum of the atmosphere is measured. Analysis of these spectra reveals the molecular species and their density profiles according to their distinct absorption signatures. The retrieval procedure of MAVEN/IUVS stellar occultation data was described in Gröller et al. (2018), from which the CO2, O2,
and O3densities as well as the temperature profiles are retrieved, in addition to the aerosol extinction. The transmission spectra are available in the IUVS processed “occultation” profiles (Level 1c), while the derived profiles (Level 2) contain the derived physical quantities, such as the local CO2number density, temperature, and aerosol optical depth. We use the v13 release in this study.
Twenty stellar occultation campaigns have been performed from March 2015 to April 2018 (Martian Year, MY32–MY34), during which 309 MUV occultation profiles were acquired, sampling latitudes from 79◦S to 68◦N, the full range of longitude, and local times≤4.8 and ≥18.7 hr. Among these 309 MUV occultation profiles, we find 166 profiles with detached aerosol layers and 32 with cold pockets where the inferred atmo-spheric temperature drops below the CO2saturation temperature. Most of the aerosol layers occur at lower
altitudes (<50 km) and likely consist of dust raised from the surface by Martian winds (Kahre et al., 2017) with a fraction of them being water ice clouds (Montmessin et al., 2017). There are two special cases exhibit-ing distinct layers at altitudes greater than 90 km, similar to the altitudes of CO2ice clouds detected with
SPICAM occultations by Montmessin et al. (2006). We suggest that they are CO2ice clouds and present a
further analysis in the following section.
3. Results and Interpretations
The top two rows in Figure 1 show the vertical aerosol optical depths at 250 nm (a and c) and the correspond-ing temperature profiles (b and d). Distinct layers can be easily identified in the aerosol profiles, as indicated by red arrows. The extinction maxima appear at altitudes of 98.0 km (a) and 93.4 km (c), respectively. Both layers appeared in the nighttime atmosphere (LT = 24.0 and 1.6 hr) of the Martian southern tropics (13.9◦S and 16.6◦S). One cloud occurred near the southern summer solstice (Ls=264◦), while the other appeared in late summer (Ls =338◦). Equatorial mesospheric CO2clouds on Mars were usually observed between
Ls = 0–180◦(Clancy et al., 2019; Montmessin et al., 2006, Montmessin et al., 2007; 2010; Stevens et al.,
2017), although Määttänen et al. (2010) have reported one daytime equatorial CO2cloud at Ls = 330◦in
MY29 with MEx/OMEGA observations. Thus, the clouds reported here are the first tropical high-altitude nighttime clouds to be observed during southern summer.
The vertical extent of the discrete layers is roughly 10 and 20 km for orbits 4155 and 4811, respectively. These values are similar to the cloud thickness of ∼5–20 km inferred by Montmessin et al. (2006). The temperature profiles derived from the CO2absorption signatures in these two occultations have deep minima near the
locations of layers where the value falls below the CO2condensation temperature. However, the profile in
Geophysical Research Letters
10.1029/2019GL082029
Figure 1. Vertical profiles of aerosol optical depth at 250 nm (left column) and CO2temperature (right column) for
three occultation measurements targeting𝜏-Sco (a and b),𝛼-Eri (c and d), and𝛼-Eri (e and f), respectively. The Imaging UltraViolet Spectrograph data are plotted with black solid lines. The blue dashed lines in panels (a) and (c) indicate the model results by assuming horizontally infinite clouds (see text). The detached aerosol layers and cold pockets are labeled with red arrows, while the red star symbols mark the altitude of the maximum extinction within the aerosol layers. The dashed lines in the right panels indicate the CO2saturation temperatures. The top two rows illustrate the two occultation profiles detecting CO2ice clouds at the altitudes around 98 and 93 km, respectively, while the bottom row shows the profiles with a layer at an altitude of 40 km.
pocket presented in orbit 4811 is only a fraction of a Kelvin below the condensation temperature. In addition, the former temperature profile shows a wave-like structure, which is not as obvious in the latter profile. The altitudes of the two aerosol layers presented here> are similar to that of the mesospheric CO2ice clouds
found by Montmessin et al. (2006) with SPICAM occultation measurements. However, unlike the situation shown in Montmessin et al. (2006) that the observed clouds formed below the supersaturated portions, the aerosol layer in orbit 4155 is directly formed within the cold pocket, while the layer in orbit 4811 appears slightly above the cold pocket.
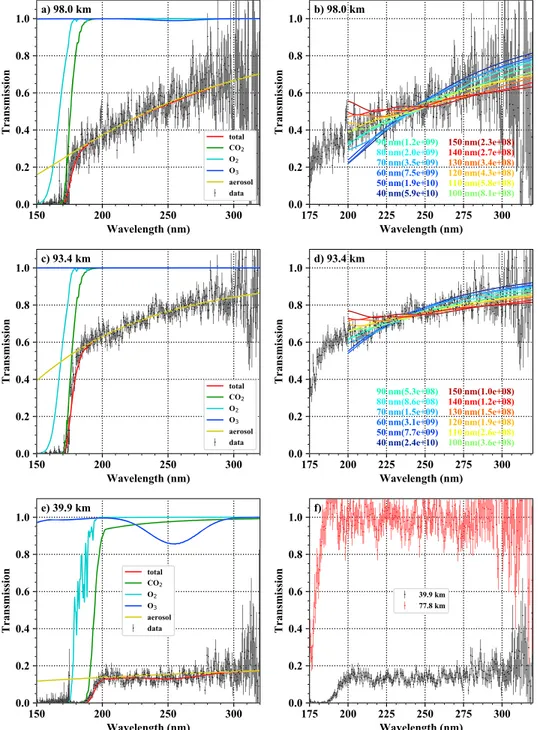
Figure 2. Corresponding transmission spectra (black) at the altitudes with maximum extinctions (marked with red stars) within the aerosol layers in Figure 1. (a, c, e) Contributions of CO2(green), O2(cyan), O3(blue), and aerosol
(yellow) to the fitted transmission spectra (red) at the altitudes indicated with the red stars in Figure 1. (b, d) Fitted results to the same transmission spectra as in (a) and (c) with Mie theory, assuming particle sizes ranging from 40 to 150 nm. The numbers in parentheses are the relevant fitted column densities per square centimeter. (f) Transmission spectra within the aerosol layer (black) and the cold pocket (red), at the altitudes indicated by the red star in Figure 1e and the red arrow in Figure 1f, respectively.
We estimate the size of the clouds with some simple models. Assuming that the clouds are spherically sym-metric (horizontally homogeneous over the region sensed in the occultation), of limited vertical extent, and with uniform density within that vertical range, we calculate the optical depth, which is proportional to the path length along the line of sight intersecting the cloud. The results are shown with blue dashed lines in Figures 1a and 1c for the two CO2clouds. The model results can reproduce the IUVS occultation
Geophysical Research Letters
10.1029/2019GL082029
significantly larger than the measured optical depth. This suggests that the clouds must be of limited hori-zontal extent. If we require that the line of sight completely misses the cloud for a tangent altitude of ∼90 km (for the cloud in orbit 4155) or ∼80 km (for the cloud in orbit 4811), we can estimate the horizontal extent of ∼500 km for the cloud in orbit 4155 and the horizontal extent of ∼700 km for the cloud in orbit 4811, respec-tively. For both observations the line of sight is within 30◦of the east-west direction and these estimates therefore pertain to the longitudinal extent of the cloud. The observations provide no strong constraints on the latitudinal extent of the cloud. Obviously, these simple models are unlikely to accurately represent the distribution of cloud opacity and the values presented above should be interpreted as rough estimates for the size of the cloud.
For comparison, another profile with an aerosol layer at the altitude of 40 km is shown in Figures 1e and 1f, which is also a low-latitude nightside profile but in the southern winter season (Ls=124◦). A cold pocket is present in the temperature profile as well but at the altitude of 80 km well above the aerosol layer. No layer is found around the altitude of the cold pocket, which is probably because the layer had an optical depth below the detection limit of 0.01 (Gröller et al., 2018).
The corresponding transmission spectra at the altitudes with maximum extinctions (marked with red stars) within the aerosol layers are shown with black points with error bars in Figure 2. The left column of Figure 2 illustrates the separate contribution of CO2(green), O2(cyan), O3(blue), and aerosols (yellow) to the atmo-spheric absorption (red). The absorption cross sections are adopted from Table 2 of Gröller et al. (2018, and references therein). As revealed in the figure, aerosols dominate the atmospheric extinction at wavelengths longer than 200 nm. There is no detectable O3in these occultations.
As shown in Figure 2, the transmission spectra for the high-altitude aerosol layers (panels a and c) increase strongly with wavelength, whereas the transmission spectrum for the low-altitude layer (panel e) is roughly flat. This indicates that the aerosols in the high-altitude layers are smaller than the ultraviolet wave-lengths measured here, while in the low-altitude layer the aerosols are larger than ultraviolet wavewave-lengths (Montmessin et al., 2006). By assuming CO2spherical ice particles, we fit the transmission spectra for the two high-altitude clouds with Mie theory using refractive indices adopted from Warren (1986). We assume a range of ice particle sizes from 40 to 150 nm and fit the transmission spectra with the column densities as free parameters. The best fit results are shown with colored solid lines in Figures 2b and 2d. As revealed by the figure, the column densities, as well as the slopes of fitted spectra, decrease as the particle sizes increase. For the case shown in Figure 2b, the best fit monodispersed particle radius is 105 ± 5 nm, with a column density of (6.9 ± 1.2) × 108cm−2, while for the other, the best fit parameters are 95 ± 1 nm and (4.3 ± 0.1) × 108cm−2,
respectively. A Monte Carlo technique is used to derive the uncertainties of fit parameters. Assuming a log-normal size distribution with an effective variance𝜈eff=0.15 (adopted from Montmessin et al., 2007) yields
a best fit effective radius of ∼87 and ∼78 nm and number densities of 1.1 × 10⁹and 1.0 × 109cm−2,
respec-tively. The uncertainties quoted here are formal results from the fit and do not include the likely larger systematic uncertainty related to the assumption of Mie scattering. The results are in agreement with the CO2ice particle sizes of 80–130 nm obtained by Montmessin et al. (2006). With the particle size derived here,
we calculate the sedimentation velocity by multiplying the Stokes fall velocity by the Cunningham factor (Listowski et al., 2014) and find that the sedimentation velocity exceeds 10 m/s at the altitude of higher than 90 km. The cloud particles would fall out of the clouds in less than 2,000 s accordingly.
Considering a typical CO2cloud with a vertical width of 10 km and a uniform column density of 5×108cm−2,
we estimate the particle number density of 9.5 × 10⁶m−3for a horizontally infinite cloud and the number
density of 1.6 × 10⁷m−3for a cloud with a finite horizontal extent, which are in agreement with the model
estimation of 106–108m−3by Listowski et al. (2014). Assuming that the 100-nm cloud particles are spherical
and using a CO2ice density at 100 K of 1.7 g/cm3(Mangan et al., 2017), we estimate a total mass density
of ∼10−13g/cm3for a typical CO
2ice cloud detected by the IUVS, which is far below the ambient CO2gas
density of ∼10−10g/cm3at the altitude of 90–100 km. The mass mixing ratio of CO
2ice is much larger than
Figure 3. Geographic distribution of the midultraviolet occultations executed by Imaging UltraViolet Spectrograph from March 2015 to April 2018 with latitude versus east longitude (a), solar longitude (b), local time (c), and aerosol layer altitude (d). The empty circles indicate the occultation profiles without cold pockets, while the solid circles denote the profiles with cold pockets. Campaigns C1–C20 are indicated with different colors, as shown in the color bar, with those with cold pockets indicated with white labels. There are no midultraviolet occultation data available in Campaigns C4, C6, C10, and C14. For those profiles with more than one layer, only the altitudes of the highest layers are shown in panel (d). The two CO2ice clouds are marked with the dashed ellipses. A table of the geophysical information for these occultations is provided in the Supporting Information.
Water clouds are unlikely candidates, for the reason that extraordinarily high mass mixing ratios would be required to match both particle size and the measured cloud opacity. The water mass mixing ratios can be calculated with (Heavens et al., 2010)
qice= 4 3 𝜌ice Qext dz𝜏 𝜌 reff (1)
where𝜌iceis the density of water ice, Qextis the extinction coefficient, dz𝜏 is the water ice opacity per unit
height,𝜌 is the atmospheric density, and reffis the particle radius. Following Heavens et al. (2010), we assume
that𝜌ice=900kg/m3and Qext=0.773. The atmospheric density and dz𝜏 measured by IUVS occulations at
the altitude of CO2clouds are ∼10−7kg/m3and ∼10−4–10−5m−1, respectively. The water particle size can be
derived with Mie theory by fitting the transmission spectra with revised water ice refractive indices adopted from Warren and Brandt (2008), which gives particle radii, reff ∼100 nm. The predicted water ice mass mixing ratios are up to 10−2–10−1, which is larger than the value of tens or hundreds of parts-per-million in
the Martian mesosphere presented by previous studies (Fedorova et al., 2018; Maltagliati et al., 2013). Figure 3 shows the geographic distribution of latitude versus east longitude (a), solar longitude (b), local time (c), and aerosol layer altitude (d) for all the occultation campaigns with MUV observations in this study. All the MUV occultations are sampled in the nightside to avoid stray light contamination. As revealed in the figure, there is no obvious dependence of cold pocket occurrence on longitude. The occurrence of cold pockets is confined in the latitude range of 40◦S to 40◦N, with 16 in the northern hemisphere and 16 in the southern hemisphere. Among the 32 profiles with cold pockets, 10 appeared in the latitude of 20◦S to 20◦N, while 20 occurred in the 30◦S to 40◦S and 30◦N to 40◦N, and the remaining two were at the latitude of 29◦S. Except for two cold pockets near the equinox (Ls = 186◦and Ls = 338◦), the remaining 30 cold
pockets occurred around the solstice, with 17 at Ls =60–125◦and 13 at Ls =260–300◦: this may indicate
a seasonal variability of the cold pockets. Forget et al. (2009) found that supersaturation temperatures were rare in southern summer with detection of only one case between Ls=240◦and 300◦. In contrast, we find
that 13 out of 66 MUV occultation profiles in this solar longitude range have supersaturated temperatures. This suggests that the occurrence rate of supersaturated temperatures varies with MY, a hypothesis that can
Geophysical Research Letters
10.1029/2019GL082029
Figure 4. (a, b) Longitudinal perturbations of temperatures and CO2densities using occultations from consecutive
orbits targeting𝜏-Sco during Campaign 11 at a latitude of 8.7◦S, a local time of 23.9 hr, and a solar longitude of 263.7◦. The CO2cloud profile is plotted with the black solid line in (a). The black dashed line in (a) indicates the CO2 saturation temperature. The CO2density perturbations shown in (b) are defined as the difference between the local number density and the longitudinal mean of densities at that altitude divided by the longitudinal density mean. The image is created by linear interpolation between the data points. Vertical markers represent the longitudes of the measurements, with the cloud profile indicated with the diamonds. The altitude of the cloud is marked with the red dashed ellipse. (c, d) Same as (a) and (b) but from consecutive orbits targeting𝛼-Eri during Campaign 13 at a latitude of 17.7◦S, a local time of 1.7 hr, and a solar longitude of 337.9◦.
be tested with future MAVEN occultations. Forget et al. (2009) also showed that supersaturation tempera-ture inferred from SPICAM occultation measurements presented no apparent correlation with longitude, consistent with our results.
It is interesting that the two clouds detected in this study occur at similar longitudes (183◦, 191◦) and latitudes (14◦S, 17◦S). The clouds detected by Montmessin et al. (2006) also occurred in the southern equa-torial regions (latitudes of 15◦S, 15◦S, 32◦S, and 38◦S) but over a range of longitudes (15◦, 134◦, 182◦, and 277◦). Moreover, all four clouds detected by Montmessin et al. (2006) occurred in the winter hemisphere (Ls=134–137◦), while the clouds detected here were found in the summer hemisphere (Ls=264◦, 338◦).
The dust opacity in the atmosphere at the location and time of our detections were significant with ver-tical opver-tical depths in the infrared of 0.6 and 0.7 (Montabone et al., 2015). In summary, all detections to date occurred in southern equatorial regions and the observations presented here show that mesospheric CO2clouds occur in southern summer during significant dust activity. Mesospheric CO2clouds have been
detected at a variety of longitudes, but three of the six detections are close to a longitude of 180◦. General-izations are difficult given the small number of observations, but the cloud detections to date are clustered in a small region of parameter space.
Since their discovery, it has been suggested that the mesospheric clouds on Mars are created when the temperature perturbations associated with tides and gravity waves become large enough for the tempera-ture to dip below the CO2saturation temperature (Clancy & Sandor, 1998; Montmessin et al., 2006). Our observations provide strong support for this hypothesis. Figure 4a shows that the condensation cloud seen in campaign 11 is associated with a temperature profile containing wave-like perturbations that grow with increasing altitude. The wave signature is less strong in the temperature profile association with the cloud seen in campaign 13 but still appears present. The importance of tides is seen more directly in the longitudi-nal variations of density shown in Figures 4b and 4d. During an occultation campaign, IUVS executes several consecutive occultations of a particular star every ∼4.5 hr, thereby sampling nearly the same latitudes and local times but different longitudes. For these consecutive orbits targeting the same star in one campaign, the differences in latitude and local time are less than 2.5◦and 0.2 hr, respectively. The drift of latitude and
longitude during a single stellar occultation is less than 1◦. We present the longitudinal perturbations of CO2densities for the two campaigns with detected CO2ice clouds in Figure 4. The interpolation method of
temperature profiles has been described and discussed in Gröller et al. (2018), which showed that, for one example from campaign 11 with particularly strong tides, the density perturbations from the interpolated occultation profiles had similar amplitudes and were roughly in phase with the perturbations calculated from the Mars Climate Database (Forget et al., 1998, 1999; González-Galindo et al., 2015; Madeleine et al., 2011; Millour et al., 2018). For the two cases considered here, large perturbations are seen in the CO2number densities, especially at higher altitudes. As indicated by the vertical diamond markers in Figures 4b and 4d, the CO2number densities dropped dramatically at and above the altitude of CO2ice clouds, consistent with
the cold temperatures and hydrostatic equilibrium. For the𝜏-Sco occultations there is significant variability at altitudes below 90 km but no clear periodicities. This changes above 90 km where the perturbations show a periodic structure in longitude. The𝛼-Eri occultations show far less variability at altitudes below 90 km but, similar to𝜏-Sco, exhibit strong periodicity at higher altitudes.
As discussed in Gröller et al. (2018), the occultation observing strategy is especially sensitive to nonmigrat-ing tides. Other tidal modes or gravity waves could also contribute but have signatures that are less easy to discern. The correlation with these strong, low-harmonic longitude perturbations suggests that nonmigrat-ing tides play a role in formation of the clouds. The measured perturbations appear to be dominated by an
m = 3wave, a common situation on Mars (Forbes et al., 2002; Gröller et al., 2018; Lo et al., 2015; Stevens et al., 2017; Wilson, 2002). Fourier analysis indicates that the longitudinal wave for the𝜏-Sco occultations gives amplitudes of 27% and 53% for the m = 2 and m = 3 waves, with lesser contributions from other waves (see Gröller et al., 2018, for a description of the Fourier analysis). A similar analysis for the𝛼-Eri occultation finds that the longitudinal wave at 93 km (the location of the cold pocket and cloud) finds amplitudes of 37% and 41% for the m = 2 and m = 3 waves. The supersaturated cold pockets occur where the m = 2 and
m =3waves are in phase. We note that Stevens et al. (2017) observed m = 3 periodicity in the occurrence rate of mesospheric clouds.
A puzzling aspect of the observations is that aerosol opacity is detected in only one occultation in the set of𝜏-Sco occultations, while supersaturated conditions exist in several occultations. As pointed out earlier, subcondensation temperatures are detected quite often but aerosol layers coincident with the cold temper-atures are detected only rarely (Forget et al., 2009; Montmessin et al., 2006), less than 10% of the time. The low detection rate may be due to the short cloud lifetime. The model results of Listowski et al. (2014) show that clouds should become observable in 1–3 hr after temperatures drop below the CO2condensation point
and should persist 10–30 min after the supersaturated regions disappear (see their Figures 8–19 and related text). The possible correlations with tides found here suggest that supersaturated conditions are formed when the main tidal modes are in phase. Because the IUVS occultation campaigns repeatedly measure the atmosphere at the same local time, it is not possible to determine the separate zonal (s) and diurnal (n) wave numbers for the tidal modes but only m = s − n. If these have the same diurnal wave number, then they would remain in phase at all times, but if the main tidal modes have different diurnal wave numbers, then they would be in phase for a period of roughly several hours, comparable to the time estimated by Listowski et al. (2014). Further investigations into this hypothesis require coupling a microphysical model for cloud evolution to a realistic atmospheric model including tides and gravity waves.
4. Concluding Remarks
From March 2015 to April 2018, the IUVS on board the MAVEN spacecraft has obtained 309 stellar occul-tation profiles in the MUV spectral band from which 166 profiles with aerosol layers and 32 profiles with supersaturated CO2conditions. In two cases the aerosol layers are coincident with CO2saturation and both of these occur above 90 km, much higher than the other aerosol layers detected in the occultations. These are the first detections of high-altitude nighttime CO2clouds during southern summer (Ls=264◦and Ls=
330◦). The measured aerosol extinction increases strongly with decreasing wavelength for the high-altitude layers indicating much smaller particle sizes than for the low-altitude aerosol layers. Interpretation of the transmission spectra with a Mie scattering model indicates particles sizes of ∼90–110 nm. Aerosols of this size would sediment out of the cloud layer in a time less than 2,000 s. The altitude profile of extinction indicates that the layers are confined horizontally to sizes less than 500 and 700 km. We estimate that the mass density within the cloud is roughly 0.1% of the local atmospheric mass density. The mass required to form these clouds is so much larger than the available water vapor that H2O composition of these clouds
Geophysical Research Letters
10.1029/2019GL082029
can be ruled out. Examination of the CO2density and temperature profiles retrieved simultaneously with the aerosol extinction reveals strong wave-like perturbations. The supersaturated temperatures occur at the maximum negative extent of these wave-like perturbations. This supports earlier arguments that the CO2
clouds are produced by atmospheric waves. The perturbations are also organized in longitude with a domi-nant m = 3 zonal harmonic. This suggests that tides are important in the formation of the clouds. The CO2 clouds only appear in a small percentage of the supersaturated CO2profiles (two out of 32). We speculate
that the relative lifetimes of the temperature perturbations and clouds may play a role in their detectability, but much remains to be learned about their formation and evolution.
References
Aoki, S., Sato, Y., Giuranna, M., Wolkenberg, P., Sato, T. M., Nakagawa, H., & Kasaba, Y. (2018). Mesospheric CO2ice clouds on Mars observed by Planetary Fourier Spectrometer onboard Mars Express. Icarus, 302, 175–190. https://doi.org/10.1016/j.icarus.2017.10.047 Bertaux, J. L., Korablev, O., Perrier, S., Quémerais, E., Montmessin, F., Leblanc, F., et al. (2006). SPICAM on Mars Express: Observing
modes and overview of UV spectrometer data and scientific results. Journal of Geophysical Research, 111, E10S90. https://doi.org/10. 1029/2006JE002690
Clancy, R. T., & Sandor, B. J. (1998). CO2ice clouds in the upper atmosphere of Mars. Geophysics Research Letters, 25, 489–492. https://doi. org/10.1029/98GL00114
Clancy, R. T., Wolff, M. J., Smith, M. D., Kleinböhl, A., Cantor, B. A., Murchie, S. L., et al. (2019). The distribution, composition, and particle properties of Mars mesospheric aerosols: An analysis of CRISM visible/near-IR limb spectra with context from near-coincident MCS and MARCI observations. Icarus, 328, 246–273. https://doi.org/10.1016/j.icarus.2019.03.025
Colaprete, A., & Toon, O. B. (2002). Carbon dioxide snow storms during the polar night on Mars. Journal of Geophysical Research, 107, 5051. https://doi.org/10.1029/2001JE001758
Fedorova, A., Bertaux, J. L., Betsis, D., Montmessin, F., Korablev, O., Maltagliati, L., & Clarke, J. (2018). Water vapor in the middle atmosphere of Mars during the 2007 global dust storm. Icarus, 300, 440–457. https://doi.org/10.1016/j.icarus.2017.09.025
Forbes, J. M., Bridger, A. F. C., Bougher, S. W., Hagan, M. E., Hollingsworth, J. L., Keating, G. M., & Murphy, J. (2002). Nonmigrating tides in the thermosphere of Mars. Journal of Geophysical Research, 107, 5113. https://doi.org/10.1029/2001JE001582
Forget, F., Hourdin, F., Fournier, R., Hourdin, C., Talagrand, O., Collins, M., et al. (1999). Improved general circulation models of the Martian atmosphere from the surface to above 80 km. Journal of Geophysics Research, 104, 24,155–24,176. https://doi.org/10.1029/ 1999JE001025
Forget, F., Hourdin, F., & Talagrand, O. (1998). CO2snowfall on Mars: Simulation with a general circulation model. Icarus, 131, 302–316. https://doi.org/10.1006/icar.1997.5874
Forget, F., Montmessin, F., Bertaux, J. L., González-Galindo, F., Lebonnois, S., Quémerais, E., et al. (2009). Density and temperatures of the upper Martian atmosphere measured by stellar occultations with Mars Express SPICAM. Journal of Geophysical Research, 114, E01004. https://doi.org/10.1029/2008JE003086
González-Galindo, F., López-Valverde, M. A., Forget, F., García-Comas, M., Millour, E., & Montabone, L. (2015). Variability of the Martian thermosphere during eight Martian years as simulated by a ground-to-exosphere global circulation model. Journal of Geophysical Research: Planets, 120, 2020–2035. https://doi.org/10.1002/2015JE004925
González-Galindo, F., Määttänen, A., Forget, F., & Spiga, A. (2011). The martian mesosphere as revealed by CO2cloud observations and General Circulation Modeling. Icarus, 216, 10–22. https://doi.org/10.1016/j.icarus.2011.08.006
Gröller, H., Montmessin, F., Yelle, R. V., Lefèvre, F., Forget, F., Schneider, N. M., et al. (2018). MAVEN/IUVS stellar occultation measurements of Mars atmospheric structure and composition. Journal of Geophysical Research: Planets, 123, 1449–1483. https://doi. org/10.1029/2017JE005466
Gröller, H., Yelle, R. V., Koskinen, T. T., Montmessin, F., Lacombe, G., Schneider, N. M., et al. (2015). Probing the Martian atmosphere with MAVEN/IUVS stellar occultations. Geophysics Research Letters, 42, 9064–9070. https://doi.org/10.1002/2015GL065294
Hayne, P. O., Paige, D. A., & Heavens, N. G. (2014). The role of snowfall in forming the seasonal ice caps of Mars: Models and constraints from the Mars Climate Sounder. Icarus, 231, 122–130. https://doi.org/10.1016/j.icarus.2013.10.020
Hayne, P. O., Paige, D. A., Schofield, J. T., Kass, D. M., Kleinböhl, A., Heavens, N. G., & McCleese, D. J. (2012). Carbon dioxide snow clouds on Mars: South polar winter observations by the Mars Climate Sounder. Journal of Geophysical Research, 117, E08014. https://doi.org/ 10.1029/2011JE004040
Heavens, N. G., Benson, J. L., Kass, D. M., Kleinböhl, A., Abdou, W. A., McCleese, D. J., et al. (2010). Water ice clouds over the Martian tropics during northern summer. Geophysics Research Letters, 37, L18202. https://doi.org/10.1029/2010GL044610
Ivanov, A. B., & Muhleman, D. O. (2001). Cloud reflection observations: Results from the Mars Orbiter Laser Altimeter. Icarus, 154, 190–206. https://doi.org/10.1006/icar.2001.6686
Jakosky, B. M., Lin, R. P., Grebowsky, J. M., Luhmann, J. G., Mitchell, D. F., Beutelschies, G., et al. (2015). The Mars Atmosphere and Volatile Evolution (MAVEN) Mission. Space Science Reviews, 195, 3–48. https://doi.org/10.1007/s11214-015-0139-x
Kahre, M. A., Murphy, J. R., Newman, C. E., Wilson, R. J., Cantor, B. A., Lemmon, M. T., & Wolff, M. J. (2017). The Mars dust cycle. In R. M. Haberle, R. T. Clancy, F. Forget, M. D. Smith, & R. W. Zurek (Eds.), The atmosphere and climate of mars (pp. 295–337). https://doi. org/10.1017/9781139060172.010
Listowski, C., Määttänen, A., Montmessin, F., Spiga, A., & Lefèvre, F. (2014). Modeling the microphysics of CO2ice clouds within
wave-induced cold pockets in the Martian mesosphere. Icarus, 237, 239–261. https://doi.org/10.1016/j.icarus.2014.04.022
Lo, D. Y., Yelle, R. V., Schneider, N. M., Jain, S. K., Stewart, A. I. F., England, S. L., et al. (2015). Nonmigrating tides in the Martian atmosphere as observed by MAVEN IUVS. Geophysics Research Letters, 42, 9057–9063. https://doi.org/10.1002/2015GL066268
Määttänen, A., Montmessin, F., Gondet, B., Scholten, F., Hoffmann, H., González-Galindo, F., et al. (2010). Mapping the mesospheric CO2clouds on Mars: MEx/OMEGA and MEx/HRSC observations and challenges for atmospheric models. Icarus, 209, 452–469. https://
doi.org/10.1016/j.icarus.2010.05.017
Madeleine, J. B., Forget, F., Millour, E., Montabone, L., & Wolff, M. J. (2011). Revisiting the radiative impact of dust on mars using the LMD global climate model. Journal of Geophysical Research, 116, E11010. https://doi.org/10.1029/2011JE003855
Acknowledgments
We thank the two anonymous reviewers, whose constructive comments have significantly improved the quality of this paper. This research was supported by NASA through the MAVEN project. J. C. acknowledges support from the National Natural Science Foundation of China through Grants 41525015 and 41774186. The observation files used in this work are identified as “occultation,” version 13, of Level 1b and Level 2 data available in the Planetary Atmosphere Node of the Planetary Data System (https:// pds-atmospheres.nmsu.edu/) and the MAVEN Science Data Center (https:// lasp.colorado.edu/maven/sdc/public/). This work utilized the RMACC Summit supercomputer, which is supported by the National Science Foundation (awards ACI-1532235 and ACI-1532236), the University of Colorado Boulder, and Colorado State University. The Summit
supercomputer is a joint effort of the University of Colorado Boulder and Colorado State University.
Maltagliati, L., Montmessin, F., Korablev, O., Fedorova, A., Forget, F., Määttänen, A., et al. (2013). Annual survey of water vapor vertical distribution and water-aerosol coupling in the Martian atmosphere observed by SPICAM/MEx solar occultations. Icarus, 223, 942–962. https://doi.org/10.1016/j.icarus.2012.12.012
Mangan, T. P., Salzmann, C. G., Plane, J. M. C., & Murray, B. J. (2017). CO2ice structure and density under Martian atmospheric conditions.
Icarus, 294, 201–208. https://doi.org/10.1016/j.icarus.2017.03.012
McClintock, W. E., Schneider, N. M., Holsclaw, G. M., Clarke, J. T., Hoskins, A. C., Stewart, I., et al. (2015). The Imaging Ultraviolet Spectrograph (IUVS) for the MAVEN Mission. Space Science Reviews, 195, 75–124. https://doi.org/10.1007/s11214-014-0098-7 McConnochie, T. H., Bell, J. F., Savransky, D., Wolff, M. J., Toigo, A. D., Wang, H., et al. (2010). THEMIS-VIS observations of clouds in the
martian mesosphere: Altitudes, wind speeds, and decameter-scale morphology. Icarus, 210, 545–565. https://doi.org/10.1016/j.icarus. 2010.07.021
Millour, E., Forget, F., Lopez-Valverde, M., Lefevre, F., Gonzalez-Galindo, F., Lewis, S., et al. (2018). Exploring the interannual variability of the Martian atmosphere with the Mars Climate Database v5.3. In 42nd COSPAR Scientific Assembly, 42, California, USA, pp. C4.3–6-18. Montabone, L., Forget, F., Millour, E., Wilson, R. J., Lewis, S. R., Cantor, B., et al. (2015). Eight-year climatology of dust optical depth on
Mars. Icarus, 251, 65–95. https://doi.org/10.1016/j.icarus.2014.12.034
Montmessin, F., Bertaux, J. L., Quémerais, E., Korablev, O., Rannou, P., Forget, F., et al. (2006). Subvisible CO2ice clouds detected in the mesosphere of Mars. Icarus, 183, 403–410. https://doi.org/10.1016/j.icarus.2006.03.015
Montmessin, F., Gondet, B., Bibring, J. P., Langevin, Y., Drossart, P., Forget, F., & Fouchet, T. (2007). Hyperspectral imaging of convective CO2ice clouds in the equatorial mesosphere of Mars. Journal of Geophysical Research, 112, E11S90. https://doi.org/10.1029/ 2007JE002944
Montmessin, F., Quémerais, E., Bertaux, J. L., Korablev, O., Rannou, P., & Lebonnois, S. (2006). Stellar occultations at UV wavelengths by the SPICAM instrument: Retrieval and analysis of Martian haze profiles. Journal of Geophysical Research, 111, E09S09. https://doi.org/ 10.1029/2005JE002662
Montmessin, F., Smith, M. D., Langevin, Y., Mellon, M. T., & Fedorova, A. (2017). The water cycle. In R. M. Haberle, R. T. Clancy, F. Forget, M. D. Smith, & R. W. Zurek (Eds.), The atmosphere and climate of mars (pp. 338–373). Cambridge: Cambridge University Press. https:// doi.org/10.1017/9781139060172.011
Pettengill, G. H., & Ford, P. G. (2000). Winter clouds over the North Martian Polar Cap. Geophysics Research Letters, 27, 609–612. https:// doi.org/10.1029/1999GL010896
Plane, J. M. C., Carrillo-Sanchez, J. D., Mangan, T. P., Crismani, M. M. J., Schneider, N. M., & Määttänen, A. (2018). Meteoric metal chemistry in the Martian atmosphere. Journal of Geophysical Research: Planets, 123, 695–707. https://doi.org/10.1002/2017JE005510 Schofield, J. T., Barnes, J. R., Crisp, D., Haberle, R. M., Larsen, S., Magalhaes, J. A., et al. (1997). The Mars Pathfinder atmospheric structure
investigation/meteorology. Science, 278, 1752. https://doi.org/10.1126/science.278.5344.1752
Scholten, F., Hoffmann, H., Määttänen, A., Montmessin, F., Gondet, B., & Hauber, E. (2010). Concatenation of HRSC colour and OMEGA data for the determination and 3D-parameterization of high-altitude CO2clouds in the Martian atmosphere. Planetary Space Science,
58, 1207–1214. https://doi.org/10.1016/j.pss.2010.04.015
Spiga, A., González-Galindo, F., López-Valverde, M. Á., & Forget, F. (2012). Gravity waves, cold pockets and CO2clouds in the Martian mesosphere. Geophysics Research Letters, 39, L02201. https://doi.org/10.1029/2011GL050343
Stevens, M. H., Siskind, D. E., Evans, J. S., Jain, S. K., Schneider, N. M., Deighan, J., et al. (2017). Martian mesospheric cloud observations by IUVS on MAVEN: Thermal tides coupled to the upper atmosphere. Geophysics Research Letters, 44, 4709–4715. https://doi.org/10. 1002/2017GL072717
Tobie, G., Forget, F., & Lott, F. (2003). Numerical simulation of the winter polar wave clouds observed by Mars Global Surveyor Mars Orbiter Laser Altimeter. Icarus, 164, 33–49. https://doi.org/10.1016/S0019-1035(03)00131-3
Vincendon, M., Pilorget, C., Gondet, B., Murchie, S., & Bibring, J. P. (2011). New near-IR observations of mesospheric CO2and H2O clouds
on Mars. Journal of Geophysical Research, 116, E00J02. https://doi.org/10.1029/2011JE003827
Warren, S. G. (1986). Optical constants of carbon dioxide ice. Applied Optics, 25, 2650–2674. https://doi.org/10.1364/AO.25.002650 Warren, S. G., & Brandt, R. E. (2008). Optical constants of ice from the ultraviolet to the microwave: A revised compilation. Journal of
Geophysical Research, 113, D14220. https://doi.org/10.1029/2007JD009744
Wilson, R. J. (2002). Evidence for nonmigrating thermal tides in the Mars upper atmosphere from the Mars Global Surveyor Accelerometer Experiment. Geophysics Research Letters, 29, 1120. https://doi.org/10.1029/2001GL013975
Yiggit, E., Medvedev, A. S., & Hartogh, P. (2015). Gravity waves and high-altitude CO2ice cloud formation in the Martian atmosphere. Geophysics Research Letters, 42, 4294–4300. https://doi.org/10.1002/2015GL064275