DPAS: The Dynamic Project Assessment System
by
Birendro M. Roy
Submitted to the Department of Electrical Engineering and Computer
Science
in partial fulfillment of the requirements for the degree of
Master of Engineering in Electrical Engineering and Computer Science
at the
MASSACHUSETTS INSTITUTE OF TECHNOLOGY
May 2005
£2-®
Birendro M. Roy, MMV. All rights reserved.
The author hereby grants to MIT permission to reproduce and
distribute publicly paper and electronic copies of this thesis document
in whole or in part.
MASSACHUSETTS INSTrTUTE OF TECHNOLOGY
JUL 18 2005
Author ...
LIBRARE....
Department of Electrical Engineering and Computer Science
May 19, 2005
Certified by...
...
...
Jonathon Cummings
Acsistant Professor
hesis Supervisor
Accepted
by...
AArthur C. Smith
Chairman, Department Committee on Graduate Students
DPAS: The Dynamic Project Assessment System
by
Birendro M. Roy
Submitted to the Department of Electrical Engineering and Computer Science on May 19, 2005, in partial fulfillment of the
requirements for the degree of
Master of Engineering in Electrical Engineering and Computer Science
Abstract
In this thesis, I designed and implemented the second iteration of a web-based system that administers survey questions to users and aggregates responses. Several survey system components were reimplemented according to an updated software architec-ture, and several new system components were developed. Chief among these is a web-based administration console that provides a unified access method for several frequently used functions. Individual console functions are built around an object-oriented framework that will serve as a basis for the next system design iteration. Thesis Supervisor: Jonathon Cummings
Acknowledgments
First and foremost, I would like to thank my project and thesis supervisor, Professor Jonathon Cummings, for the opportunity to work on Project Assessment. He kept me on task over the course of the project and was always willing to provide encouragement and objective feedback.
I also would like to thank my academic advisor, Professor Patrick H. Winston, for a few well-timed words of wisdom. Without his patient advice, I would not have made it through my years at MIT.
Furthermore, I would like to acknowledge the many outstanding faculty at the Institute, especially in the department of computer science. This project would not have been as successful as it was if I had not received such an outstanding education. I would like to thank my coworkers at the Initiative for Distributed Innovation for their support, collaboration and positive feedback throughout the project.
Finally, I would like to thank my mother, father and sister for their love and for always believing in me.
Contents
1 Introduction 13
1.1 Overview of Project Assessment . . . . 13
1.2 Objectives of the Dynamic Project Assessment System . . . . 14
1.3 Evolution of the Online Project Assessment System . . . . 15
1.3.1 The O riginal. . . . . 15
1.3.2 Supporting Multiple Organizations . . . . 17
1.3.3 Multi-part Surveys . . . . 20
1.4 Improvements made by the Dynamic Project Assessment System . . . 21
1.4.1 Offsite Installations . . . . 21
1.4.2 Administrative Tools . . . . 22
1.5 Technical Requirements . . . . 23
1.5.1 Standards Compliance . . . . 23
1.5.2 Backwards Compatibility . . . . 23
1.5.3 Anticipating Future Needs . . . . 24
2 Redesigning the Survey System 27 2.1 Guiding Principles . . . . 27
2.2 Model-View-Control . . . . 28
2.2.1 Introduction to Model-View-Control . . . . 29
2.2.2 Application to Survey Page Flow . . . . 31
2.2.3 Application to Survey Configuration . . . . 32
2.3 Rethinking Modularity . . . . 34
2.3.2 OPAS Modules ... 35
3 Survey Construction 37 3.1 Overview . . . . 37
3.2 Motivation . . . . 37
3.3 The Survey Administration Console . . . . 38
3.3.1 Survey Questions . . . . 38
3.3.2 Survey Sections . . . . 41
3.3.3 Special Question Types . . . . 46
3.3.4 Survey Periods . . . . 47
3.3.5 Survey Settings . . . . 49
3.4 Extending the Console . . . . 51
4 Conclusion 55 4.1 Challenges Overcome . . . . 55 4.2 Lessons Learned.... .. . .. . .. .. .. .. . . . . 57 4.2.1 Collaboration . . . . 57 4.2.2 Time Management . . . . 58 4.2.3 Development vs. Deployment . . . . 58 4.3 Future Directions . . . . 58
4.3.1 Web Page Design . . . . 59
4.3.2 Architectural Improvements . . . . 59
4.3.3 Open Source Release Work . . . . 60
4.4 Final Words . . . . 61
A Source Code Examples 63
List of Figures
1-1 Page flow in OPAS . . . . 16
1-2 OPAS page flow with multiple organizations . . . . 18
1-3 Page flow in the Dynamic Project Assessment System . . . . 21
2-1 Model-View-Control component interactions . . . . 29
2-2 Raw access to the data tier vs. unified access via a data object . . . . 30
2-3 Hierarchy of View components . . . . 31
2-4 Control flow in the Survey-Submit loop . . . . 31
2-5 Sample rows from the settings table. . . . . 33
3-1 Survey Administration Console login page . . . . 39
3-2 Survey Administration Console main menu . . . . 39
3-3 Survey Administration Console question list page . . . . 40
3-4 "Edit Question" page for questions not using the question-conf ig table 42 3-5 "Edit Question" page for questions that use the question-conf ig table 43 3-6 Survey Administration Console "Edit Survey" page . . . . 44
3-7 Survey Administration Console "Edit Section" page . . . . 45
3-8 Sample rows from the general-inf o-questions table. . . . . 46
3-9 Selecting a Survey Period . . . . 48
Listings
3.1 Javascript functions used by Table Editor. . . . . 52
A. 1 Settings class source code. . . . . 63
A.2 Strings table source code. . . . . 66
A.3 surveyadmin.AdminPage base class. . . . . 68
A.4 surveyadmin. TableEdit extension of surveyadmin.AdminPage. .... 72
A.5 Administrative page framework: admin-page .php. . . . . 78
Chapter 1
Introduction
With each passing year, new advances in information technology bring people around the world closer together. Businesses have embraced this shrinking of the globe with open arms; multinational corporations provide the ultimate in economies of scale. Scientific and academic communities have also benefited from more powerful com-munication tools. As a result, more organizations are bringing together distributed workgroups, or research and project teams that span multiple geographic locations. [6] Management scientists have long studied effective organizational structures within a company or division at a single location, but research on distributed workgroups is still a relatively young field. One of the primary challenges of working in this space is the difficulty of collecting raw data. Paper surveys were once the tool of choice for researchers in this field, but the disadvantages of paper are apparent even when collecting data on traditional workgroups; these disadvantages are multiplied when workgroups are not constrained to a single location. The Project Assessment web-based survey system was developed to address the needs of management scientists studying distributed workgroups.
1.1
Overview of Project Assessment
The original survey system was developed by Fumiaki Shiraishi for the purpose of distributing surveys to members of the Cambridge-MIT Institute (CMI). This system,
dubbed the Online Project Assessment System (OPAS), allowed Professor Jonathon Cummings at the Sloan School of Management to design a survey, distribute it to project members at CMI, aggregate responses, and export the resulting data for further analysis.
[10]
Surveys built using OPAS were intended to function in a manner similar to paper surveys, but with considerably less hassle. Each page of the web survey corresponds to a single survey question. Users are able to navigate through the survey pages in any order, and revisit their answers as many times as necessary. Responses are saved immediately upon submitting a survey page or when the user logs out. Users can fill out a partial response, then log in later to complete the survey.
Survey administrators manage the users, projects and survey response data for CMI using an administrative console written for OPAS. This console provides basic
administrative functions such as: adding and deleting users to and from projects, sending reminder e-mail to users, and viewing response rates.
The survey web pages are written in PHP, one of the most popular web scripting languages. All OPAS data are stored in a MySQL database; these data are made available to the survey system web pages via PHP's built-in library of MySQL func-tions.
[3]
1.2
Objectives of the Dynamic Project Assessment
System
Although OPAS in its original form satisfied the needs of the Cambridge-MIT Insti-tute, it required several extensions and patchwork fixes as more organizations with diverse objectives were added to the mix. Over time, old functionality became obso-lete and new features were added in a haphazard fashion. The primary objective of the Dynamic Project Assessment System is to provide all of the functionality of the previous survey system in a reengineered package. In addition, the Dynamic Project Assessment System aims to achieve the following objectives:
1. Better support for web standards. The web pages generated by DPAS are compliant with the W3C HTML 4.01 and CSS 2.1 standards.
2. A more flexible survey question structure. Survey questions use a more intuitive and expressive method of configuration.
3. A more user-friendly survey management interface. DPAS provides a completely redesigned administration console that allows uniform administra-tion of all organizaadministra-tions participating in the survey.
4. More support for secondary administrators. There are more tools that allow the offloading of administrative tasks onto managers or HR personnel at the surveyed organizations.
5. Automated installation and initialization. Many DPAS web pages and data components automatically initialize themselves to a default state when no configuration information is found. This behavior provides a useful example survey for new developers and administrators to build upon, while avoiding mysterious error messages when the survey configuration is changed or deleted.
1.3
Evolution of the Online Project Assessment
System
The Project Assessment survey system has evolved considerably from its first incar-nation into the system that is used today. I will first describe several key properties of the original Project Assessment web application, then I will identify how these properties have changed, sometimes breaking the assumptions of the original design.
1.3.1
The Original
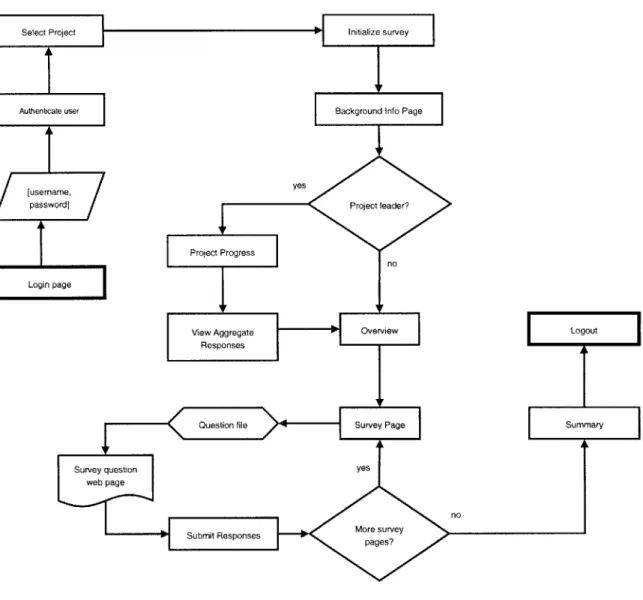
The original OPAS supported a single, relatively fixed survey; once the content and appearance of a survey was laid out, it was expected to require minimal maintenance.
Feec PjetI Initializ e
survey
Authenticate user Background Info Page
[username, e
passwordJ] Project leader?
Project Progress
View Aggregate Overview Logout
Quetin fleSurvey Page Summary
Survey q uest io
yes
V Submit Responses More survey
n
Figure 1-1: Page flow in OPAS
It was therefore acceptable for the initial setup of a survey to require a significant amount of time and specialized knowledge of the survey system internals, since it was not expected that this task would be performed frequently. Though the CMI survey was expected to solicit responses for several survey periods, the number and types of questions were not expected to change from one survey period to the next. Ideally the survey would not change at all over time, so that responses from later periods could be compared sensibly with data from prior periods to identify statistical trends and interrelationships.
Although multiple surveys were not explicitly supported, the original Project As-sessment system allowed for multiple "views" of a survey based on a survey
respon-dent's permission level. This was most useful when the survey designers wanted to show certain classes of users only a subset of the full survey. For example, principal investigators or project leaders would see the entire survey, project members would see a slightly smaller subset, and minor contributors or project advisors would only be asked a handful of questions. Because all survey responses (regardless of view) were written to the same results table, multiple views as implemented in the original survey system only made sense if there was a significant overlap between the questions asked in the various views.
Originally, the Project Assessment software was designed to support only a single organization: the Cambridge-MIT Institute. As with the survey creation process, the steps to set up the software for a new organization were not streamlined, since it was not expected to happen frequently. Modifying the look and feel of an orga-nization required access to the filesystem of the web server so that new images and stylesheets could be uploaded. Some per-organization settings were loaded from a PHP configuration file; editing these settings also required filesystem access.
OPAS provided an administrative console written specifically to manage the CMI survey. This console allowed CMI administrators to view project member information, send reminder e-mails, add or delete users, and analyze response rates. New function-ality was added on a regular basis by writing new modules according to the OPAS administrative console template system. The various functionalities provided by the console were implemented by administrative modules, which are written around an OPAS-specific template system that was created to speed the development of new survey components.
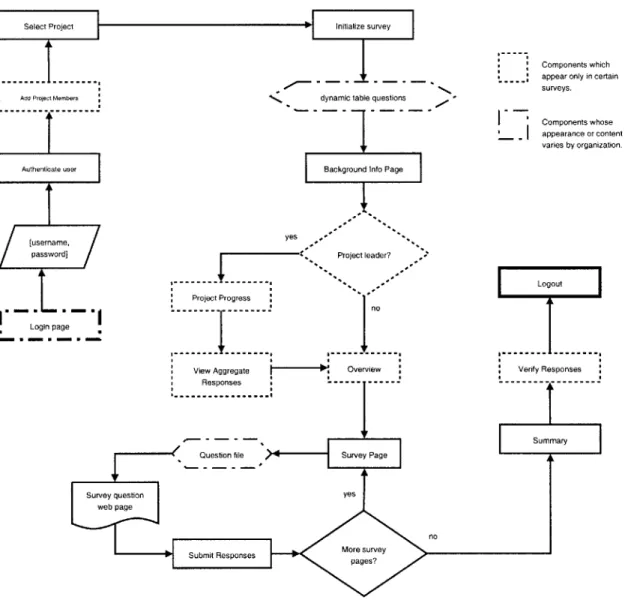
1.3.2 Supporting Multiple Organizations
The initial success of OPAS at collecting data from CMI project members allowed Professor Cummings to recruit other organizations to participate as part of Project Assessment. Distributing surveys to multiple organizations required a website that could present different surveys with a distinct look and feel depending on which organization a user belonged to. There were also privacy concerns; a participating
Select Proje
Add Project Mem
Authenticate us [username password] Login page h tain se ntent ation.
Figure 1-2: OPAS page flow with multiple organizations
organization might not want to be identifiable to Project Assessment users from other organizations.
Each organization received its own subfolder on the web server. The name of the subfolder usually reflected an "organization ID" derived from the name of the
organization. For example, the CMI survey is accessible via the URL:
http://www.projectassessment.org/cmi/. The survey for "Company A" might
be located in subfolder http: //projectassessment .org/ca/. In the original OPAS
implementation, this organization-specific subfolder contained the following items:
* images/ Subfolder containing images displayed on survey pages, including a
ct Initialize survey
Components whic appear only in cet surveys.
ers dynamic table questions
Components who appearance or co varies by organiz
or Background Info Page
yes *
17
Project leader? -. -.-. .... . ...- -- l Logout Project Progress ... .... no ... ... --- ---.View Aggregate Overview Verify Responses Responses
---i RSummary
Question file Survey Page
Survey question yes
web page
i" ubitResonesMore survey
header image or company logo, left and right arrows, and a form submit button. " stylesheet . css CSS stylesheet used to format the survey pages according to
the desires of the particular organization.
" settings.php PHP file containing various configuration options used by the survey system.
" index.php The login page seen by a user who navigates to an organization-specific URL.
Survey data for each organization, including the survey questions, user data and survey responses, were stored in a MySQL database named with the "organization ID." Certain tables were common to every database. The most important tables were: * user: Contains information about each user, including username, password and
full name.
* projects: Contains information about each project, including project name, project leader and start and end dates.
" people: Maps users to projects. A user may be on more than one project; in this case he or she will have multiple records in this table.
" periods: Lists the start and end dates of survey response periods.
" question-sections: Defines sections of questions and specifies the permission level required to view each section.
" questions: Defines individual survey questions. Each row corresponds to a single question, and contains all information required to specify the behavior of the question.
" results: Contains survey responses. Each row is identified by a user ID number and a project ID number.
Survey settings are no longer loaded from a PHP file in DPAS; instead, they are now loaded from a new settings database table. The migration of survey settings from PHP to a database backend was driven by a desire to provide a unified access method to all survey-related configuration options.
In the original OPAS, new organizations were not expected to be added often, so there was no automated "New Organization" wizard provided. Typically, a new organization was added by performing the following steps:
1. Create a subfolder for the new organization, copying files from an existing or-ganization.
2. Edit the stylesheet to reflect the desired look and feel of the new organization. 3. Edit the settings file to enable or disable survey behavior according to the desires
of the surveying organization.
4. Copy database tables from an existing organization to a new database. 5. Edit the survey sections and survey questions to include the desired items.
6. Populate the user, projects, and people tables with data provided by the new organization.
DPAS includes an organization management console that exposes the ability to create new organizations and reconfigure existing ones via a convenient web interface.
1.3.3
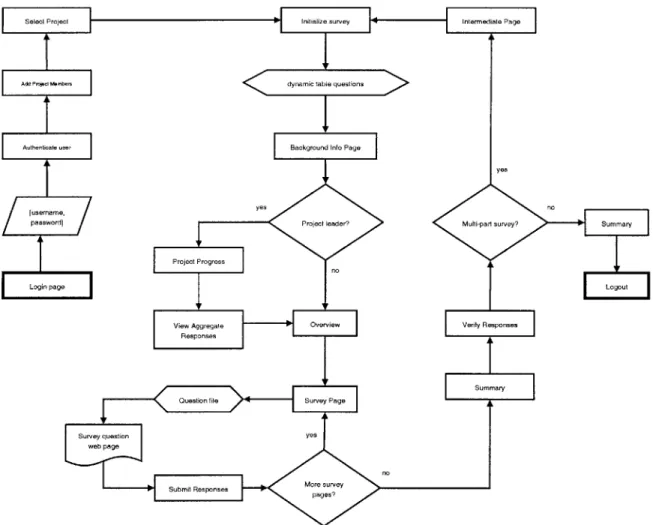
Multi-part Surveys
Two-part survey support has only recently been added to the Project Assessment system, at the request of one of the participating organizations. For this particular organization, a second survey page sequence displays if the response for the first part meets certain conditions. Because multi-part surveys were not part of the problem domain for the original system, they were added only upon request and implemented in this limited fashion. As the Project Assessment system gains in popularity, it is
Select Project Initialize survey Intermediate Page
Add Projec Memberf F dynamic table questions
Authenticate user Background Inoo Page
yes
/
[username, yes nopassword] Projectsurders Multipartsurvey? Summary
Project Progress
na
Login page Logout
View Aggregate Overview Verit y Responses
Responses e
i
Question file Survey Page.
Survey question yes web page
- Submit Responses More survey
Figure 1-3: Page flow in the Dynamic Project Assessment System
more and more likely that there will be other organizations that require support for multi-part surveys.
1.4
Improvements made by the Dynamic Project
Assessment System
1.4.1 Offsite Installations
Some participating institutions might decide to run a subset of the Project Assess-ment software on internal servers for security or availability reasons. Because this arrangement requires more expense in terms of manpower and equipment, we ex-pect that in most cases organizations will want us to host and administer the survey.
In those situations where the Project Assessment system must be deployed offsite, however, we must have the ability to do so quickly and easily.
Directly participating organizations are only one possible offsite scenario. Ever since the origin of Project Assessment, Professor Cummings has had the intent to release the survey system source code and database specifications as an open source package. Before making the project available to the public, however, the system required a step-by-step installation process and ancillary documentation. In the past, there was no fixed, documented process; we simply archived the PHP source code and exported the SQL database by hand whenever the need arose. DPAS provides three major improvements upon the old system:
1. A standard README file listing system requirements and installation steps.
2. A survey packaging tool that administrators can use to create exported stan-dalone versions of surveys they have authored using DPAS.
3. An automatic repackaging tool that generates a current snapshot of PHP source
code and exported SQL data from a MANIFEST file on demand.
1.4.2
Administrative Tools
Managing the multiple organizations participating in Project Assessment had be-come a challenge in and of itself by the time development on DPAS began. Each new organization comes with its own administrative overhead in the form of survey configuration, management of users and projects, bug tracking and implementation of feature requests. At the time, Project Assessment personnel performed most of these functions by browsing and modifying MySQL database tables directly using phpMyAdmin. This strategy required very little effort to implement; once installed, phpMyAdmin could be used to browse or edit any database table. The primary dis-advantage of this approach was that it required the ability to generate (or memorize) several complex SQL statements to perform conceptually simple tasks, like setting a user's status to "inactive" or changing the current survey period.
DPAS provides an administrative console that implements these features and more. The Survey Administration Console was built in order to provide a single interface for all of the functions an administrator might need to perform within the scope of a single organization. The SAC is driven by an object-oriented framework that is described in more detail in section 3.4. Since Project Assessment is continually evolving, this framework is designed in a way that encourages the development of new modules that inherit functionality from existing components.
1.5
Technical Requirements
1.5.1
Standards Compliance
As more and more organizations join Project Assessment, the user base of the sys-tem will grow considerably. Experience has shown that the technology with which survey respondents access the internet varies considerably. The best way to ensure a consistent experience for all users of the survey system is to adhere to established web standards. In this case, the most important documents are the World Wide Web Consortium's specifications for HTML 4, CSS 1 and CSS 2.1. [12, 14, 13] Although different browsers will occasionally render even fully standards-compliant web pages differently, the W3C specifications provide an excellent target for web development.
1.5.2
Backwards Compatibility
As of May 2005, a total of nine organizations have committed to using the Project Assessment system to distribute electronic surveys to their members. Although these organizations publish surveys on their own schedules, at least one survey is active at any given time. For this reason, active development of the survey system must maintain continuity for existing organizations as much as possible. Unfortunately this makes it difficult to enact broad changes or rewrites to the survey code base. Adding new features rarely causes a problem; as long as they are optional, older surveys can simply ignore them. Backwards compatibility causes the most difficulty when there
is a desire to rewrite the underlying code in order to realign the software architecture of the system. Often this limitation required us to phase in an architectural change gradually as manpower allowed. For example, when the new object-oriented table access methods were developed, the old procedural access methods were left in place until all dependent code could be updated.
The data architecture of the survey system is similarly resistant to change. Surveys that have already completed one response cycle are especially tricky, since any changes to the database structure carry the risk of accidental damage to data from prior survey responses. Even if data are not damaged directly during an update, old survey responses may become less useful if the assumptions under which survey data are gathered have changed significantly.
1.5.3
Anticipating Future Needs
While inventing solutions to existing challenges, we must be sure not to build rigid systems which will themselves become roadblocks to progress later on. One way to avoid this pitfall is to use design patterns appropriate to the situation that have stood the test of time. Another way is to plan carefully and have in mind specific extensibility requirements from the start.
The Project Assessment surveys already use a modular framework for survey questions and administrative modules, but that only guarantees a consistent user experience when viewing questions or administrative pages. There are many other pages, such as the Overview or Select Project pages, that are not able to be repre-sented within the modular question framework. Survey pages in DPAS have been refactored to decouple the PHP and HTML code to the greatest extent possible; this reorganization should aid future efforts to bring the entire survey page flow into a
modular page hierarchy.
DPAS has also attempted to avoid assuming that an organization will only have
one active survey. It may be that in the future an organization will want to conduct simultaneous surveys that target different departments, for example. New features such as the multi-organization administration console and the new style of question
configuration have been designed to be adaptable if and when Project Assessment
Chapter 2
Redesigning the Survey System
The design and implementation phases of the software development cycle are neces-sarily more constrained on the second iteration than the first.
Section one delineates the guiding principles of the redesign effort.
Section two describes the Model-View-Control design pattern and how it applies to our survey application.
Section three describes an improvement upon the existing module system for sur-vey questions and administrator modules.
2.1
Guiding Principles
Less is more. In the world of engineering in general, it is desirable for the solution to a problem to be of minimal complexity. A simple, streamlined solution is preferable to a more complicated one for many reasons: it is easier to understand and maintain, less likely to contain bugs and usually more efficient. Software engineers achieve minimally complex solutions in a variety of ways, but one primary method is to reuse components wherever possible. When redesigning the survey system, I attempted to identify and eliminate instances of duplicated functionality.
Modular solutions allow more complex behaviors. When adding a feature to a system that supports multiple instances, the developer has a choice as to whether to
add the feature to a specific instance or to the system as a whole. In the case of our survey system, this translates to the choice between adding a feature to a particular organization's survey, or to the base survey system. In general, the best approach is to add the feature to the underlying system, and allow it to be turned on or off for individual instances. There is a combinatorial motivation for this approach: consider three features A, B and C. Rather than writing eight code paths that implement all non-trivial combinations of the three features, it makes more sense to implement the features as separate modules and call a module if and only if its corresponding switch is "turned on." [7, pp. 163-165] Top-down design techniques can help a developer
achieve this kind of modularity. [4, pp. 143-144, 271-272]
Design for the target audience. Users, administrators and developers all have different needs. An interface designed for a developer can assume more knowledge of the underlying system than one designed for an end user. When building new survey system components and updating existing ones, care was taken to consider the skills and limitations of an average member of the target audience. In several cases, Javascript was used to augment existing question types or OPAS pages to make them more intuitively navigable. [8]
2.2
Model-View-Control
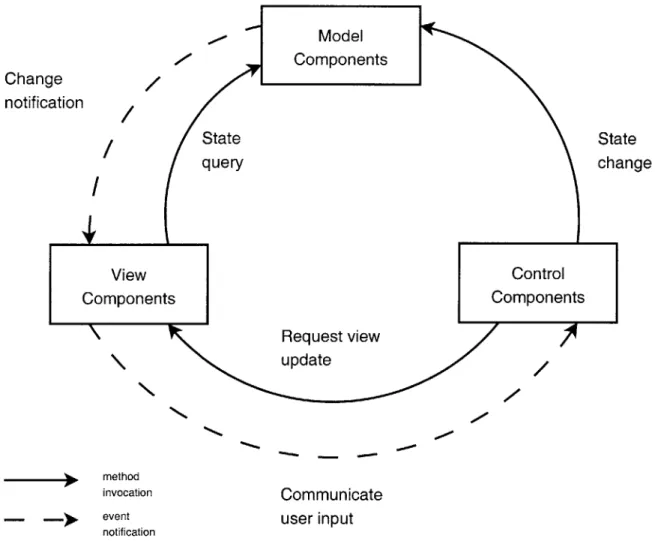
The Model-View-Control (MVC) design pattern was originally created as a logical framework for developing graphical user interfaces alongside applications written in the Smalltalk language. In the MVC paradigm, application data, logic and user interface components are explicitly defined and distinguished. The clear division of functionality made it easier for Smalltalk developers to build applications with complex flows of control, multiple views and several data types. [5, 11, 9]
Early dynamic web applications were typically developed as monolithic collections of documents written in the developer's choice of scripting language or template system. As web applications grew in scope and complexity, they became harder
/
State querym
L
Viewm
Control Components Components Request view updateI
method invocation Communicate event user input notificationFigure 2-1: Model-View-Control component interactions
to design, implement and maintain. A few insightful web developers realized that providing a modular, open source development framework could simplify all three tasks. In May 2000 they started the Apache Struts Project [2], which was the first MVC framework for Java/JSP web applications. Web applications developed using such a framework became known as "Model 2" applications, by way of contrast with the more tightly coupled applications written prior to the advent of such frameworks, which are referred to as "Model 1."
2.2.1
Introduction to Model-View-Control
In an MVC architecture, application data or state is maintained by Model compo-nents. In an object-oriented language, these components often take the form of classes
Change notification Model Components State change
Survey web pages Survey web pages
write read read/ write write
Data object
Database table Database table
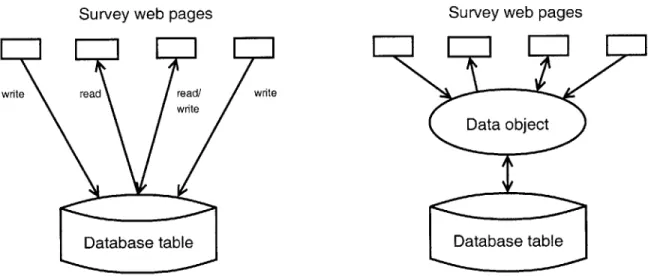
Figure 2-2: Raw access to the data tier vs. unified access via a data object
that wrap data representations like streams or arrays. If we apply this concept to tiered web applications, it makes sense to wrap database queries, tables and records in object classes. Access to and operations on data then occur over an interface that abstracts away details of how the information is stored. If this interface is properly defined, adding support for an additional data source should require at most one new class. Furthermore, changes in the underlying representation of a data source affect only the wrapper class.
View components are responsible for interacting directly with the user. This re-quires displaying data provided by Model components as well as informing Control components of user inputs. In a web environment, the single most complex component of the user's interaction with the application is the web browser. The content devel-oper does not have any direct control over the user's choice of browser, however, so
traditionally the set of View components is restricted to the application components generating dynamic HTML, as well as CSS stylesheets and any other UI components such as Java applets or Javascript code blocks. In the Project Assessment code base,
all dynamic HTML is generated by PHP pages.
Control components tie the Model and View components together. In complex web applications with sets of pages that can be navigated in an arbitrary order, Control
Javascript
CSS
HTML
Web browser
Figure 2-3: Hierarchy of View components
<question type>.php <question type>ph
request render request receive
question question input validation
HTML HTML validation response
receive control s ysT HM
from prior page FORM
No User input Ys
valid?
redisplay survey page pass control
to next page
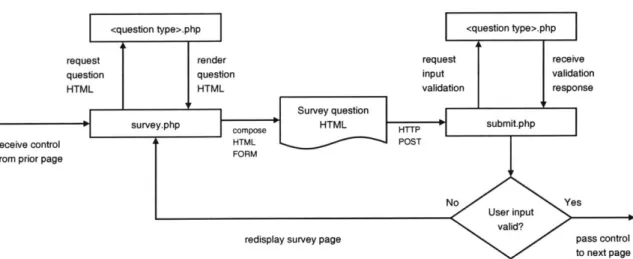
Figure 2-4: Control flow in the Survey-Submit loop
updates to Model components might also be the responsibility of Control components. In MVC frameworks like Struts, Control components describe how incoming HTTP requests are processed and directed to View components.
2.2.2
Application to Survey Page Flow
In a web application built according to the principles of Model-View-Control, each incoming request is handled by an Action object. These objects typically contain parameters that determine how requests are handled and are usually defined in an XML configuration file by the application developer. Action definitions also specify where control is forwarded once the request processing code returns a success or failure. In this way the flow of control through the web application is determined
externally by an explicit configuration, rather than within application components.
incarnations (OPAS and DPAS) has been determined by static links between pages. Inserting a new page after a particular page in the sequence requires modifying that page's source code. Although DPAS does not fix this problem for survey pages, the architecture of the Survey Administration Console as described in section 3.4 provides an intermediate step between a completely static control flow strategy and a fully configurable one. Future work on DPAS as described in section 4.3.2 will include improvements to the representation of control flow in the survey system.
2.2.3 Application to Survey Configuration
Settings Table
One of the primary goals for the redesigned survey system was to migrate the per-organization survey settings from a PHP configuration file to a database table. This would allow consistent access to all aspects of the survey; modifying survey settings uses the same process as modifying survey pages.
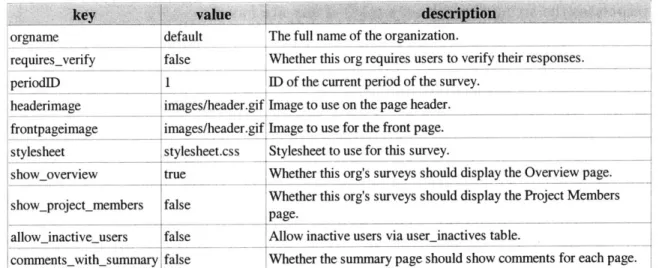
In line with the Model 2 design philosophy, the new settings table is wrapped with a Settings object. When a new object is instantiated, it checks the organization's settings table against a built-in list of default (key, value) pairs. If any keys are missing from the table, it creates a new entry based on the default value for each key. This automatic repair functionality helps to avoid errors caused by missing survey setting keys. Since survey settings are not expected to change once a survey has launched and users are interacting with the system, the Settings object need only be instantiated once per user session. This avoids unnecessary accesses to the database and may improve the scalability of the survey system.
There are three access methods for survey settings, depending on whether the client is requesting a string, a boolean value or a URL. Although all values are stored
in the database as strings, the boolean and URL access methods provide some pprocessing before returning values from the database. Settings. getFlag ($key) re-turns true if and only if the value stored in the database is string-equal to "true". Settings. getURL ($key) returns the value from the database, prepended with the
key value description
orgname default The full name of the organization.
requires-verify false Whether this org requires users to verify their responses. periodID I ID of the current period of the survey.
headerimage images/header.gif Image to use on the page header. frontpageimage images/header.gif Image to use for the front page. stylesheet stylesheet.css Stylesheet to use for this survey.
showoverview true Whether this org's surveys should display the Overview page.
show-project-members false Whether this org's surveys should display the Project Members page.
allowinactiveusers false Allow inactive users via userinactives table.
comments with-summary false Whether the summary page should show comments for each page.
Figure 2-5: Sample rows from the settings table.
current organization ID. These specialized access methods allow the client of the Set-tings object to look up a setting without having to interact with the setSet-tings table via SQL statements, check for errors, and convert the resulting value.
The Settings object provides a mutator that allows the caller to provide the value for a particular setting without worrying about whether that setting already exists in the table. Settings. set ($key, $value) will automatically check for the existence of an entry for $key, using an SQL INSERT if the value does not exist and an SQL UPDATE if it does.
Strings Table
Due to the varying requirements of the organizations participating in the Project As-sessment surveys, many strings displayed on survey pages must be configurable on a per-organization basis. To provide for this functionality, there exists a strings table for each organization that stores strings by key. In order to simplify access to this table, it was wrapped in a Strings class similar in functionality to the Settings class above. The Strings class, however, provides only a single access method and no mu-tator. Modifications to the strings table are expected to be performed manually, so
no programmatic mutator is required. The single access method Strings .get ($key)
in-terpolates the string through an eval () if any are found.
2.3
Rethinking Modularity
The Model-View-Control pattern and its applicability to the design of web applica-tions has demonstrated that modularity is an important tool when developing complex systems. The following sections explore the application of modular design principles to existing elements of the survey system.
2.3.1 Web Page Design
HTML and CSS are two basic standards that underpin all web sites, whether static or dynamic. Although HTML was used to represent both form and content during the early days of the World Wide Web, the World Wide Web Consortium (W3C), an international standards organization, has since developed the Cascading Style Sheet (CSS) specification as a richer, more flexible method of describing the aesthetic attributes of a web page. Currently, the W3C recommends that to the fullest extent possible, HTML be used to encapsulate a page's content, and CSS be used to describe its appearance to the user.
Properly factoring a web site into mutually independent HTML and CSS docu-ments is challenging, but has immediate benefits. As part of the Project Assessment survey system, survey pages have a "Printer Friendly" view that disables form input elements and converts the page into a portrait orientation for easy printing. In the ideal case, switching between the "Printer View" and "Normal View" would require nothing more than switching the CSS stylesheet used to style the page. The original survey web site used HTML attributes as the primary method used to format survey pages. As an intermediate step, nearly all HTML-based formatting has been replaced by inline CSS via the STYLE attribute.
2.3.2
OPAS Modules
OPAS survey questions were initially implemented using a module system whereby
the PHP filename of a survey question was used to locate question-specific functions
within a global namespace. Questions supplied four primary methods:
<filename>_showo, <filename>_summary(, <fi1ename>_submit_tag() and
<f ilename>_handle (. OPAS administrator modules written for the CMI
adminis-tration console used a similar set of methods: <f ilename>-title 0,
<f ilename>_navigat ion(, <f ilename>-update () and <f ilename>_showo. These module systems made it easy to write new question types and administrator modules, but suffered a major pitfall: if a survey developer wanted two pages that displayed slightly different behavior, there were two options. First, the original question type could be copied to a new file, the function names changed, and the source code slightly
modified. This has the benefit of keeping both resulting question types relatively
sim-ple, but at the expense of considerable code duplication and double the maintenance. Another option would be to add a switch to the original question type, allowing for
the selection of one behavior or the other. This solution avoids code duplication but
requires more effort to implement.
Those familiar with object-oriented languages will know that this problem has al-ready been solved by object hierarchies. In an object-oriented system, the developer would add a new question type by extending a base question type and writing new code only for behavior that differs from the base. Each page in the Survey Adminis-tration Console is implemented by a PHP subclass of surveyadmin.AdminPage, and in the future survey pages will also be adapted to an object-oriented architecture.
Chapter 3
Survey Construction
3.1
Overview
This chapter describes a new web-based Survey Administration Console (SAC). The goal of the SAC is to drastically reduce the time Project Assessment personnel spend designing and configuring a survey.
Section two describes the motivaton for designing and implementing the SAC. Section three describes the capabilities of the console itself.
The final section describes the software architecture of the console, and explains how additional functionality can be implemented by building on existing components.
3.2
Motivation
Ever since OPAS was developed, constructing a survey required in-depth knowledge of the survey source code. Since each survey question type was implemented differently, the format of an entry in the questions table depended heavily upon which question type was being configured. Some question types required more configuration than others, so the finite fields of the questions table were forced to don different meanings when used with different questions. Adding a question to an existing survey by inserting a questions table row required either reading the source code or finding an example to build upon.
Building survey sections was slightly easier, since the names of fields in the question-sections table closely reflect their actual meanings. Unfortunately the process was still not very user-friendly, since the questions that belong to a par-ticular section are specified by question number. Survey administrators editing the question-sections table had to flip back and forth between it and the questions table in order to resolve question number cross-references.
Although once surveys are finalized and launched they typically require only mini-mal changes, experience with prior surveying organizations has shown empirically that surveys undergo several revisions as we prepare them for the customer. If Project Assessment ever added more than two new organizations at a time, the necessary cy-cles of revision combined with omnipresent maintenance work would quickly become too much for one person to handle. In short, we desperately needed a tool that made the process of setting up a survey easy and intuitive.
3.3
The Survey Administration Console
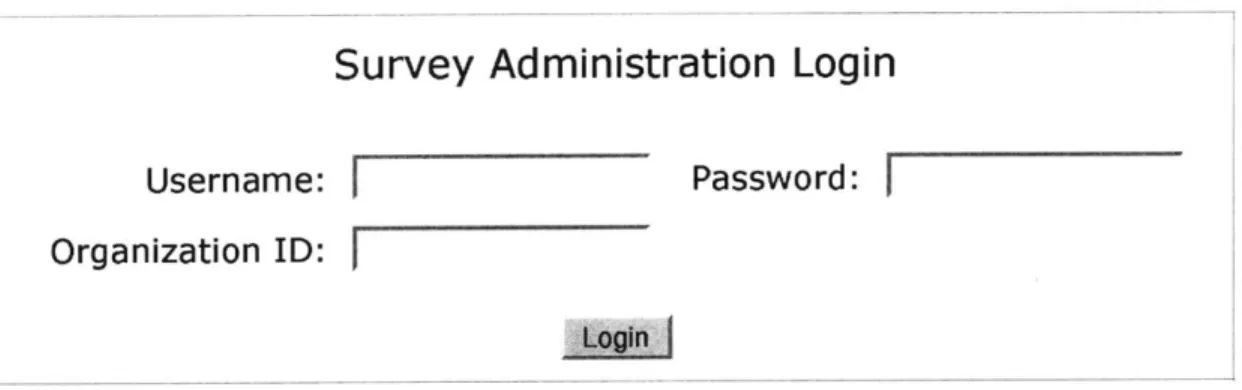
Survey administrators begin using the SAC by logging in with a username, password, and organization ID. The login page then searches for a record with the specified username and password in the administrators table in the database named by the organization ID. Different organizations can therefore have different administrators; although for now all survey edits are performed by Project Assessment staff, this functionality will be useful if any part of the survey design process is offloaded onto external administrators.
Upon a successful login, the user is directed to the Main Menu. All SAC func-tionality is available from this menu.
3.3.1
Survey Questions
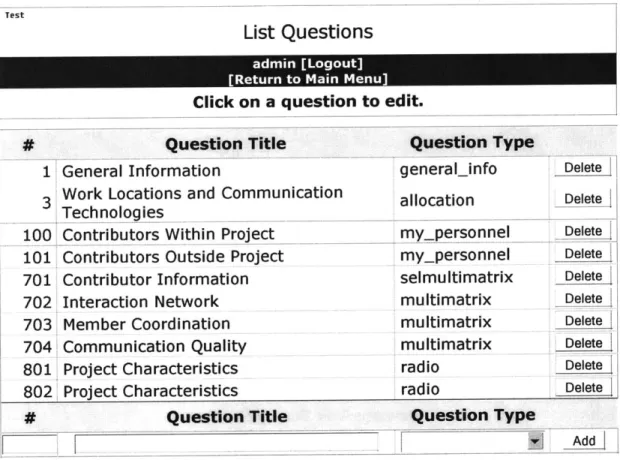
Selecting "List and Configure Survey Questions" from the Main Menu will bring the user to a page listing questions by question number, question title and question type. This view is very similar to examining the questions database table directly, but
Survey Administration Login
Username:
|-Password:
[Organization ID:
Login
pg
Figure 3-1: Survey Administration Console login page
Main Menu
admin [Logout] Select an option below.Figure 3-2: Survey Administration Console main menu
Test
View and Edit Survey Sections List and Configure Survey Questions Edit Background Information Questions
Edit General Information Questions Edit Survey Settings
Test
List Questions
Click on a question to edit.
Question Title
General Information
Work Locations and Communication Technologies
Contributors Within Project Contributors Outside Project Contributor Information Interaction Network Member Coordination Communication Quality Project Characteristics Project Characteristics Question Title . . Question Ty generalinfo allocation mnypersonnel my-personnel selmultimatrix multimatrix multimatrix multimatrix radio radio
Figure 3-3: Survey Administration Console question list page
1 3 100 101 701; 702 703 704: 801 802 pe Delete Delete Delete Delete Delete Delete Delete Delete Delete Delete Question Type Add I ... .......... ..
-with a less cluttered layout and the addition of user-friendly features. From this page one can easily add a question by filling out the input fields at the bottom of the page, or delete a question by clicking on the corresponding "Delete" button. Clicking on a question title selects a question for editing and forwards the user to the "Edit Question" page. Adding a question will create a new row in the questions table and then forward the user to the "Edit Question" page.
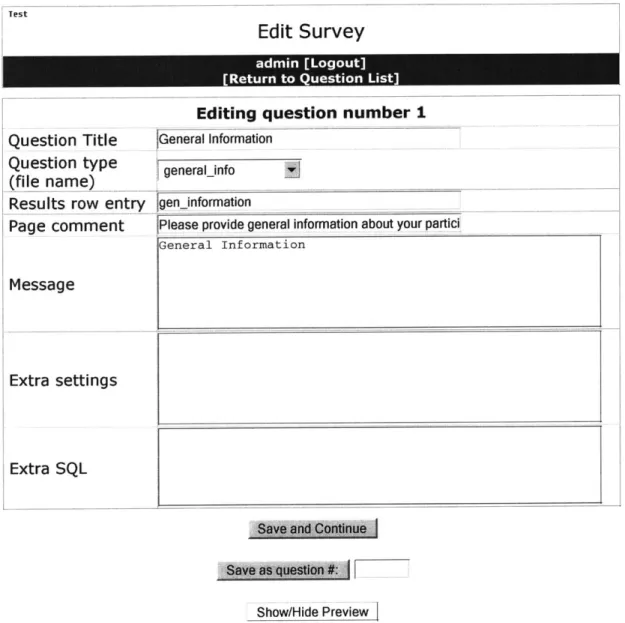
The appearance of the "Edit Question" page differs depending on whether the question being edited supports the new type of question configuration or not. If it does not, the page shows editable fields corresponding to the Label, Message, extra, question-title, f ilename, sql-extra and comment fields from the questions ta-ble. Editing these fields is analogous to modifying the database table directly, but the user is given the additional options of saving the modified values as a new question number, or previewing the question page as it will appear to people taking the survey.
If the question type supports the new style of question configuration, the only
di-rectly editable fields from the questions table are Label, question-title, f ile-name
and comment. In lieu of the remaining fields, a table of configuration items and
their values is presented to the user. Configuration items are loaded by selecting all rows from the question-config table corresponding to the current question num-ber. The display format of each configuration item depends on its declared type in the question-conf ig table. Boolean values are represented as a pair of True/False radio buttons. Text values are rendered as a text area. Lists display as a vertical column of text boxes. Table values appear as two-dimensional tables. By allowing for an arbitrary number of configuration items per question, displaying values in intu-itively understandable formats and showing the user a preview of the question page, we simplify considerably the task of configuring a question according to the desired specifications.
3.3.2 Survey Sections
Selecting "View and Edit Survey Sections" from the Main Menu brings the user to a page listing survey sections. This page loads the fields sectionID, permission,
Test
Edit Survey
Question Title Question type
(file namne)
Results row entry Page comment
Message
Extra settings
Extra SQL
Editing question number 1
General Information general-info
-geninformation
IPlease provide general information about your partici lGeneral Information
Show/Hide Preview]
Figure 3-4: "Edit Question" page for questions not using the question-conf ig table
.
... ... ... ... ... ... ... ... -.- ... .
Test
Edit Survey
Question Title Question type
(file name)_ Results row entry Page comment
Editing question number 3
Work Locations and Communication Technologies allocation
jalocation
IPlease estimate the percentage of time, during the pr
Configuration Value
item
Eating these items A Riding these items ±aIJ Apples M11 Bicycle
I&1J Bananas i Tricycle
questions .I Other M Car A Other
Add Delete Add Delete
Show/Hide Preview
Test
Edit Survey
Click on a section or question to edit. Sections with permission level I
Section Title Questions General Information
UN Project Contributors
MM Contributor Informatio
N Project Characteristics
1 General Information
100. Contributors Within Project
101 Contributors Outside Project 701 Contributor Information 702 Interaction Network 703, Member Coordination
704, Communication Quality
801 Project Characteristics
Sections with permission level 2
Section Title
Delete o General Information ...
Delete EM Project Contributors
Delete MM Contributor Information
Delete M Project Characteristics
Add Section I
Questions
1 General Information
100 Contributors Within Project 101 Contributors Outside Project 701 Contributor Information 702 Interaction Network 703 Member Coordination 7041 Communication Quality 801 Project Characteristics Delete Delete Delete Delete Add Section
Test
Edit Survey
sectionn To what extent did contributors interact and coordinate work in the projec Description
# Title Type
M 701 Contributor Information selmultimatrix Delete Q s n:702 Interaction Network multimatrix Delete
Questions
tAl 703 Member Coordination multimatrix Delete 704 Communication Quality multimatrix Delete Add Select a question to add
-Save and Return to Edit Surveyj
Figure 3-7: Survey Administration Console "Edit Section" page
questions and sectionTitle from the question-sections table. The sections are first grouped by permission, then ordered by sectionlD before being displayed to the user. For each section, the page displays: the section title, the questions contained by the section (question number and title), a delete button and reordering buttons. For each permission level, there is an "Add Section" button that can be used to create an empty survey section with the specified name.
Clicking on a question number or question title will bring the user to a question editing page as described above. Clicking on the "Delete" button deletes the corre-sponding table row from question-sections. Clicking on a reordering button will move a section up or down by swapping its sectionlD with the section immediately before or after it in the table. Because the sectionlD is used only for ordering and never for selecting specific survey sections, we have hidden the actual sectionlD values and rely instead on a visual ordering of the rows.
Clicking on a section title sends the user to the "Edit Section" page. This page shows editable text boxes corresponding to the section title and section description. Questions contained by the section are displayed in the order they appear in the
Editing Section 3
Contributor Information Section Title
r pemssion typ-c tidle default value display resutf d reut-tabk required,
text $project['projectnamel $project['projectname'] $project['projectname'I projectname results false Submission
2 1 text Date date("j F Y") date("j F Y) false (Today)
1 text Project $project[MrTLeader' $project[MrTLeader'] $ojectUMfLeader'] MITLeader results false
Manager _____________ _________
Figure 3-8: Sample rows from the general-inf o-questions table.
survey. The question number, question title and type of question are displayed for clarity. Questions can be reordered using iconic buttons in the same way as sur-vey sections. A question can be removed from the section by using the appropriate "Delete" button. A pulldown at the bottom of the table of questions allows the user to add a question type from the list of available questions. When the user clicks on "Save and Return to Edit Survey," the form values on the page are used to update the corresponding row in the question-sections table.
3.3.3
Special Question Types
There are two survey pages that load their format from special database tables. The "Background Information" page (person-inf o. php) and the "General Informa-tion" question type (general-inf o.php) load from the person-inf o-questions and general-inf o-questions tables, respectively. These two pages are special because every item displayed by either page is configured by one table row. The function of the various fields is described below:
" rank: Ordinal value. Items are ordered by rank before being displayed.
* permission: Item is shown only if permission of user is equal to this value. " type: Determines the way the item is visualized. Valid values are: input, select,
text, blank, monthyear.
* title: This text is shown as a label to the left of the actual text or input element.
" default: If no value is found with which to populate this text field or input
element, use this value by default.
" value: Use this value or sequence of values for the value attribute of the HTML
input element.
" display: Use this value or sequence of values to determine what the user sees.
* result-field: When this question is submitted, write the user-determined value to this field.
" result-table: When this question is submitted, write the user-determined
value to this table.
* required: This boolean condition must evaluate to f alse in order to proceed to the next page. If it is optional for users to provide a value for this question, this field may simply contain false.
The values of these fields can be a mix of HTML, PHP and plain text. Due to their complex format, these tables are only updated by Project Assessment adminis-trators who are familiar with the source code used to render these pages. As a result, the Survey Administration Console provides the "Special Question Types" page that allows the editing of these tables directly, without any simplifications. This function-ality is implemented by the surveyadmirn. TableEdit class, which exposes any database table to the user in the form of an interactive spreadsheet. This class is described further in section 3.3.5.
3.3.4 Survey Periods
Once a survey has been created, it can be distributed once or for multiple survey periods. Our hope is that most organizations will choose to continue with a survey over several periods so that IDI researchers can analyze time-varying data and discover performance trends. By default, surveys are initialized with a single period. Once all
Survey Period
Choose a survey period.
$ Spring 2004 Nov 01, 2003 - Apr 30, 2004
r Fall 2004 May 01, 2004 - Oct 31, 2004
r Spring 2005 Nov 01, 2004 - Apr 30, 2005 Add Jan 01 - 1990j Jan7 j 01 1990#
Save and Continue
Figure 3-9: Selecting a Survey Period
results have been gathered from the first period, survey administrators can choose to create a second period and select it as active.
In the past, Project Assessment personnel have had to perform the transition from one period to the next by hand. There are several steps involved, and failing to perform any of them can cause problems that range from subtle to catastrophic. The "Survey Periods" page automates these steps as much as possible. This page loads table rows from the periods table and allows the user to select an existing period or create a new one. When creating a new period to use as the active one, the following steps must be performed:
1. Create a new row in the periods table with a period ID, description, start date and end date.
2. Append the new period ID to all rows in people that contain the current period ID in the periods field.
3. Copy all rows in the projects table with periodID set to the current period to new rows with periodID set to the new period.
4. Update all rows in the user table where periodID is equal to the current period; set it to the new period.
5. Set the value of the periodID setting to the new period ID.
If instead of creating a new period, the user wants to revert to an existing period, we can ignore all steps except the last two. Records in the people, projects and periods table already exist, so only the user table and periodID setting need to be changed.
3.3.5
Survey Settings
Survey settings in DPAS are stored in a settings database table as described in section 2.2.3. Since the format of the settings table is relatively simple, and users are only expected to need to edit one column (value), it makes sense to allow the table to be edited directly. As with the Background Information and General In-formation tables mentioned above, survey settings are edited by using the generic
surveyadmin. TableEdit class.
The surveyadmin. TableEdit class is an example of an extension to
surveyad-min.AdminPage that uses a combination of CSS and Javascript to create a more
powerful user interface. Upon page load, TableEdit uses the value of the table pa-rameter from the HTTP GET request as the name of the database table to display. If the start parameter is set, its value is used as the index of the first row to display (as an argument to the SQL LIMIT command). Once the proper rows are loaded from the database table, they are rendered as a two-dimensional table using standard HTML. Values which overflow the visible table cell can be viewed by hovering the mouse over the cell; the complete value will appear as a tooltip on modern web browsers.
When the user clicks on a table cell, a Javascript function doEdit (cellID) is used to make visible an HTML text area and align it with the top left corner of the selected cell. The text area is populated with the current value of the cell and selected for input focus. Once the user moves focus away from the text area (either by using the Tab key or by clicking outside of the area), the Javascript function doHide() is called to hide the text area and write the edited value back to the table cell. Cells whose values have been modified are highlighted to show that they differ from the