Dynamic Optimization of IA-32 Applications
Under DynamoRIO
by
Timothy Gamett
Submitted to the Department of Electrical Engineering and Computer Science in Partial Fullfillment of the Requirements for the Degree of Master
of Engineering in Computer Science
at the
MASSACHUSETTS INSTITUTE OF TECHNOLOGY
MAY 2003
© 2003 Massachusetts Institute of Technology All Rights Reserved
Signature of Author...
Department of Electrical Engineering and Computer Science May 21, 2003
C ertified b y ... ... ... ... ... Saman Amarasinghe Associate Professor of Computer Science Thesis Supervisor
A ccepted by... ... .. .. . ...
Arthur C. Smith Chairman, Department Committee on Graduate Theses
MASSACHUSETTS INSTITUTE OF TECHNOLOGY
EMG
JUL 3
0
2003
Dynamic Optimization of IA-32 Applications
Under DynamoRIO
by
Timothy Garnett
Submitted to the Department of Electrical Engineering and Computer Science in Partial Fulfillment of the Requirements for the Degree of Master of
Engineering in Computer Science
Abstract
The ability of compilers to optimize programs statically is diminishing. The advent and increased use of shared libraries, dynamic class loading, and runtime binding means that the compiler has, even with difficult to accurately obtain profiling data, less and less knowledge of the runtime state of the program. Dynamic optimization systems attempt to fill this gap by providing the ability to optimize the application at runtime when more of the system's state is known and very accurate profiling data can be obtained. This thesis presents two uses of the DynamoRIO runtime introspection and modification system to optimize applications at runtime. The first is a series of optimizations for interpreters running under DynamoRIO's logical program counter extension. The optimizations include extensions to DynamoRIO to allow the interpreter writer add a few annotations to the source code of his interpreter that enable large amounts of optimization. For
interpreters instrumented as such, improvements in performance of 20 to 60 percent were obtained. The second use is a proof of concept for accelerating the performance of IA-32 applications running on the Itanium processor by dynamically translating hot trace paths into Itanium IA-64 assembly through DynamoRIO while allowing the less frequently executed potions of the application to run in Itanium's native IA-32 hardware emulation. This transformation yields speedups of almost 50 percent on small loop intensive
benchmarks.
Thesis Supervisor: Saman Amarasinghe Title: Associate Professor
Acknowledgments
This thesis would not have been possible without the help of many individuals. Saman Amarasinghe's guidance and advice as my thesis supervisor was of crucial help in the this thesis project, as was the herculean effort put in by Derek Bruening in developing and optimizing DynamoRIO into a fast, stable, and usable dynamic introspection and modification system. I would also like to acknowledge Greg Sullivan, Derek Bruening and Iris Baron for their work in creating version of DynamoRIO that supports logical pc based interpreters and Greg Sullivan for modifying Ocaml to work with the logical pc version of DynamoRIO. They put in huge amount of effort getting the infrastructure in place to make this thesis possible. Thanks also to all of DynamoRIO group for serving as sounding board for my ideas and suggesting improvements.
Biographical Note
The author was born in the city of Soldotna, Alaska USA on September 26' 1980. He attended secondary education at Soldotna High School in the aforementioned city from 1994 to 1998 when he graduated Valedictorian. He then attended the Massachusetts Institute of Technology (MIT) from 1998 to 2003 in pursuit of a Bachelor's of Science and Master of Engineering in Electrical Engineering and Computer Science, this thesis
forming his last requirement for graduation. Through MIT's undergraduate research opportunities program the author spent the summer and fall of 2000 working with the tiAMPS group at MIT's Microsystem Technologies Laboratory where he co-authored a paper with Manish Bhardwaj and Anantha P. Chandrakasan titled "Upper Bounds on the Lifetime of Sensor Networks" published in the proceedings of the IEEE International Conference on Communications, Pages 785 -790, 2001. Through the same program during the summer and fall of 2001, he worked with MIT Starlogo' group on their Starlogo educational software project. Starting January of 2002 the author began work on the with COMMIT group in MIT's Laboratory for Computer Science on the DynamoRIO project. He was co-author with Derek Bruening and Saman Amarasinghe for a paper titled "An Infrastructure for Adaptive Dynamic Optimization" published in the Proceedings of the 1st International Symposium on Code Generation and Optimization, San Francisco, March, 2003. He was also a co-author of a paper titled "Dynamic Native Optimizations of Interpreters" to be published in ACM SIGPLAN 2003 Workshop on Interpreters, Virtual Machines and Emulators (IVME 03).
Contents
1. Introduction 15 2. Related Work 19 3. DynamoRIO 21 3.1 What is DynamoRIO? 21 3.2 DynamoRIO Operation 214. DynamoRIO for Interpreters 24
4.1 DynamoRIO and Interpreters 24
4.2 The Logical Program Counter Extension to DynamoRIO 25 4.3 Benefits of the Logical Program Counter Extension 26
5. Optimizing Interpreters with DynamoRIO 28
5.1 Overview of Optimizations 28
5.2 Constant Propagation Optimization 29
5.2.1. The Constant Propagation Annotation Interface 29
5.2.2. Issues Considered 30
5.2.3. Operation 31
5.3 Dead Code Removal Optimization 33
5.4 Call Return Matching Optimization 34
6. Performance of DynamoRIO Optimized Interpreters 36
6.1. Introduction to the Interpreters 36
6.2.TinyVM Interpreter 37
6.3.Ocaml Interpreter 39
7. DynamoRIO as an IA32 Accelerator for Intel's Itanium Processor 40 7.1. Motivation for an IA-32 Accelerator for Itanium 40
7.2. Implementation of the IA-32 Accelerator 42
7.3. Performance of IA-32 Accelerator 47
7.4. Future Considerations 47
8. Conclusion 49
Appendix 1 -Annotation of a Simple Interpreter 50
Appendix 2 - Source Code of IA-32 Accelerator Tests 51
List of tables
Table Table Table 3.1 4.1 4.2 Table 4.3 -Table Table 6.1 6.2Performance of Base DynamoRIO System
Lines of Code Needed to Annotate an Interpreter Trace Length and Early Exit Characteristics of Traces
for DynamoRIO with Logical PC Extensions
Trace Length and Early Exit Characteristics for Base DynamoRIO
Execution Time in Seconds of the TinyVM Benchmarks Execution Time in Seconds of the Ocaml Benchmarks
23 26 27 27 38 38
List of figures
Figure 3-1 Figure 4-1 Figure 5-1 Figure 5-2 Figure Figure Figure 5-3 5-4 6-1 Figure 6-2: Figure 6-3 : Figure 7-1 : Figure 7-2:Overview of DynamoRIO structure
The Exported DynamoRIO Logical PC Interface The Exported Optimization Annotation Interface Demonstration of Constant Propagation Optimization
and the Trace Constant Interface
Call Return Matching Optimization Sample Trace Stack Adjust Optimization Sample Trace
Performance of the TinyVM Interpreter on Various Benchmarks with and without Optimizations Breakdown of the Contribution of the Various
Optimizations for Select TinyVM Programs Performance of Optimizations Relative to Native
Interpretation and Compilation on Ocaml
Sample Trace Translated into IA-64 by the IA-32 Accelerator
Performance of the IA-32 Accelerator
22 26 29 32 33 34 37 38 39 44 46
Chapter 1
Introduction
The ability of compilers to optimize programs statically is diminishing. The advent and increased use of shared libraries, dynamic class loading, and runtime binding complicates the ability of the compiler to analyse and optimize programs. Even good profiling
information can be insufficient when an application's behavior changes dynamically. For good performance many versions of the compiled application may be needed be to take performance implications of subtle architectural differences between compatible
processors (even processors in the same family) into account. Vendors are loathe to ship multiple versions of the same product, or even one highly optimized version for fear of debugging problems. Dynamic optimizations systems attempt to fill this gap by providing the ability to optimize the application at runtime when more of the system's state is known and very accurate profiling data can be obtained. This moves the option of optimization to the end user who can tailor it more to his system, without relying on the vendor.
This thesis presents two uses of the DynamoRIO runtime introspection and modification system to optimize applications at runtime. The first is a series of
optimizations for interpreters running under DynamoRIO's logical program counter extension. The optimizations include extensions to DynamoRIO to allow the interpreter writer add a few annotations to the source code of his interpreter that enable large amounts
of optimization. The second use is a proof of concept for accelerating the performance of IA-32 applications running on the Itanium processor by dynamically translating hot trace paths into Itanium IA-64 assembly through DynamoRIO. Both uses of DynamoRIO show significant speedups on applications relative to running natively.
Interpreters form a broad class of applications with significant amounts of information (often including some representation of the program being interpreted) available to a runtime system that isn't available to a static compiler. The use of interpreters is becoming more and more widespread too, with proliferation of domain specific, scripted, dynamic, and virtual machine targeted languages. Many such languages lack a good native compiler and the barriers to writing one are high. A compiler is an incredibly difficult piece of software to write, it is specific to a particular architecture and language and requires a deep understanding of the underlying architecture. For dynamic languages it is especially difficult. Thus, there are many languages without compilers, or, at best, with compilers that only target a select few architectures. An simple interpreter for a language, however, is often easy and straightforward to write. This makes custom
dynamic languages incredibly useful as an abstraction tool. Like a custom library a domain specific language can hide many of the unnecessary complexities of a given task, and indeed the design of a new language is a lot like the design of a new library.
Unfortunately, there is a large overhead involved when interpreting a language and this greatly affects performance. This lack of performance is often a major barrier to the wider acceptance and use of custom languages. The overhead is often finally resolved with the development of a compiler for the language, a just in time compiler (JIT) that compiles the application on the fly for highly dynamic or portable languages, or the migration to a new language.
The work that is involved for writing a compiler or JIT is enormous, easily and order of magnitude more difficult than an interpreter, and must be repeated for each architecture on which it is desired to run. As a partial alternative to writing a compiler or JIT for a language, one can remove some of the interpretation overhead through the use of a runtime optimization system such as DynamoRIO. The DynamoRIO runtime
an interpreter writer to, with minimal annotation of his interpreter, achieve a large speedup running his interpreter under DynamoRIO relative to running it natively. A 20 to 60 percent reduction in the runtime of interpreted programs is shown (chp. 6) on two sample interpreters. The first contribution of this thesis are the optimizations that go into
achieving this boost in performance and the interpreter annotations interface necessary to enable them. The end goal of such research is to make dynamic interpreted languages feasible for a wider variety of problems by reducing the overhead of the interpreting
system without sacrificing the ease of development of the interpreter.
The second contribution is extending the DynamoRIO runtime introspection and modification system to dynamically accelerate IA-32 applications running on Itanium processors by translating hot traces of the application into Itanium's native IA-64. The IA-32 program is initially executed in the Itanium's native IA-32 hardware emulation
mode under DynamoRIO, as it runs frequently executed traces are translated into Itanium's native IA-64 and linked together while the remainder of the program continues to run in IA-32 mode. As a proof of concept, performance gains of almost 50 percent are shown for some simple example cases.
The Intel Itanium family of processors are a relatively new offering from Intel geared towards the server market. They operate natively on the Intel IA-64 instruction set, but also have hardware emulation support for the IA-32 instruction set (also referred to as x86) for backwards binary compatibility with previous Intel offerings. Unfortunately the adoption of Itanium processor has been slow, partly because of the difficulty in migrating IA-32 applications to Itanium environments. While the Itanium processor can execute unmodified IA-32 compiled applications, it does at a tiny fraction of the speed of modem IA-32 processors such as AMD's Athlon and Intel's own Pentium IV. Given the huge differences between the IA-32 and IA-64 ISAs this is not too surprising (even taking into account the hardware resources Itanium processors devote to
emulating/translating IA-32 instructions). The ability of the Itanium chip to execute all IA-32 instructions means that only the most frequently executed code needs to be translated and that any hard to translate oddities in the IA-32 instruction set need not be translated making efficient translation more feasible at runtime. Since most processor
intensive IA-32 applications are, in practice, unusable on Itanium processors, many potential users of Itanium with IA-32 applications have avoided buying Itanium
processors. Thus, IA-32 performance on Itanium processors remains a major barrier to the wider adoption of Itanium processors and one that is feasible to address with a runtime optimization system.
This thesis breaks down into three main sections: background and explanation of the core DynamoRIO system, using DynamoRIO to improve the
performance of interpreters, and using DynamoRIO as a dynamic translator for Itanium processors. Chapters one, two, and, three give an introduction and overview of the thesis, present related work and explain the core DynamoRIO system. Chapters four, five, and six then cover the optimization of interpreters. Chapter seven covers DynamoRIO on Itanium. And, finally, chapter eight concludes.
Chapter 2
Related Work
The problem of running one language on top of another has long been an active area of research. Interpreters, JITs, emulators are all part of the broad spectrum of ways people have approached this problem. A lot of work has been done on dynamic translation as a method for speeding up the emulation of a non-native instruction set [5] [9] [12] [13] [19]
[21]. Since the Itanium processor family was developed jointly by Intel and Packard, there was concern that Itanium be able to run binaries compiled to Hewlett-Packard's PA-RISC ISA to enable a smooth migration path. This concern was addressed through software dynamic translation of PA-RISC binaries into Itaniums native IA-64 ISA
via the Aries system. Because PA-RISC maps rather cleanly over to IA-64, very little overhead is involved in the actual translation and applications running this way on an Itanium processor achieve nearly the performance they would get on a similarly clocked PA-RISC chip.
Transmeta's [15] code morphing technology is a similar product that runs IA-32 applications on Transmeta's natively VLIW Crusoe processor by dynamically translating and optimizing the applications binary. Code morphing technology has the
advantage of having having hardware specially designed to ease the dynamic translation of IA-32 programs. IBM's Daisy [12] is another effort to target VLIW from existing
assistance from the underlying VLIW hardware. A major way these efforts differ from the Itanium work in this thesis is in their choice of architecture and their ability to give up on a particularly difficult translation, since the Itanium hardware can (albeit inefficiently) execute the original IA-32 code if necessary. Thus, completeness of translation in the system proposed here is not as much of an issue. This allows us to focus on only
translating the code that executes most frequently and justifies the spending of extra cycles optimizing that translation.
JIT technology also dynamically translates languages and ISA's, but once again the translation is forced to be complete. Offline, optimizing, binary to binary translators do exist [8][18], but they don't have access to the runtime profiling information that a dynamic translator had. Some high languages seem to require a degree of dynamic compilation for an efficient implementation [10][1][14] making runtime compilation or interpretation the only feasible implementation route. Low overhead profiling is the key to dynamic optimizations [2] [11], since without profiling information about a program it can't be optimized fully and if the profiling is too expensive (in cycles) then more execution time is spend performing the optimization than is saved by having it.
DynamoRIO [7] has very low profiling overhead which is one of the reasons it is ideally suited for these purposes.
Chapter 3
DynamoRIO
3.1 What is DynamoRIO?
DynamoRIO [7] is, from a users standpoint, an IA32 instruction set interpreter
implemented on an IA32 platform. Its purpose is to allow for the dynamic introspection, modification, and optimization of native executables at an individual instruction
granularity. DynamoRIO is based on an IA32 port [6] of the original Dynamo project [4] and runs on unmodified native binaries with no special hardware or operating system support. It runs on both Windows and Linux and is reliable and scalable enough to run large desktop applications.
3.2 DynamoRIO Operation
Since one of DynamoRIO's stated purposes is dynamic optimization, it is important that the system have a very low overhead. Simple interpretation would allow DynamoRIO to achieve its functional requirement of full control over the running native executable, but the overhead of such a system, especially given the complexities of the IA32 instruction
set, is enormous. To amortize the cost of interpreting the original program, DynamoRIO interprets by copying basic blocks of IA32 instructions from the original program into a fragment cache and executing them there. Each block in the cache has its ending control
flow instruction modified to save the machines state and return control to DynamoRIO which finds the next basic block to execute. Only code in the fragment cache is allowed to execute, never code in the original image of the binary. As the number of fragments
increases, performance is improved by modifying fragment ending direct branches to jump directly to their targets in the fragment cache instead of back to DynamoRIO.
At this stage, indirect jumps are the major performance bottleneck. Indirect branches must go through a lookup function to translate the applications address into an address in the cache, a major source of overhead. Each translation of a program address to its cached basic block requires a transfer of control back to DynamoRIO and thus a save of the processors state. To overcome the high cost of these control switches, DynamoRIO
adds a fast hash table lookup routine in the cache that translates the address target of the indirect jump into its corresponding cached fragment, returning control to DynamoRIO only if there is no cached block associated with that address. Further since even a fast hash table lookup is slow compared to a native indirect branch, DynamoRIO inlines a common target into a check before going to the hash table lookup, to avoid the lookup cost when the jump targets that location.
As a final optimization, certain interesting fragments, such as the targets of
START basic block builder tace slector
I t V
dipatch
Figure 3.]: Diagram of DynamoRf 0 structure. Dark areas are cached application code. Gray areas are DynamoRlO code. Lines denote paths of control flow.
backwards taken branches (likely loop heads), are tagged with a counter that counts the number of times execution reaches that fragment. In DynamoRIO parlance these are
referred to as trace heads. When the trace heads counter exceeds a certain threshold a trace is created starting at the trace head and continuing through successive basic blocks until a backward jump is executed or another trace or trace head is reached. The targets of all exits from the trace then become trace heads themselves. This approach, called next executing tail (NEXT) tracing by the original Dynamo authors, minimizes profiling overhead and is statistically likely to pick good traces[3][4][6][11]. Experimentation by the original Dynamo authors [4] [11 ] suggests that any more complicated profiling scheme to pick hot traces dynamically will have a very difficult time recovering its overhead from improved traces. Traces improve performance by improving code layout for caching effects and by picking good indirect branch inlining targets. On overview schematic of the
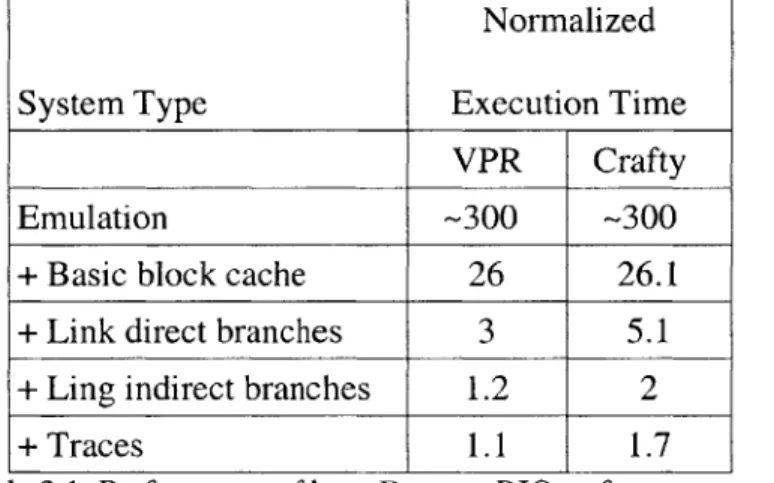
system can be found in figure 3.1. Table 3.1 summarizes some rough numbers on how the various core parts of the system effect performance.
DynamoRIO traces are single entrance multiple exit traces. That is, control will only enter from the top, but may exit at many places. Since there is virtually no control flow internal to the trace, certain types of optimizations are easier to write. DynamoRIO also exports an interface to allow an outside library to modify traces and basic blocks before they are emitted into its cache allowing optimization and instrumentation of the program and an interface for an application to run itself under DynamoRIO.
Normalized System Type Execution Time
VPR Crafty
Emulation -300 -300
+ Basic block cache 26 26.1
+ Link direct branches 3 5.1
+ Ling indirect branches 1.2 2
+ Traces 1.1 1.7
Table 3.1: Performance of base DynamoRIO as features are added. Measured with two SPEC2000 benchmarks: crafty and vpr. These were gathered from an old version of DynamoRIO, recent versions suffer less overhead at all levels.
Chapter 4
DynamoRIO for Interpreters
4.1 DynamoRIO and Interpreters
The use of interpreters is pervasive and becoming more common. For domain specific, scripting, dynamic, and virtual machine targeted languages the most straight forward runtime environment is an interpreter. For many such languages a compiler or JIT would be very difficult to write. Unfortunately, the performance difference between an
interpreted and compiled or JITed program is often huge (easily and order of magnitude in many cases). This because interpretation implies the existence of a substantial amount of overhead. It would be nice if DynamoRIO could speed up interpreters by eliminating some of the interpretation overhead.
Most interpreters follow a common idiom of design. Typically some front end will parse the interpreted program into some simpler (byte code) format which is then interpreted through some sort of dispatch loop. While there are many tricks on can take to speed up such an implementation, as long as the interpreter is dealing with a representation of the original program and not instructions native to the architecture there is overhead. The typical read-switch-jump dispatch loop confounds DynamoRIO since DynamoRIO's tracing algorithm will only end up building one trace through the switch statement. Such a trace will exit early almost all the time (see table 4.3) because it will only be valid for a
particular byte code and since most interpreters do very little work for each byte code, there is a high number of indirect jumps (from the switch statement) relative to the execution time. Indirect jumps are a major performance drainer for DynamoRIO since they become hash table lookups in its runtime system. Threaded interpreters do little better. A threaded interpreter uses pointers to the native instructions that will evaluate the byte code within the byte code itself (read-jump instead of read-switch-loop). Such implementations are faster than their read-switch-loop counterparts, but still confound DynamoRIO since, once again, they often have a huge number of indirect jumps (at every byte code) relative to their execution time.
DynamoRIO often does a poor job of predicting these indirect jumps since they depend on the position of the interpreter in the high level program and not the
location of the indirect jump instructions in the interpreter's binary. Thus DynamoRIO has trouble generating good traces for interpreters to offer as targets of optimization. The
logical pc extension to DynamoRIO seeks to address the generation of poor traces by allowing the interpreter writer to pass some information about the high level position in the interpreted program to DynamoRIO at runtime. This allows DynamoRIO to build traces that reflect the high level program being interpreted. Such traces are much better
targets for optimization.
4.2
The Logical Program Counter Extension to DynamoRIO
The goal of the logical program counter [20] extension to DynamoRIO is to allow DynamoRIO to build long frequently executed traces that usually run almost all the way through and allow for good prediction of indirect jumps. To do this DynamoRIO asks the interpreter writer to associate some sort logical program counter with the interpreter's location in the interpreted program, typically an index or pointer (or combination of
pointers) into the byte code of the interpreted program. DynamoRIO also exports methods (see figure 4-1) to allow the program to keep DynamoRIO informed as to the value of the program counter at runtime.
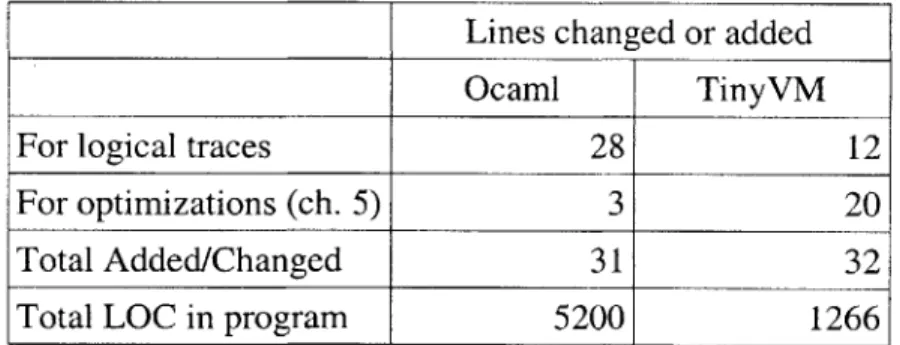
about the logical program counter is minimal and straightforward, typically requiring changes in just a few places. An excerpt of the TinyVM interpreter that shows the annotations applied in in Appendix 1. Often the change is largely search and replace on adjustments to a variable that indexes into the interpreters representation of the interpreted program, so the burden is even less than what a simple count of the number of lines of code changed or added would suggest (table 4.1).
Lines changed or added
Ocaml TinyVM
For logical traces 28 12
For optimizations (ch. 5) 3 20
Total Added/Changed 31 32
Total LOC in program 5200 1266
Table 4.1: Lines of code necessary to annotate an interpreter for DynamoRIO logical pc. This table counts the number of lines added to
or changed in the source code of the interpreter to work with DynamoRIO and to enable the optimizations described in chapter 5.
4.3 Benefits of the Logical Program Counter Extension
With information about the location of the interpreter in the interpreted program
DynamoRIO can build traces that reflect the behavior of the interpreted program instead of the interpreter. Such traces are much longer and have dramatically fewer early exits than the usual traces DynamoRIO would build. DynamoRIO does this by associating a logical program counter value, in addition to its usual application address value, with each trace. This allows DynamoRIO to have multiple traces representing the same application
void dynamoriosetlogicalpc(int logical-pc); void dynamoriologicaldirect-jump();
void dynamoriologicalindirect-jurp(;
Figure 4-1: The exported DynamoRIO logical program counter interface.
address, but different locations in the interpreted program. This leads to dramatically better traces (table 4.2, 4.3) and faster execution (see chapter 6). The logical pc extension to DynamoRIO also provides methods to signal to DynamoRIO that there is a branch of control flow (either direct or indirect, see figure 4-1, Appendix 1) in the interpreted program. DynamoRIO ends traces at such branches and marks their targets trace heads.
Trace Size Time Exit number Percent of (in bytes and percent of time exiting and exits) trace executed there
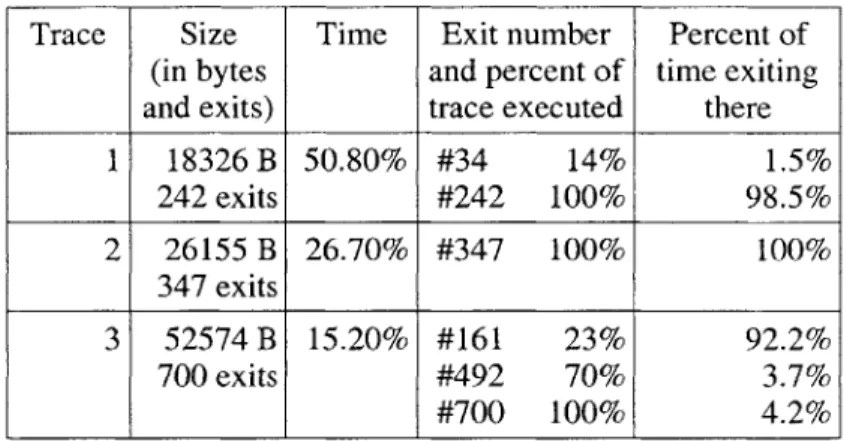
1 18326 B 50.80% #34 14% 1.5% 242 exits #242 100% 98.5% 2 26155 B 26.70% #347 100% 100% 347 exits 3 52574 B 15.20% #161 23% 92.2% 700 exits #492 70% 3.7% #700 100% 4.2%
Table 4.2: Trace sizes and trace exit distribution for top three, as measured by execution time, traces of the TinyVM program fib iter under DynamoRIO logical program counter. The exit number is a rough guide to how long execution stays on the trace since each exit corresponds to a branch. The higher the number the longer execution has stayed on the trace.
Trace Size Time Exit number Percent of (in bytes and percent of time exiting and exits) trace executed there
1 956 B 19.30% #1 10% 5.7% 10 exits #10 100% 94.3% 2 745 B 18.10% #5 63% 20% 8 exits #8 100% 80% 3 1219 B 6.7% #7 44% 1.6% 16 exits #16 100% 98.4%
Table 4.3: Trace sizes and trace exit distribution for the the top three traces, as measured by execution time, of the TinyVM program fibiter under plain DynamoRIO. The exit number is a rough guide
to how long execution stays on the trace since each exit corresponds to a branch. The higher the number the longer execution has stayed on the trace.
Chapter
5
Optimizing Interpreters with DynamoRIO
5.1 Overview of Optimizations
When an interpreter is running under DynamoRIO with logical program counter extensions long highly optimizable traces are created that dominate the execution time. This chapter describes four optimizations implemented to improve the performance of interpreters running under DynamoRIO with the logical program counter extension: constant propagation, dead code removal, call return matching, and stack cleanup. These optimizations are applied to traces generated by DynamoRIO in the following order, call return matching first, then constant propagation, then dead code removal, and finally stack cleanup. This ordering maximizes the synergy between the optimizations as the earlier optimizations often open up opportunities or remove barriers from the later optimizations. Chapter 6 gives performance results for applying these optimizations to several
interpreters.
Implementation of these optimizations was complicated by the complex machine model of the IA-32 instruction set. IA-32 is a complex instruction set (CISC) with hundreds of instructions, many of which are have to use particular registers or sets of registers and have side effects on the machine state. Instructions have from zero to eight sources and from zero to eight destinations. The architecture supplies only eight visible general purpose integer registers. Depending on the circumstances an instructions might
read or write the whole register or
just
the lower two bytes or just one of the lower two bytes (but only for four of the eight registers in the last case). Branching is handled by instructions that check the status of certain conditional flags. Almost every single arithmetic instructions (and some non-arithmetic) writes to some or all of the conditional flags (some read as well). Such conditional codes can be valid past multiple jumps or even used, in the case of some compliers, after a function return. This greatly complicates keeping track of dependencies between instructions. The optimizations described here take these issues into account.5.2
Constant Propagation Optimization
5.2.1 The Constant Propagation Annotation Interface
Constant propagation is a classic compiler optimization that partially evaluates instructions based on variables that are known to have a constant value. It is motivated especially with interpreters in this case because they tend to have large amounts data that are runtime constant. In many interpreters the byte code is constant, once generated at runtime it is never modified. In addition it is not uncommon for there to be jump and lookup tables that are constant at runtime whose location can be determined from the meta information in the applications binary. If it were possible for the interpreter writer to communicate this information to DynamoRIO, DynamoRIO would able to simplify traces by replacing native loads from this immutable constant value memory with the value they would return and simplifying the trace. To enable this, a method is exported to allow the interpreter author to mark regions of memory immutable (figure 5-1). An excerpt showing of how these annotation are used in the TinyVM interpreter is provided in Appendix 1.
void dynamorioset region_immutable(void* start, void* end); void dynamorioaddtraceconstantaddress (void* addr);
void dynamoriosettraceconstantstackaddress(void* addr, int
val);
void dynamoriounaliasedaddress(void *addr);
void dynamorio unaliasedstackaddress(void *addr); void dynamoriosetcallnoinline(void *funcptr);
Since execution time under DynamoRIO is dominated by traces, traces are the best place to concentrate optimization. All traces under DynamoRIO are tagged with a logical pc. Since DynamoRIO guarantees that at the start of the trace the logical pc is the same as the logical pc the trace is tagged with, this often implies that some of the
interpreters variables will also always be the same at the start of the trace. These are typically the variables used to generate the logical pc, such as an index or pointer into the byte code. While it isn't clear at compile time what value those variables might have, several methods are exported by DynamoRIO (figure 5-1) so that the interpreter writer can inform DynamoRIO that certain variables will always have the same value at the start of the trace. DynamoRIO can then take a snapshot of those values when it builds the trace and use the constant values to simplify the trace (figure 5-2).
The interpreter writer uses settraceconstantaddress to inform DynamoRIO of global addresses that at the start of a given trace is always the same, while he uses settraceconstantstackaddress to inform DynamoRIO of stack addresses that are always the same at the start of any particular trace. Since DynamoRIO keeps track of the values in these addresses as it constant propagates through out the trace, the interpreter writer is also guaranteeing to DynamoRIO that he won't modify these addresses through a pointer alias or another thread. This guarantee greatly simplifies the optimization and pass since it is difficult, if not impossible to disambiguate memory writes in assembly in the potential presence of aliasing. In fact, this information is so useful that several more methods are supplied to the interpreter writer to allow him to specify global and stack addresses that aren't aliased (figure 5-1).
5.2.2
Issues Considered
The system is limited to global, and stack addresses because they are the most common and because the runtime system has no notion of variable locations only addresses. These addresses then are easier for the runtime system to track since, given the non-aliasing guarantee, the addresses will be accessed consistently, the globals as constant addresses and the stack addresses as offsets of the ebp or esp stack registers.
the one for globals is preferred. The actual method to mark the global address unaliased or trace start constant need only be run once during startup or initialization. For stack
addresses though the picture is more complicated since the address of the trace start constant value might not itself be constant. For stack addresses the call to the
dynamorio settraceconstantstackaddress must appear in the trace and the
optimizations using its value will only be performed in the section of the trace that follows the call. This is because the optimizations needs to destruct the arguments of the call to figure out the offset off the stack or base pointer of the address (figure 5-2). This means that the stack address method calls should appear shortly after each logical direct or logical indirect jump so that they will be close to the top of the trace. The interpreter writer should also avoid declaring to many stack addresses unaliased unless he is reasonably sure this will enable optimization as the calls for stack addresses appear very frequently and thus can add to the overhead of the system.
5.2.3
Operation
The constant propagation optimization is single forward pass through the trace that keeps track of constant values in the eight architectural registers and their sub register
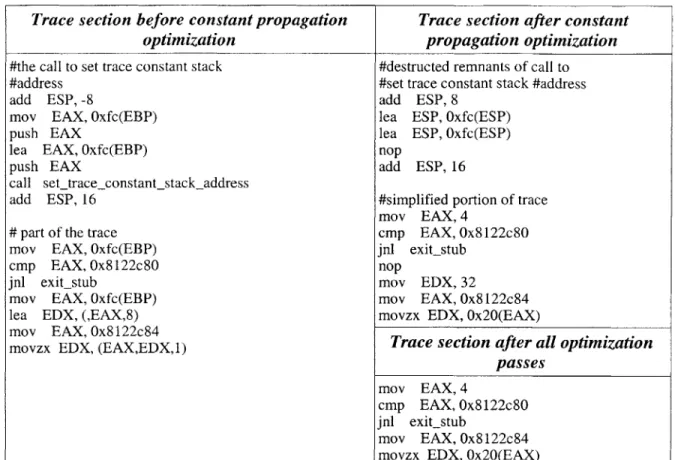
components as well as memory locations declared to be unaliased by the interpreter writer and the state of the eflags register. At each instruction constant values are propagated into the sources (including the eflags register for branches and addresses descriptions in the destinations) and the instruction is simplified as much as possible. If any sources simplify to a constant address, the optimization checks to see if the address is in one that was declared immutable by the interpreter or the binaries meta-data. If so it replaces the address load with the value it gets by dereferencing the address. The simplification is often able to reduce instructions to just load immediates or, in the case of simplified branches, nops. Once simplification of the instruction is finished destinations written to by the instruction with a non constant value are marked as not constant and those written with a constant value have their now constant value stored for future use.
Trace section before constant propagation optimization
#the call to set trace constant stack #address
add ESP,-8
mov EAX, Oxfc(EBP)
push EAX
lea EAX, Oxfc(EBP) push EAX
call settraceconstantstackaddress add ESP, 16
# part of the trace
mov EAX, Oxfc(EBP)
cmp EAX, Ox8122c80 jnl exit-stub
mov EAX, Oxfc(EBP)
lea EDX, (,EAX,8) mov EAX, Ox8122c84
movzx EDX, (EAX,EDX,1)
Trace section after constant propagation optimization
#destructed remnants of call to #set trace constant stack #address add ESP, 8
lea ESP, Oxfc(ESP) lea ESP, Oxfc(ESP) nop
add ESP, 16
#simplified portion of trace mov EAX, 4
cmp EAX, Ox8122c80 jnl exitstub
nop
mov EDX, 32
mov EAX, Ox8122c84 movzx EDX, Ox20(EAX)
Trace section after all optimization passes
mov EAX, 4
cmp EAX, Ox8122c80 jnl exitstub
mov EAX, 0x8122c84
movzx EDX, Ox20(EAX)
Figure 5-2: Trace selection demonstrating constant propagation optimization and the trace constant interface. Here the address Oxfc(EBP) is the stack constant address and its value at the start of the trace is always 4. The optimization will deduce the offset of EBP
by looking for the lea the set the argument or something equivalent. It will then eliminate
the call and propagate as normal.
The optimization also keeps track of the depth of the current call frame since recognized offsets for the unaliased stack addresses are only valid in the same scope as the method call that informed DynamoRIO of them. As an extra bit of optimization, if a mov
immediate instruction (perhaps as the result of simplification) is setting a watched location (register, unaliased memory locations) to the same constant value its known to have then the mov immediate instruction is eliminated.
Some dynamic languages allow the byte code to be modified as they run and, since DynamoRIO optimizes assuming this memory is constant (assuming the interpreter writer marked it as such), an additional method to allow the interpreter writer to declare a region no longer immutable is planned, though not yet implemented. When this method is
called DynamoRIO will delete all the traces from its cache that relied on the now mutable data, thus preserving correctness. If the region is frequently executed it will end up being traced again into a new trace.
Original Application DynamoRIO DynamoRIO wicall return
matching
mov EAX, EAX Trace 0 Trace 0
call foo mov EAX, EAX mov EAX, EAX
bar: # -- call # -- call
lea OxO(ESI), ESI push $bar push $bar
jne done
foo: xchg EDI, EDI xchg EDI, EDI
...
# -- ret
xchg EDI, EDI mov ECX, spill_slot # -- ret
ret pop ECX lea 0x4(ESP), ESP
lea -$bar(ECX), ECX
jecxz hit-path lea OxO(ESI), ESI
fail-path: jne exitstub 1<done>
lea $bar(ECX), ECX
jmp indirect-lookup
hit-path:
mov spill-slot, ECX
lea OxO(ESI), ESI jne exit-stub1 <done>
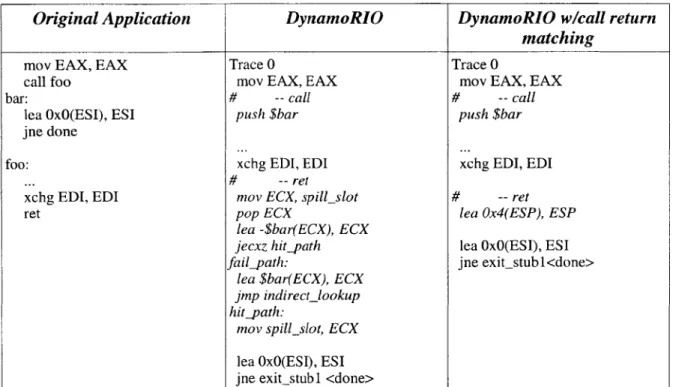
Figure 5-3: A sample trace, with the original application code, before and after the call return matching optimization. In italics is the code DynamoRIO used to replace the call and ret instructions. Lea instructions are used to preserve the eflags state.
5.3
Dead Code Removal Optimization
Dead code removal is another classic compiler optimization. Dead code removal eliminates instructions that don't produce useful values. It runs a single backwards pass keeping liveness information on the registers, sub registers, eflags register, and unaliased stack and memory addresses passed in by the interpreter writer (like in constant prop above). While complicated by the need to deal with partial registers operations, sub register state, and the eflags register, the algorithm is essentially the same as found in most compiler textbooks.
5.4
Call Return Matching Optimization
The call return matching optimization is a general optimization that requires no
annotations from the interpreter writer. It looks for methods that have been completely inlined into a trace such that both the call instruction and the return instruction from the method are in the trace. It then partially inlines the method by eliminating the check
around the return. Under DynamoRIO calls are replaced with push immediates of the applications return address and returns are replaced with a hash table lookup for address translation with a check for the target used to continue the trace inlined (figure 5-3). The main benefit of this optimization is to remove the cost of doing the check to see that continuing on the trace is indeed the right thing to do.
5.5
Stack Adjust Optimization
The stack adjust optimization is a general optimization that requires no annotations from the interpreter writer. Its effectiveness comes from noticing that often many extraneous adjustments of the stack pointer are left after the other optimizations have run. These can be folded together if one is careful about the intervening instructions. Also building traces exposes other situations where stack pointer manipulations can be eliminated or combined.
Original trace Trace after stack adjustment
optimization
sub ESP, $8 sub ESP, $12 sub ESP, $8 mov EAX, EAX mov EAX, EAX push ESP
add ESP, $4 sub ESP,$8
push ESP mov EAX, Ox4(EDX)
sub ESP, $12 add ESP, $8
mov EAX, EAX ...
add ESP, $4
mov EAX, Ox4(EDX) add ESP, $8
Figure 5-4: A trace before and after the stack adjust optimization. Note that at any point in the trace the stack pointer will be at least as low in memory (high in the stack) as it was in the original program to protect potential aliased stack writes.
The stack cleanup optimization does a single forward pass through the trace looking for adjustments to the stack pointer and folding them together into a single
adjustment. If it sees a memory write or read not that's not to a constant address or relative to the stack pointer, such as the write to 0x4(EDX) in figure 5-4, it makes sure that the stack pointer is at least as low (IA-32 stack grows down in memory) in the optimized version as it was in the original version at that instruction. This is in case the memory write is really an aliased stack write. Since the operating system can come along at any time and interrupt the application and use its stack (and some operating systems do) it is important that the stack pointer is low enough at the memory write to protect its value in case the operating system interrupts.
Chapter 6
Performance of DynamoRIO Optimized
Interpreters
6.1 Introduction to the Interpreters
In this section the performance improvements of the optimizations described in chapter 5
are demonstrated on two interpreters that have been annotated to run under DynamoRIO's logical pc extension and to enable the optimizations described in Chapter 5. TinyVM is a very simple virtual machine written C that interprets TinyVM byte code. TinyVM has a simple stack based machine model. Its byte code is generated from a higher level
language by a TinyVm compiler. Its virtual machine uses a simple read-switch-loop structure to interpret each byte code and update the state of the virtual machine. Ocaml is a high performance, highly optimized, popular implementation of the caml language that includes a threaded interpreter, a non-threaded interpreter, and a native compiler. Caml is a strongly typed functional programming language related to ML. It is frequently used by some of the top teams at the annual IFCP programming contest including the winning team from 2002, third place team from 2001, and second and third place team in 2000. Both Ocaml and TinyVM show large speed improvement when run under DynamoRIO and the optimizations described in chapter 5.
TinyVM Performance
E
Native EDynamorioEl DynamoRIO + Logical DynamoRIO + Logical
1.6 PC PC + opimization -1.5 1.4 -- -1.3 --- - 1.2-1.1 1 - 0.9- 0.8-0.7- -7 0.6- 0.5- 0.4- 0.3-0.2 ---0.1 --
0.-Fib iter Fib rec Bubble Matrix Matrix Sieve Sieve
Sort large small small
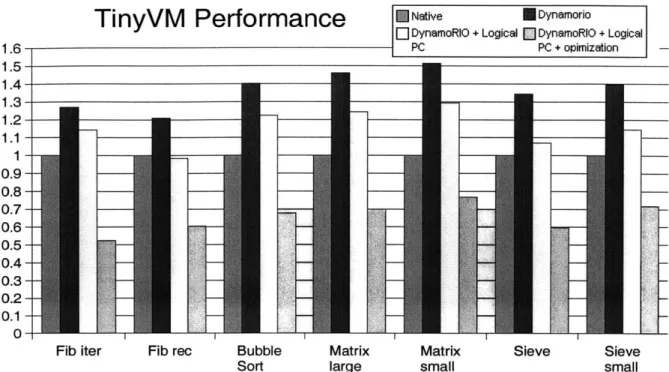
Figure 6-1: Performance of the TinyVM interpreter on various benchmarks. Each benchmark was run three times for each configuration, the best result is shown. Test machine was a 2.2 ghz Pentium IV processor running Linux. The interpreter and DynamoRIO were both compiled under GCC. Results are normalized to the native execution time.
6.2 TinyVM Interpreter
A number of small computationally intensive benchmarks were chosen to test the optimizations on the TinyVM compiler. These are for the most part implementations of simple algorithms, fib iter iteratively generates Fibonacci numbers while fib rec does the same recursively. The sieve programs find prime numbers through a Sieve of
Eratosthenes algorithm. Finally the matrix programs do some repeated matrix
multiplication. These programs have tunable input parameters to control the length of the execution time. Suitable values were chosen to give a relatively lengthy run in most cases, though some are shorter. This gives a better idea of the steady state improvement the optimizations produce. Table 6-1 gives the running time in seconds of each of the optimizations. For the TinyVM benchmarks here the optimizations are capable of
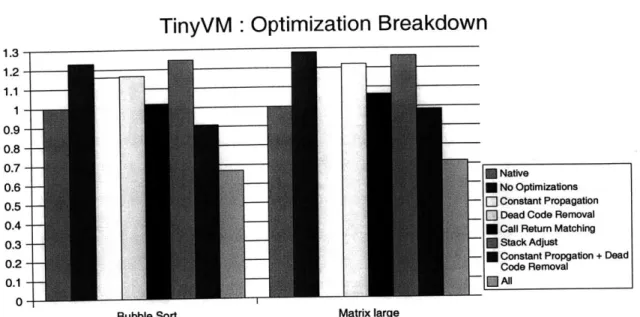
reducing the runtime of the interpreted program by 20 to 50 percent. A breakdown of the contribution of the various optimizations towards the systems performance is provided in
TinyVM: Optimization Breakdown
~IJTiza
0
-Bubble Sort Matrix large
Figure 6-2: Breakdown of the contribution of the various optimizations for select programs on TinyVM. Note that there is a large synergistic effect from combining multiple optimizations. This is becuse of their complimentary nature, some enable greater possibilities in the others.
figure 6-2. This graph demonstrates that optimizations are largely complimentary. They tend to open up opportunities for each other and as such the best result comes from combining them together.
TinyVM Native Optimized
Benchmarks Running Running
Time in sec. Time in sec.
Fib iter 26.73 14 Fib rec 35.52 21.49 Bubble Sort 23.36 15.82 Matrix 1g. 28.00 19.59 Matrix sm. 3.78 2.9 Sieve 26.84 161 Sieve sm. 4.44 3.181 Table 6.1: Execution time in seconds of the TinyVM benchmarks, both natively and under DynamoRIO with optimizations.
Ocaml Native Optimized
Benchmarks Running Running
Time in sec. Time in sec.
Ackermann 27.2 20.3 Fib 12.45 9.9 Hash2 5.17 3.03 Heapsort 11.09 9.09 Matrix 10.62 8.41 Nested Loop 15.1 6.18 Sieve 6.07 4.68 Tak 7.38 4.97
Table 6.2: Execution time in seconds of the Ocaml benchmarks, both natively and fully optimized. 1.3- 1.2-1.1 -0.7 -0.6 -0.5 -0.4 -0.3 -0.2 -0.1 -Native * No Optlmizations E] Constant Propagation Dead Code Removal Call Return Matching Stack Adjust
Constant Propgation + Dead Code Removal
Ocaml Performance
1.41.3 - 1.2- 1.1H- 0.9- 0.8- 0.7- 0.6- 0.5- 0.4- 0.3- 0.2-0.1 - 0- Ack- er-Hash2DynamoRIO + Logical PC
L]
Native DynamoRIO + Logical PC + [ Compiled-optimizations
Heapsort Matrix Nested
loop Sieve
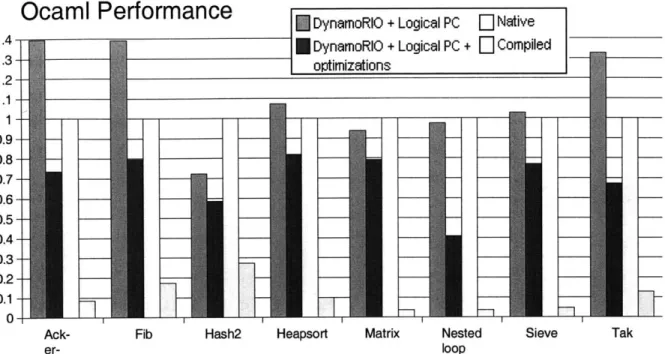
Figure 6-3: Performance of optimizations relative to native execution and compilation on Ocaml. Each test was run three times and the best results are shown here. Tests were run on a 2.2ghz Intel xeon processor running Linux. Time was measured with the time command. All results are normalized to native interpreter execution time.
6.3 Ocaml Interpreter
While TinyVM is largely a toy system, Ocaml is a widely used high performance
language. It supports numerous architectures including IA-32, which it supports with both an interpreter and a native compiler. The performance of natively compiled Ocaml code often rivals that of C. The numbers above reflect the performance of the threaded version of the Ocaml interpreter (which is faster than the switch dispatch non-threaded version). The benchmarks are a selection of computationally intensive programs adapted from Doug
Bagely's Great Computer Language Shootout2 with inputs chosen to give running times in
4 to 40 second range for the native interpreter 6-2. We again see large improvements over the natively running interpreter with gains of 20 to 60 percent. While still quite short of the performance of compiled Ocaml, the optimizations do go a log way towards limiting the interpreting overhead.
2 http://www.bagley.org/-doug/shootout/ Fib
---Tak
I
Chapter 7
DynamoRIO as an IA32 Accelerator for the
Itanium Processor
7.1 Motivation for an IA-32 Accelerator for Itanium
The IA-64 ISA is based on the EPIC (Explicitly Parallel Instruction Computing)
technology jointly developed by Intel and Hewlett-Packard to address current roadblocks towards fast microprocessor performance. Current state of the art processors achieve high performance not just by executing instructions very fast (using deeply pipelined
architectures), but by also finding groups of instructions to execute in parallel over multiple functional units (super scaler processors). Performance is thus limited by the
ability of the compiler to expose instruction level parallelism and the processor's ability to recognize it. Performance is also limited by load and delays and branch mis prediction penalties. To address these issues EPIC technology offers a number of techniques not found in the IA-32 architecture including explicit compiler mediated expressions of instruction parallelism to increase instruction level parallelism visible to the processor, a
vastly larger register set to avoid false dependencies, general predication of instructions to eliminate branches, and explicit memory load speculation to better hide memory
Because the IA-32 architectural register set is very limited in size and lacks a means of general predication, it is difficult for super scaler IA-32 processors to find enough instruction level parallelism to fill their functional units, even with extensive compiler help. Thus, IA-32 processors have embraced fast clock speeds and deep
pipelines as ways of improving performance. This poses a problem for Itanium processor as the current state of the art Itanium 2 processor runs at about a third the clock speed of the current state of the art IA-32 Pentium IV processor. This means that for comparable performance the Itanium processor must execute the equivalent of three times as many IA-32 instructions every clock cycle as a Pentium IV.
Instructions in the IA-64 ISA are grouped together into bundles. Each bundle contains three 41 bit instruction slots and a 5 bit template slot. The template informs the chip to which type of functional unit (there are four, integer, memory, branch, and floating point) to dispatch each of the instruction slots to. This is necessary because opcodes are reused between the different functional units. The template also encodes the location of any stops. Stops are how the compiler signals to the processor which instructions can be executed in parallel. Instructions not separated by a stop can be executed in parallel. Up to two full bundles comprising six instructions can be executed by the Itanium every clock cycle, each stop, however represents a break that requires all the following instructions to wait for the next clock cycle.
Though the Itanium has the functional unit resources to execute IA-32 code very fast, it is difficult for it do so. The hardware needed to execute IA-32 code efficiently is not a subset of the hardware needed for IA-64 execution. Efficient IA-32 execution requires large amounts of register renaming and out of order speculation hardware both of which are, by design, not used in IA-64 processors. The inclusion of this extra hardware into Itanium processors increases the die size and complicates on chip routing, both of which increase the cost of the final chip. Because of the huge differences in basic design between IA-32 and IA-64 instructions sets it's very difficult to achieve high performance in both with a single chip hardware based solution. Thus Itanium's hardware IA-32 solution is likely never to give performance competitive with pure IA-32 processors.
speed. This is difficult with an IA-32 binary since IA-32 code tends to be heavily serialized due to the very limited number of registers which leads to heavy register reuse and frequent spilling to stack memory. This is where dynamic optimization and
translation can help. Runtime profiling can ensure that only frequently executed sections of the code are translated and allow the translations to be specific to the most common control flow paths. Unfortunately, efficient software emulation of the IA-32 ISA is notoriously difficult due to the large number of complex instructions and complex
machine state model. Here matters are helped by the Itanium's hardware support of IA-32 and support for mixed mode execution. With this, a dynamic optimizer such as
DynamoRIO, which naturally gathers a degree of profiling data as part of the tracing algorithm used amortize its own overhead, can focus its efforts on translating only the most frequently executed instructions, leaving complex, hard to translate, and infrequently executed instructions to the hardware. Since only unusual, hard to handle and presumably rare instructions and situations are left for the hardware to handle, it's acceptable if its IA-32 support is slow and relatively inefficient. This should allow for a solution that takes up much less die space, reduces complexity, and gives better performance. Since the hardware translation is restricted in terms of available time, resources, and visibility,
software translation of the most frequently executed regions has the potential to greatly increase execution speed by taking advantage of features found in the IA-64 ISA but not the IA-32 ISA such as predication, large register sets, and speculative loads. While binary translation could be done statically, the profile information will not be available, or given profiling runs will be of much lesser quality. Since accurate profiling information is necessary to make full use of the predication and static scheduling found in the IA-64 ISA
, this argues for doing the translations dynamically at runtime.
7.2
Implementation of the IA-32 Accelerator
The Itanium processor has direct support for transitioning between IA-32 execution and IA-64 execution modes through the jmpe extension to the IA-32 ISA and the br.ia
IA-64 mode, the IA-32 machine state remains visible and modifiable in a subset of the IA-64 state. For example, IA-32 register eax becomes IA-64 register 8. Experimentally, the cost of switching modes is on the order of about 240 cycles for a round trip on an Itanium 1 processor. The operating system (if running in IA-64 mode) can choose whether or not to allow an application to switch between IA-32 and IA-64 through a flag in the processor status register. Attempting to transition between the two instruction sets when the flag is set cause an execution. Support for both instruction sets is needed in a dynamic partial translation system such as described in this thesis.
Since DynamoRIO already supported all of the IA-32 ISA only the jmpe extensions needed to be added for Itanium support. The jmpe instruction comes in two forms : register indirect and absolute. Both forms put a return address in the first general purpose register and switch into IA-64 execution mode starting at the instruction bundle targeted by the jmpe. The indirect form was a fairly straightforward extension to 's system, but the jmpe absolute form was slightly more difficult since it uses a unique addressing. Unlike most call, jmp, and branch instructions it uses and absolute address instead of program counter relative offset, yet at the same time it doesn't use a segment register as its base unlike far pointer calls and jmps. No other IA-32 instructions have the same addressing mode. For the IA-64 side and emitting library, sans an instruction representation, was obtained from Intel for use in generating IA-64 instructions and modified for use from within DynamoRIO.
The IA-32 accelerator for Itanium processors described below translates all traces into Itanium native IA-64 instructions. Thus it prevents DynamoRIO from tracing through a location it will be unable to translate or from starting a trace on a block that will be difficult to translate because of incoming eflags dependencies. When given a trace to translate, the IA-32 accelerator generates two traces: one in IA-64 and one in IA-32. The IA-64 trace does all the computation in the trace and is emitted to a separate buffer. The IA-32 trace is really a stripped down stub consisting of a jmpe instruction to the IA-64 trace and a series of jump instructions (one for each exit of the trace) that are target exits in the IA-64 trace that aren't linked (figure 7-1). This allows the leveraging of DynamoRIO's linking and cache management routines.
Original Trace Translated Traces
IA-32
foo:
add EAX, 4 mov EBX, (EAX) cmp EBX, 0 je exitstubi add EDX, EAX mov ECX, (EBX) cmp ECX, 1 jne exitstub2 jmp exitstub3 <target bar> <target bar2> <target foo> IA-32 section jmpe ia64_start trace: jmp exitstubi <target jmp exitstub2 <target jmp exitstub3 <target bar1> bar2> foo> IA-64 section
(unbundled, unoptimized, with last branch linked) ia64_exit: br.ia bl ia64_prefix: movl rl = &trace ia64_start: adds r8 = 4, r8 ld4 r1l = [r8] cmp4.eq p2,p3 = 0, r1l (p3) adds rl 5, rl (p2) mov bl rl (p2) br ia64_exit
add r1O = r1O, r8
ld4 r9 = [r11] cmp4.eq p2,p3 = 1, r9 (p3) adds rl = 5, rl (p2) mov bl = rl (p2) br ia64_exit adds rl = -10, rl br ia64_start
Figure 7-1: Sample trace translated into IA-64. Note that EAX = r8, EBX = r]1, ECX = r9, and EDX = riO. Also note that the jmp instructions in the IA-32 section of the translated trace are 5 bytes long, hence the 5 byte increments of ri to advance to the next exit.
When an IA-64 trace is reached through the jmpe instruction in its corresponding IA-32 trace it gets, as a sideffect of the jmpe instruction, a pointer the instruction immediately following the jmpe placed in register 1. This register is used by
![Figure 3.]: Diagram of DynamoRf 0 structure. Dark areas are cached application code. Gray areas are DynamoRlO code](https://thumb-eu.123doks.com/thumbv2/123doknet/14754302.581747/22.918.206.739.682.904/figure-diagram-dynamorf-structure-dark-cached-application-dynamorlo.webp)