Ecological insights from bacterial networks
Mark Burnham Smith MASSACHUSETTS INSTrTUTE OF TECHNOLOGY A.B. Ecology and Evolutionary Biology
Princeton University, 2009
EZU
I
2014
LIBRARIES
SUBMITTED TO THE MICROBIOLOGY GRADUATE PROGRAM IN PARTIAL FULFILLMENT OF THE REQUIREMENTS FOR THE DEGREE OF
DOCTOR OF PHILOSOPHY IN MICROBIOLOGY
AT THE
MASSACHUSETTS INSTITUTE OF TECHNOLOGY
September 2014
C 2014 Massachusetts Institute of Technology
All rights reserved
Signature redacted
Signature of Author:... ...
Mark Burnham Smith Microbiology Graduate Program
Signature redacted
C ertified by :... ...
Eric J. Alm Associate Professor of Biological Engineering Thesis Supervisor
Signature redacted
A ccepted by:... ...
Michael T. Laub Associate Professor of Biology Chair, Microbiology Graduate Program
Ecological insights from bacterial networks Mark Burnham Smith
Submitted to the Microbiology Graduate Program on August 28, 2014 in Partial Fulfillment of the Requirements for the Degree of
Doctor of Philosophy in Microbiology
ABSTRACT
Microbes occupy a wide range of important niches ranging from global biogeochemical cycles to metabolism in the human gut. Yet microbes rarely act in isolation. Instead, they thrive in complex communities with myriad combinatorial interactions. In this work I explore the nature of these bacterial networks, using computational tools to uncover ecological associations with relevance to both human health and environmental restoration.
I begin with the discovery of a massive, global network of recent gene exchange linking even distantly related bacteria from the far corners of earth. To uncover this network, I developed and validated a simple evolutionary rate heuristic and applied it to report recent transfers across nearly 5 million pairwise interactions among bacterial genomes. I interrogated this network for associations between rates of horizontal gene transfer
(HGT) and differences in the geography, ecology and phylogenetic history of each pair of
genomes. Of these influences, ecological overlap is the most important force shaping recent gene exchange.
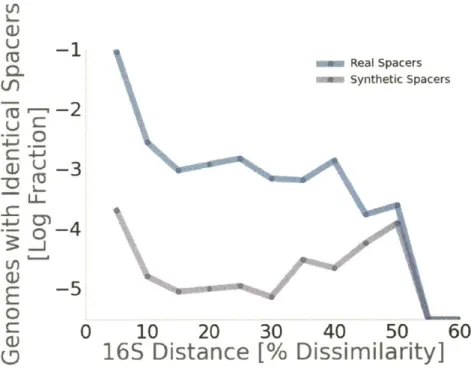
In the second chapter, I use CRISPR arrays as a record of recent infections to investigate the host range of mobile genetic elements. I report 7,009 pairs of genomes that contain identical spacers and are at least 10% divergent at the 16S rRNA gene, implying an overlap in genetic element host range. This provides a mechanistic framework to understand the transfers uncovered in the first chapter.
In the final section of this work, I exploit this powerful link between bacterial communities and their environments to create a machine-Iearning'algorithm that
translates DNA from natural bacterial communities into accurate, 4uantitative readouts of environmental conditions. I develop this approach using 16S rRNA sequence data from
93 groundwater wells in Oak Ridge, Tennessee to predict a diverse array of 26
geochemical measurements. I validate this technique using microarray data from the Deepwater Horizon oil spill. The predictive power of these models generally emerges from the composite of the entire community and its interactions, rather than from a single strain. As a whole, this body of work demonstrates the profound connections that link the microbial world into an ecologically structured network.
Thesis Supervisor: Eric J. Alm
Table of Contents
Title Page 1 Abstract 2 Table of Contents 3 Acknowledgements 4 Personal Context 6 Introduction 7Chapter 1: Ecology drives a global network of gene exchange connecting the human
microbiome 11
1.1 Abstract 11
1.2 Main Text 12
1.3 Methods 18
1.4 Figures- 26
1.5 Supplemental Figures and Tables 30
Chapter 2: Identical CRISPR spacers among distantly related bacteria reveal common
strategies to target promiscuous mobile elements. 37
2.1 Abstract 37
2.2 Main Text 38
2.3 Methods 43
2.4 Figures 44
Chapter 3: Natural bacterial communities as quantitative biosensors 48
3.1 Abstract 48
3.2 Main Text 48
3.3 Methods 57
3.4 Figures 73
3.5 Supplemental Figures and Tables 77
Conclusions and future directions 87
Bibliography 93
Acknowledgements
I would like to gratefully acknowledge the invaluable advice and support of Eric Alm, my thesis supervisor and mentor. Eric has taught me how to identify interesting scientific problems, solve them and effectively share and apply the results. He has also become a great friend, personal trainer and adventure racing teammate. I would also like to recognize the mentorship and guidance of my thesis advisory committee members, Martin Polz, Ed Delong and Terry Hazen.
I am deeply grateful to the National Science Foundation for supporting my studies through a Graduate Research Fellowship. I am also thankful to the Martin Family Foundation for supporting my work through the Martin Fellowship and to BP for
supporting me as an MITEI Energy Fellow. In addition to these fellowships, I would like to specially acknowledge the support provided by the Department of Energy ENIGMA program and the entire ENIGMA team for enabling the work presented in Chapters 2 and
3. I am also deeply grateful to the MIT Microbiology program (and it's wonderful
students, faculty and staff) for supporting me throughout my time at MIT.
In addition to this formal support, I am deeply appreciative of the many contributions made by the Alm Lab and Parsons's community both directly to this work as described below and more generally to my development as a scientist and a human. Among this community, I am particularly grateful to Chris Smillie, who made numerous important contributions both to the works presented here and to many other projects beyond this dissertation. Specifically, as the co-author of the manuscript presented in Chapter 1, Chris and I worked together to develop and implement the evolutionary rate heuristic that we employed to discover and analyze recent horizontal gene transfer events. Chris also taught me many of the basic principles of machine learning and developed our lab's
code-base for working with Random forest, which I extended to classify environmental contaminants in Chapter 3. Chris has been a great collaborator and friend, always happy to meet up for a late-night brainstorm, embark on an ill-conceived outdoor adventure or
University of Tennessee and Oak Ridge National Laboratory field teams that collected all of the data that I have analyzed in Chapter 3.
Perhaps the most important contribution to this work comes from my family and
particularly, my parents who always found time to engage with my curiosity growing up.
I would also like to thank Carolyn for tolerating unreasonably frequent fecal-based
conversations and supporting my passions, even when they lead in unorthodox and surprising directions. Finally, I would like to dedicate this work to the memory of Margaret Burnham, an educator, researcher, inspiration and my grandmother.
Personal Context
While I was interviewing for graduate school in 2009, I attended a lecture at Berkeley in which the super-exponential decline in the cost of genome sequencing was first presented to me. The presenter suggested that increasingly accessible molecular tools could be used to re-evaluate many commonly held dogmas in microbiology.
At the time, my experience as a field ecologist at Princeton had taken me from the boreal and mixed forests of Northern Wisconsin to the tropical dry forests of Panama to
investigate the relationship between the structure and diversity of forest communities and their underlying environmental constraints, a theme that I will revisit in this work. I found myself fascinated by the questions of ecology and evolutionary biology but challenged by the laborious methods required to generate even poorly constrained models. During my junior year at Princeton, I shifted my focus to experimental microbiology, where I
enjoyed the rapid progress possible through work with microbial systems. This experience drew me towards graduate studies in Microbiology.
At MIT, I rotated through traditional experimental microbiology labs before arriving in the Alm lab to finally explore the vague promise of next-generation sequencing, which
was still entirely new to me. I quickly realized that genomics offered even richer data than experimental work and immersed myself in the computational tools needed to take advantage of this new data source. Each transition from the field to the lab to
computation was motivated by my interest in finding richer data to interrogate the basic principles of ecology and evolution. Although each of these transitions required
significant investments in new skills, I gained a deep appreciation for the value and basic methodologies of each domain during this journey. This experience has enabled me to effectively collaborate across traditional methodological lines as demonstrated by this work.
Introduction
Much of the early work in genomics focused on the analysis of single genomes
(Himmelreich et al. 1996; Blattner et al. 1997; McClelland et al. 2001) with later efforts using comparative approaches to interrogate gene function or evolutionary history (Makarova et al. 1999; Arigoni et al. 1998; Koonin, Aravind, and Kondrashov 2000). However, given the emerging view of bacterial communities as complex interacting networks (Miller and Bassler 2001; Dubey and Ben-Yehuda 2011), this work seeks to develop genomic approaches to search for evidence of these interactions and the rules that govern them.
Horizontal gene transfer is a particularly attractive interaction to study, both because of its importance in bacterial evolution and because it leaves a detectable signature in affected genomes. HGT enables bacteria to rapidly adapt to changing environments, tapping a broad pool of potentially useful elements. Evidence from resequencing of epidemic strains suggests that HGT enables much more rapid and widespread evolutionary plasticity than mutations (Garg et al. 2003). Examining the process and product of gene acquisition provides insight into the nature of bacterial evolution. HGT is also a favorable process to study because it leaves clear imprints on the genomes
involved, making it practically tractable for investigation.
Prior to this work, HGT has been widely studied as a driver of bacterial evolution. However, this earlier work primarily focused on HGT as a historical event rather than an ongoing process (Ochman, Lawrence, and Groisman 2000; Thomas and Nielsen 2005; Gogarten and Townsend 2005; David and Alm 2011). In the first chapter of this thesis I present results from the analysis of recent horizontal gene transfer events. Unlike
historical transfers, the environmental and in some cases, geographical associations of the genomes involved in these cases have been preserved. As a result, with this approach it is possible to evaluate the relative impact of phylogenetic history, ecological similarity and geographical proximity on the frequency of gene transfers.
To facilitate these comparisons, I examine nearly 5 million pairs of genome interactions and find over 10,000 unique genes that are transferred. Across this network, I find that ecology is the dominant force shaping recent gene transfers, with 25-fold more HGT among human-associated isolates than among diverse non-human strains. More narrowly defined niches such as shared sub body-site, oxygen tolerance or pathogenicity are further enriched in transfer. I suggest that although there are likely more opportunities for
HGT among microbes residing in similar environments, because the strains considered in
this analysis are drawn from around the world, the dominant effect is likely caused by positive selection. Bacteria occupying similar niches are most likely to share overlapping selective pressures, causing the proliferation of mutually useful genes that happen to be transferred. Functional analysis of genes transferred among distantly related bacteria occupying the same niches (like association with meningitis) supports this view as many of these transferred genes are known to play important roles in the niches they are associated with (such as virulence). By developing, validating and applying a new
evolutionary rate heuristic for identifying recent HGT, I uncovered a massive network of gene transfer that provides an imprint of recent ecological interactions.
In chapter one, I reveal a massive network of recent gene exchange among distantly related bacteria. This surprising observation suggests that the prevailing dogma about the narrow host range of most mobile genetic elements (MGE) could understate the
promiscuity of phage and plasmids. To further investigate this question, in the second chapter, I use CRISPR arrays to probe the host range of MGE.
The inherent difficulty and limitations of culture-based assays have been one of the great challenges constraining traditional efforts to probe the host range of mobile genetic elements. With 10.1 million pairwise comparisons available from sequenced genomes that contain CRISPR, next-generation sequencing has opened up a new opportunity for systematic analysis of MGE host-ranges using comparative genomics. In this chapter, I perform a systematic search for evidence of broad-host range elements in CRISPR arrays.
I find 7,009 examples of distantly related genomes (>10% 16S rRNA divergence) that
identical spacers also contain identical repeats, suggesting that HGT of entire CRISPR arrays is the primary explanation for shared spacers. Spacers shared across genomes are four and three times more likely than unique spacers are to be found in phage and plasmid databases respectively. This suggests that shared CRISPR spacers may reflect selection to target especially common components of MGE. Although the genes targeted
by CRISPR may travel independently from the MGE being targeted, the observation of
identical spacers provides further evidence to support a broad host range for MGE, consistent with the observation of rampant HGT presented in the first chapter.
In the first chapter I use environmental associations to explain bacterial interactions. In the final chapter, I explore the inverse relationship, using bacterial interactions to make inferences about the environment. I apply machine-learning tools to predict a variety of environmental features using 16S rRNA sequence data to reconstruct bacterial networks.
By training statistical models on samples across contaminated field sites, I am able to
create robust predictors of environmental contaminants at these sites. I present this approach as an indigenous biosensor that can use bacteria as a ubiquitous environmental monitoring system to detect changes in the environment.
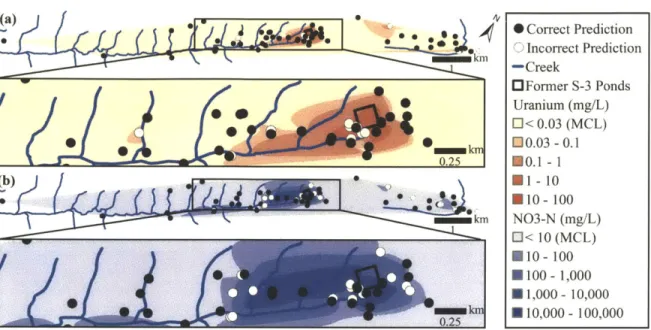
I develop this approach using field and sequence data collected at a nuclear weapons site
in Oak Ridge, Tennessee that covers extreme geochemical gradients. As part of a broad collaborative effort, I directed the site selection to maximize the diversity of sampled wells in order to best inform the downstream statistical modeling of these systems. I developed models that are able to both distinguish between sites that are contaminated with the two most common pollutants at the site (uranium and nitrate) and that can quantitatively predict the value for a range of 26 geochemical measurements collected at this site.
To determine how general this approach might be, I extend this analysis to data collected from the Deepwater Horizon oil spill in 2010. In this case I use 16S rRNA data to predict which sites are contaminated by oil and which are not. To demonstrate the portability of this approach, I use a 16S rRNA microarray as an orthogonal DNA measurement
technology. I find that I am able to create a nearly perfect classifier for oil contamination. Interestingly, when I extend this approach to sites that were sampled after the oil was degraded, these sites are accurately classified as oil contaminated, suggesting that bacterial communities contain a measurable signature of previous environmental
exposures. Although in most cases, the predictive power of this approach emerges from a composite view of the entire community and its interactions, in this extreme case of oil degradation, I show that even the abundance of single strains are sufficient to distinguish between contaminated and uncontaminated sites. This is likely due to the powerful
selection exerted by the influx of a rich carbon source into an otherwise oligotrophic environment. I conclude this chapter by discussing the potential future applications of this approach, which uses bacterial networks to report environmental conditions.
As a whole, this work demonstrates the myriad connections that link bacterial networks into ecologically informative systems. I have used a wide array of computational tools to analyze molecular data captured from a wide range of environments around the world in this work. However, these disparate methods and sites are unified by the underlying theme of exploring connections among bacteria and between bacteria and their environments. This work sheds new light on the depth of these interactions (chapter three) and the evolutionary mechanisms that tie bacterial networks together (chapters one and two). With the increasingly widespread availability of rich genomic data, I expect that future work will continue to use the principles of comparative genomic and meta-genomic analyses presented here to further probe the nature of bacterial networks.
Chapter 1: Ecology drives a global network of gene exchange
connecting the human microbiome
Smillie CS*-, Smith MB*, Friedman J, Cordero OX, David LJ, Alm EJ (2011) Ecology drives a global network of gene exchange connecting the human microbiome. Nature
480: 241-244 1.1 Abstract
Horizontal gene transfer (HGT), the acquisition of genetic material from non-parental lineages, is known to play an important role in bacterial evolution (Ochman, Lawrence, and Groisman 2000; Koonin, Makarova, and Aravind 2001). Notably, HGT provides rapid access to genetic innovations, allowing traits like virulence (Chen and Novick 2009), antibiotic resistance (Lester et al. 2006), and xenobiotic metabolism (Hehemann et al. 2010) to spread through the human microbiome. Recent anecdotal studies that provide snapshots of active gene flow on the human body highlight the need to determine the frequency of such recent transfers and the forces that govern these events (Lester et al. 2006; Hehemann et al. 2010). Through the analysis of 2,235 full bacterial genomes, here we report the discovery and characterization of a vast, human-associated network of gene exchange, large enough to directly compare the principal forces shaping HGT for the first time. We show that this network of 10,770 unique, recently transferred (> 99% nucleotide identity) genes is principally shaped by ecology rather than geography or phylogeny, with most gene exchange occurring among isolates from ecologically similar, but geographically separated environments. For example, we observe 25-fold more HGT among human-associated bacteria than among ecologically diverse non-human isolates (P = 3.0 x 10-270). Within the human microbiome, we show
this ecological architecture continues across multiple spatial scales, functional classes, and ecological niches with transfer further enriched among bacteria that inhabit the same body site, exhibit the same oxygen tolerance, or have the same ability to cause disease. This structure offers a window into the molecular traits that define ecological niches, insight we use to uncover sources of antibiotic resistance and to identify genes associated with the pathology of meningitis and other diseases.
.*These authors contributed equally to this work.
1.2 Main Text
The human body is a complex biological network comprised of ten microbes for each human cell and one hundred microbial genes for each unique human gene (Gill
2006). Because this hidden microbial majority is known to have profound impacts on
many aspects of human health including immunity (Round and Mazmanian 2009), inflammatory disease (Xavier and Podolsky 2007), and obesity (Ley et al. 2006), considerable efforts are underway to document the genetic diversity of the human microbiome. It is unclear what role HGT plays in the generation and distribution of this biochemical repertoire, although anecdotal findings suggest that it may be significant (Lester et al. 2006; Hehemann et al. 2010; Xu et al. 2007). In addition to informing our understanding of microbial evolution, predictive models of gene transfer are needed to effectively engineer the human microbiome because HGT facilitates rapid adaptation to drugs and other perturbations (Lester et al. 2006; Hehemann et al. 2010). Until now, however, a dearth of available genome sequences and appropriate analytical techniques have left an incomplete view of the forces that govern HGT (Lawrence and Hendrickson
2003).
Many previous efforts to explore these forces have highlighted the relationship between phylogeny and HGT (Thomas and Nielsen 2005; Gogarten, Doolittle, and Lawrence 2002; Mazodier and Davies 1991; Lawrence and Hendrickson 2003).
Phylogeny is expected to strongly influence HGT because shared evolutionary history is associated with overlap in the host range of mobile elements (Mazodier and Davies
1991), establishing a mechanistic basis for the phylogenetic control of gene exchange.
Meanwhile, upon transfer, selection favors the persistence of genes acquired from close relatives, because these genes have greater compatibility with native molecular
machinery (Tuller et al. 2011; Jain, Rivera, and Lake 1999).
Geography might provide an alternative structure to HGT by restricting dispersal, as suggested by the geographically organized distribution of Vibrio cholera integrons (Boucher et al. 2011) and NDM-1 antibiotic resistance genes (Kumarasamy et al. 2010).
A third possibility is that ecological similarity shapes networks of gene exchange by selecting for the transfer and proliferation of adaptive traits or by increasing physical
hyperthermophiles (Aravind et al. 1998) and spatially segregated exchange among Shewanella isolates (Caro-Quintero et al. 2011) offer suggestive glimpses of such an ecological structure. However, it has been difficult to determine whether ecology plays a broader role in HGT due to the limited availability of genomes from similar
environments and because most previous work has ignored the distinction between recent transfers and ancient events. The inclusion of transfers from millions or billions of years in the past can obscure ecological structure, because historical niches may not reflect modem environmental associations.
To explore the effects of phylogeny, geography and ecology on HGT we use an evolutionary rate heuristic to identify recent transfers among thousands of microbial genomes. Our heuristic finds blocks of nearly identical DNA (> 500 nucleotides, > 99%
identity) in distantly related genomes (< 97% 16S rRNA similarity). HGT is the best explanation for these observations because the highly conserved 16S rRNA gene evolves about 25 times more slowly than protein-coding synonymous sites (Ochman, Elwyn, and Moran 1999). As a result, vertically inherited orthologs in such divergent genomes are nearly saturated with mutations at synonymous sites (Ochman and Wilson 1987), in contrast to the almost perfect identity that we require. To avoid over-counting transfers, we cluster similar genomes and normalize against the number of possible comparisons.
We have confirmed that at least 98% of all HGT events identified with our approach include a predicted protein-coding gene, indicating that potentially problematic non-coding elements do not significantly affect our results. To further validate our HGT detection method, we use two phylogenetic inference methods to evaluate the
evolutionary origins of putatively transferred sequences. Quartet mapping and a gene loss analysis each support 99% of identified HGTs (Supplemental Fig. 1.1).
As expected, a large fraction of observed transfers (27%) include at least one predicted mobile element, underscoring the importance of these genes in facilitating exchange. However, when we account for redundancies we find that mobile elements like plasmids (2%), phage (1%), and transposons (9%) reflect only a promiscuous minority of the 10,770 total unique proteins that we observe, while the majority of unique genes
(87%) provide other functions.
Direct exchange between any two bacteria in our dataset is unlikely, both because we limit our analysis to distantly related bacteria and because strains were isolated from different human subjects or environments, often on different continents. An average pairwise distance of 7,000 kilometers separates bacteria engaging in HGT. Therefore, each observed HGT likely reflects two independent acquisitions from a shared pool of mobile DNA, followed by proliferation.
To quantitatively explore the connectivity of bacteria in the human microbiome relative to other environments, we compare gene transfer among the 1,183 human-associated bacteria and 1,052 non-human human-associated isolates from a broad range of aquatic, terrestrial, and host-associated environments across the world. Even after correcting for biased sampling of human-associated clades (see Methods), pairs of bacteria isolated from the human body are 25-fold more likely to share transferred DNA than pairs from other environments (P = 3.0 x 10-270, combined Mann-Whitney U test).
This enrichment in human-associated transfer may be caused by the prevalence of overlapping selective pressures in the tightly regulated, endothermic human host
compared to diverse, non-human environments that experience significant temporal and spatial variation in selective pressures. Consistent with this hypothesis, when the
environment is specified more precisely by focusing on human isolates from the same body site, we observe two-fold higher rates of transfer (P = 9.9 x 10-108, combined Mann-Whitney U test). Remarkably, among the most closely related isolates from the same body site, this corresponds to recent HGT among > 40% of comparisons. This elevated transfer among bacteria isolated from similar environments extends beyond the human body, with three-fold more HGT among bacteria isolated from the same non-human environment relative to isolates from different non-human environments (P = 1.3 x 1031,
combined Mann-Whitney U test).
However, an alternative explanation for these observations is that closely related bacteria colonize similar environments, creating an apparent ecological effect that is actually driven by shared evolutionary history. To control for such a phylogenetic effect, we plot observed HGT over a range of phylogenetic divergences, and find that the strong enrichment for exchange within similar environments (same host, same body site, same non-human environment) persists across all distances (Fig. 1.1).
In order to directly compare the relative contributions of phylogeny and ecology to the enrichment in human-associated transfer, we compute recent HGT among bacteria isolated from the human body (same ecology) and between these human-associated bacteria and all non-human associated isolates (different ecology) over a range of phylogenetic distances. As shown by the dashed line in Fig. 1.2a, even the most deeply divergent bacteria that are separated by billions of years of evolution but share the same ecology, engage in more HGT than the mostly closely related isolates with different ecology. Thus, this recent gene exchange is structured by ecology more than by phylogeny.
We use a similar approach to explore the influence of geography relative to phylogeny, and find that exchange between continents is slightly lower than exchange within the same continent (Fig. 1.2b; P = 0.02, combined Mann-Whitney U test). However, this geographic effect is much weaker than that of phylogeny, which is itself less informative than ecology. Taken together, these analyses indicate that recent HGT frequently crosses continents and the Tree of Life to globally connect the human microbiome in an ecologically structured network.
This ecological architecture might only reflect the especially pronounced
ecological differences between human-associated and non-human associated bacteria. To determine whether ecology has a broad influence on recent gene exchange we search for enriched HGT in narrower spatial, functional, and niche resolutions within the human host. Across all of these dimensions ecology strongly predicts gene exchange.
In addition to the previously discussed finding that transfer is enriched among bacteria from the same body site (Fig. 1.1), we find that further specifying the sub-site of isolation (e.g. separating vaginal isolates from other urogenital isolates) reveals even higher levels of transfer across all three annotated body sub-sites (sub-sites: vagina, gingiva, nasopharynx. Fig. 1.3a, Supplemental Figs. 1.2 and 1,3; P = 1.7 x 10⁻⁹,
combined Mann-Whitney U test). When all human and non-human environments are considered, with scales ranging from tissues to ecosystems, we find that exchange at a narrow spatial scale, within an environment, always exceeds exchange at a broader spatial scale, with all other environments (Fig. 1.3b; P = 1.3 x 10273, combined
Chi-Square).
Until now, our analysis has relied on isolation environment as a proxy for ecological similarity, ignoring heterogeneities within these sites. Here we explore these differences, by evaluating the effects on HGT of oxygen tolerance and pathogenicity -the only other sufficiently annotated ecological features. Even after controlling for the effects of body site and phylogeny, we find that HGT is also structured by oxygen tolerance (Fig. 1.4a; P = 7.7 x 10⁻¹, Chi-Square) and pathogenicity (Fig. 1.4b; P = 7.4 x 10-", Chi-Square). These findings demonstrate that in addition to the extensive spatial effects described earlier, chemical gradients and symbiotic relationships provide further ecological structure to recent HGT. Because these results persist after controlling for explicit spatial effects, they appear to reflect selection rather than simply co-occurrence.
To further explore the role of selection, we probe its effects on the proliferation of different functional classes. If selection influences the rates and bounds of gene
exchange, then the transfer of genes providing a non-specific selective advantage, like antibiotic resistance, should exhibit reduced environmental specificity relative to other, more niche-specific functional classes. To test this prediction, for each environment, we consider the fraction of observed transfers that include at least one antibiotic resistance gene (Fig. 1.3c). In contrast to our earlier observation of increased transfer within sites when all functional classes are grouped together (Fig. 1.3a and 1.3b), here we observe that resistance comprises a higher fraction of transfers across different environments than within the same environment (Fig. 1.3d; P = 6.9 x 10-279, combined Chi-Square). Thus,
when ecological forces transcend environmental boundaries, mobile genes do too. We have explored networks of gene transfer to evaluate the forces that influence recent HGT, finding that ecology is profoundly important. Now we demonstrate how knowledge of this association between ecology and HGT can be used to reveal clinical insights from patterns of observed gene transfer.
Our findings coupled with previous results (Hehemann et al. 2010) suggest that recently transferred genes among bacteria occupying a well-defined niche are especially likely to reflect adaptation to that niche. Consistent with this expectation, we find that many genes transferred among distantly related meningitis isolates -like hemolysins, adhesins, and antibiotic resistance genes (Supplemental Table 1) -are known to play an important role in the disease (Kim 2003). We suggest that other transferred genes with
unknown functions are likely cryptic virulence factors and should be prioritized for experimental annotation. Thus, in addition to recovering known virulence factors, our approach might streamline the search for novel drug targets (Clatworthy, Pierson, and Hung 2007), because while it is prohibitively difficult to explore all 24,095 unique meningitis genes with unknown function, it is tractable to evaluate the thirteen that were recently transferred. We use this approach to identify genes associated with other diseases (e.g. pneumonia, endocarditis; Supplemental Tables 2 and 3) and environments (e.g. hot springs and soil; Supplemental Tables 4 and 5) opening a molecular window into the genetic traits that define ecological niches.
As a second example, our analysis of recent HGT reveals potential sources of clinical antibiotic resistance. We find that bacteria from farm animals and human food are enriched in transfer of resistance with human-associated bacteria relative to other non-human associated isolates (P = 1.7 x 10~1 and P = .01, respectively, Mann-Whitney U
test). Forty-two unique antibiotic resistance genes are transferred between human and farm isolates. These transferred genes comprise nine families, all of which include both genes known to provide resistance to clinical antibiotics and genes known to confer resistance to agricultural drugs (see Supplemental Table 6). This suggests that livestock-associated bacteria can contribute to clinical resistance without directly infecting humans, because for these mobile traits, genes, not genomes serve as the unit of evolution and proliferation. Moreover, we observe forty-three unique antibiotic resistance genes
crossing national borders, suggesting that because the human microbiome is globally connected, local contamination of the shared mobile gene pool can have significant trans-national consequences.
Here we present the discovery that ecology governs recent HGT and use this finding to reveal the key genes and networks of exchange that facilitate colonization, and occasionally exploitation, of the human host. In the future this approach could be
extended to analyze bacterial genomes from individuals or groups of individuals that differ in diet, disease, or descent to search for the microbial genes that affect these human conditions.
1.3 Methods
Methods Summary
All 16S rRNA genes were identified using the GreenGenes database (DeSantis et al.
2006a). 115 genomes with spurious or truncated 16S rRNA sequences were excluded from our analysis. We used BLAST (version 2.2.20) with default parameters (Altschul
1990) to calculate an all against all nucleotide alignment for 2,235 genomes downloaded
from IMG (Markowitz 2006). We infer HGT events from blocks of nearly identical DNA
(> 99% identity, > 500 bp) in distantly related genomes (< 97% 16S rRNA similarity). To
avoid over-counting events in ancestral lineages, we collapse closely related genomes using average linkage clustering into groups ('species') with 16S rRNA dissimilarity of 2%. For each pair of these clusters, we calculated the fraction of genome comparisons between clusters that share at least one inferred HGT event. We sum this fraction over all pairs of clusters and normalize to the total number of comparisons in order to calculate the HGT per 100 comparisons. Statistical tests of HGT enrichment were performed separately for each distance bin then combined into a single p-value using Fisher's Method. We modeled antibiotic resistance transfer as a binomial random variable with parameter p and calculated a 95% confidence interval around our estimate ofp. The size of this confidence interval, which is the statistical uncertainty of our estimate, was used to desaturate the color of the heatmap in Fig. 1.3c. To explore the effects of oxygen
tolerance and pathogenicity on HGT, we use a Chi-Square test to compare the observed frequency of HGT to the expected value given the distribution of body sites and
phylogenetic divergences. Protein-coding regions were identified and annotated using BLASTX (Altschul 1990) (E-value < IE-50) and UBLAST (R. C. Edgar 2010)
(maxtargets = 100, E-value < IE-50) searches against the NCBI nr database. Unique
genes reflect unique best BLAST hits to the database. Antibiotic resistance genes were annotated using the Antibiotic Resistance Genes Database (Liu and Pop 2009).
Extended Methods
Quartet mapping
To test whether phylogenetic reconstruction supports our inference of HGT, we performed quartet mapping, in which all possible four-member trees are generated and analyzed to simulate analysis of the larger and more computationally challenging parent tree. We followed a similar approach to the quartet mapping described by Daubin and Ochman (Daubin and Ochman 2004). Briefly, we searched all 2,235 genomes in our analysis for homologs to each HGT event (defined as best reciprocal BLAST hits with >
60% nucleotide identity over > 60% of the length of the transferred gene; see note on
homology below). For HGT events with at least two homologs, we used MUSCLE (with default settings) to construct an alignment of the HGT sequences and all other non-HGT
sequences. Events with fewer than two non-HGT homologs -23% of the total -cannot be used to generate a quartet and so could not be analyzed by quartet mapping. For the quartets that remained, we used Tree Puzzle to analyze all possible quartet topologies among the aligned HGT and non-HGT sequences. With Tree Puzzle we used exact parameter estimates and gamma distributed rates with four rate categories. To provide phylogenetic confirmation of our putative HGT events, we computed the likelihood of obtaining a quartet grouping the HGT events together, versus the alternative, vertical model that would group sequences by the topology of the species phylogeny. A
previously published likelihood ratio (Daubin and Ochman 2004) was then used to place phylogenetic confidence in each HGT event. We used the most stringent confidence threshold possible, requiring a likelihood ratio of 1.0 to support HGT inference. With this conservative approach, more than 99% of the HGTs we analyzed were supported.
Gene loss analysis
We explored whether vertical inheritance is a plausible alternative explanation for each inferred HGT by determining the minimum number of independent loss events that would be needed to support a model of vertical inheritance. We mapped all inferred transfers and their homologs to the IMG species tree and calculated the number of independent loss events that would be required to explain the sparse phylogenetic distribution of these events. Here, we define homologs as best BLAST hits with > 90%
identity and > 80% length (see note below). These parameters allow for considerable variation in evolutionary rates within the gene family.
As shown in Supplemental Fig. 1.1, for the majority of HGT events, over 100 independent loss events would be required to accept a model of vertical descent. To contextualize this remarkable observation, most parsimony based HGT detection tools use an empirically derived estimate of approximately 3:1 as the parsimony cost of losses relative to HGT (David and Alm 2011). Using this 3:1 parsimony metric, over 99% of our events can be explained by HGT.
Note on the detection of homologs
We varied the parameters that define homology for the two approaches above in order to maximize our ability to detect vertical transmission. We used an especially permissive definition of homology for quartet mapping to allow a maximal number of potentially homologous genes to disrupt the pairing of the putatively transferred sequences, thereby increasing the opportunity to return a quartet that does not support HGT. We employed a more moderate definition of homology for the loss analysis to avoid spuriously inserting unrelated proteins that may have appeared as false loss events.
Controlling for contamination
To control for the potential effect of contamination derived from genomes processed at the same sequencing facility, we repeated our principal analysis, but only compared
genomes sequenced at different facilities. This restricted analysis confirmed that our main findings are not caused by contamination between projects at the same sequencing center. In Supplemental Fig. 1.4, we show that there is more HGT among human-associated bacteria than among non-human associated bacteria, across all phylogenetic distances.
The enrichment in HGT among bacteria occupying the same body site relative to bacteria occupying different body sites is similarly replicated in this restricted analysis (as found in Figure 1.1 of the main text).
shared ecology continue to exchange more DNA than the most closely related comparisons with different ecology when only HGT between sequencing centers is allowed (as found in Figure 1.2 of the main text).
Controlling for cosmopolitan genomes
To control for the potential effect of cosmopolitan genomes that inhabit multiple environments, we repeated our principal analysis, excluding all genome clusters containing at least two representatives from different body sites, hosts, or other environmental categories. This removed cosmopolitan groups of organisms like
Escherichia coli, which is found in the gut, skin, blood, and non-human environments for example. This restricted analysis robustly yields the pattern of ecological enrichment found in the main text (Supplemental Fig. 1.6).
Limitation of HGT detection
Our method is only able to detect horizontal gene transfer between distantly related lineages. Another limitation is that our method can only detect recent events that share
99% nucleotide identity. Consequently the dynamics discussed in our analysis may not
apply to more ancient HGT or to HGT between less divergent strains. However, because a stringent phylogenetic distance cut-off is used to inform each HGT classification our method avoids many of the limitations of previous BLAST-based approaches to HGT detection (Stanhope et al. 2001).
Limitations of geographic inference
There are a few important caveats to consider when reviewing our geographic findings.
First, due to limited sample size, we only explored the effects of geography at continental scales. It is possible that strong effects may persist at finer spatial scales, although these may be primarily driven by ecological overlap, which is difficult to distinguish from local geography. Second, the location of isolation is only a proxy for the overall geographic range of a sequenced strain. When a strain is isolated from a particular site, it may have a range that extends across a much larger geographic range, obscuring the validity of geographic inference from a single sample.
Annotation of mobile genetic elements
For this analysis we were interested in exploring the approximate magnitude of mobile elements relative to other functional groups. In the interests of defining the minimum number of mobile elements in our analysis, we chose a rapid and highly specific method at the expense of sensitivity. We aligned all transferred sequences to the NCBI nr database using BLASTX. We extracted the annotations for the best BLASTX hit in nr (with an e-value of e < IE-50). Next we used keyword search text mining coupled with
manual curation to count the frequency of each functional category. Our keywords are designed to reduce false positives -we understand that valid mobile elements may not be detected with this simple approach.
The keywords used to identify each functional group are listed below (case sensitive):
Transposons: transpos*, TN, insertion element, is element, IS element Phage: phage, tail protein, tegument, capsid
Plasmid: relaxase, conjugal transfer, Trb, relaxosome, Type IV secretion, conjugation, Tra[A-Z], Mob[A-Z], Vir[A-Z][0-9], t4ss, T4SS, resolvase
Other MGE: recombinase, integrase
The percent of total proteins (27%) is calculated by counting each of the functional classes as a fraction of all transferred sequences. In order to account for redundancy in the set, we extract the NCBI gene identifier for the best BLASTX hit for each transferred
sequence. We then remove all redundancies from this list of gene identifiers and count the fraction of unique gene identifiers that fall into each of the functional classes
described. This analysis suggests that a relatively small group of promiscuous mobile elements accounts for a large fraction of total transferred sequences.
Definition of environments
Farm samples are taken directly from animals used in agriculture (horse, cow, sheep, goat, pig). As with human subjects, samples from animals vary (blood, stool, rumen etc.).
Metadata to define environments, such as isolation site, oxygen tolerance, and pathogenicity were downloaded from IMG.
Treatment of ambiguous metadata annotations
We only consider genome comparisons for which we have appropriate metadata. For genomes with partial metadata (i.e. oxygen tolerance is annotated, but continent and disease are missing), we include the genome when possible (for oxygen tolerance) and ignore it in other analyses (continent and disease).
When comparing the frequency of HGT in the same environment with the frequency of
HGT between different environments it is necessary to handle ambiguous genome
annotations with multiple annotated environments (e.g. gut and skin). In these cases, we consider this strain once for each metadata label. Thus when a strain from the gut is compared to a strain annotated as gut and skin, this comparison will contribute to both comparisons of gut-gut transfer and gut-skin transfer.
Computation of error bars
Error bars reflect our estimated uncertainty in the sampling of a binomial random variable (the observation of HGT). We compute error bars as the standard deviation in
%HGT by modeling the total number of transfers as a binomial random variable with
parameters p and n. We take n to be the number of independent species cluster comparisons and we estimate p as thie total %HGT observed at each phylogenetic distance. From these considerations, it follows that the variance is given by Var[%HGT]
= p(l -p)/n which is used to calculate the standard deviation at each distance bin.
Counting HGT
When measuring the frequency of HGT between environments we only consider the fraction of genomes that share at least one HGT. We do not consider the length of a transfer because high variance in event length would add significant noise to our results and overweight rare, large transfer events that do not reflect evolutionary independence. We do not consider the number of distinct regions of HGT shared between two genomes
because transposition or poor assembly might falsely inflate this metric by splitting a single large event into many smaller apparent events.
In Fig. 1.3 of the main text, HGT is computed as the average across all distance bins in contrast to Fig. 1.1, where HGT is computed in separate distance bins. As a result, the frequencies of HGT cannot be directly compared between the two figures.
Clustering similar genomes
In order to avoid over-counting transfers, we use average linkage clustering to group similar genomes (with < 2% average 16S rRNA divergence). This ensures that transfers between clusters reflect evolutionary independence and avoids the problem of counting a single transfer in a densely sampled lineage many times. All comparisons discussed in the text reflect transfers across clusters constructed in this manner.
Because the sequenced flexible genome is larger when more isolates from a single cluster are considered, the probability of observing at least one transfer between two clusters with many sequenced isolates is greater than between two clusters with fewer sequenced isolates. To account for this effect, for each cluster comparison we consider the fraction of genomes that share an HGT. We equally weight all genome comparisons between two clusters. If 50% of a genome cluster has a hit with at least one member of another
genome cluster, we consider this cluster comparison as 50% of an HGT.
Statistical methods
To test for overall enrichment in HGT between two metadata labels (e.g. human vs. non-human) we perform separate statistical tests for enrichment within each phylogenetic distance bin, then combine these test results into a single p-value using Fisher's method. Within each phylogenetic distance bin, we determine if there is a significant difference in
HGT frequencies between all pairs of genome clusters belonging to the two different
metadata labels. With our counting and clustering protocols (described above), we create two vectors (each corresponding to a metadata label) of HGT frequencies (with
applied to assess differences in observed frequencies of HGT and to assess the statistical significance of the data underlying Fig. 1.1, Fig. 1.2, and Fig. 1.3 in the main text. This approach controls for the effect of phylogeny by restricting comparisons of HGT
frequency to isolates of similar phylogenetic divergences (distance bins of 1% 16S rRNA distance).
After establishing the strong effect of body-site on HGT frequency in the human
microbiome, further analyses (such as oxygen tolerance and pathogenicity as in Fig. 1.4, main text) must control for both the effects of phylogeny and body-site. We achieve this
by calculating the frequency of HGT for all possible combinations of body-sites and
phylogenetic divergences. For example, the expected value for skin-gut transfer at 3-4%
16S rRNA divergence is the average of all observations that meet these metadata criteria.
Our null model assumes that further constraining our analysis with additional metadata labels will not lead to values that deviate from these expected values. To test this model, we compare the expected value to the observed frequency of HGT when the analysis is further conditioned on a new metadata label (e.g. anaerobes in skin and gut at 3-4% 16S rRNA divergence). We determine whether this further metadata constraint is associated with elevated HGT by using a Chi-Square test to compare the expected values with the observed values.
1.4 Figures 1~ I' Human -rn -Same site - - - Different site - Non-Human
*
3
c
(A 0 tuE
0 U 0 0 r.F-16S Distance (%)
Figure 1.1: Recent HGT is enriched in the human microbiome across all
phylogenetic distances. These plots (a, b) show HGT frequency as a function of the
phylogenetic divergence between species, for a, human-associated bacteria, and b, non-human associated bacteria. We define species as clusters of genomes separated by < 2%
16S rRNA divergence. HGT frequency is calculated in bins of 1% 16S rRNA divergence.
Error bars reflect one standard deviation (see Supplemental Methods), with sample sizes described in Supplemental Table 8. These trends are also observed after controlling for the potential effects of sequencing center contamination (Supplemental Fig. 1.4) and cosmopolitan strains (Supplemental Fig. 1.6).
50-6
9
12
15
18
40-
30-
20-
1
0-25 - - Same ecology Different ecology 20- 15-10 5-0 .. . .. .. . . .. . . 3 6 9 12 15 18 16S Distance (%) b E U, 0 U 0 0 20- 15- 10- 5-0 - Same continent Different continent 3 6 9 12 15 18 16S Distance (%)
Figure 1.2: Ecology is the dominant force shaping recent HGT in the human
microbiome. a, The frequency of HGT among human-associated isolates (same ecology;
blue) and between human-associated and non-human associated isolates (different ecology; red). b, The frequency of HGT among bacteria isolated from the same continent (blue) and different continents (red). Due to reduced sample size in b, we pooled
comparisons into larger phylogenetic distance bins of 3%. Error bars are calculated as in Fig. 1.1. The role of ecology in (a) is recovered when we control for sequencing center contamination (see Supplemental Fig. 1.5).
27 a 0, CL 0 U C) a-E_
a C Nasopharynx Other Gut Gingivae 0 Other Skin 0 Vagina Other Hydrothermal e Heterotroph Other Soil Food Farm d AR100% 0% Air X CL 0 z0 Human Non-Hu Oral Uro Marine
0. > 2 , , W C .C 0 4- . 41lO, Z 0 0 >o 0 5 o 0 6 nan b -0 E All 0 0 0% 11% 10 ----low ---10 * Ic ---- I ID Is - ---0 6 7 * Same site o All other sites 0 25 50 75 100
% HGT containing antibiotic resistance (AR)
Figure 1.3: HGT is ecologically structured by functional class and at multiple spatial scales. The frequency of transfer among different environments is shown for all
functional groups (a, b) and for antibiotic resistance (AR) genes only (c, d). Box widths indicate the number of genomes from each environment. a, When all genes are
considered (upper half) human isolates form a block of enrichment (upper left). b, For every environment examined we observe more transfer within the same environment (black dots) than between environments (white dots). c, The fraction of gene transfers that includes at least one AR gene for each environment. Statistical uncertainty in the proportion of AR transfer is indicated by reduced color saturation (see Methods). d, AR genes comprise a significantly higher fraction of observed HGT between different environments (white dots) relative to within the same environment (black dots) in contrast to (b). 10.6 E C 0 z C 0 . 3 C E 0 2 a a 0
40 Oxygen tolerance - Observed Expected 30- 20- 1 0-3 6 9 12 15 18 16S Distance (%) b 60- 50-0 40 -E 0 20- I-'3 I Pathogenicity -- Observed Expected 10 3 6 9 12 15 18 16S Distance (%)
Figure 1.4: Gene exchange is ecologically structured by oxygen tolerance and pathogenicity. The frequency of HGT between genomes with the same (a) oxygen
tolerance and (b) pathogenicity is shown relative to their expected values. Expected values are based on overall frequencies of transfer among bacteria from the same
distribution of body sites and phylogenetic distances. Bacteria that share the same oxygen tolerance (aerobic, anaerobic, microaerophilic, or facultative aerobic) and pathogenicity (pathogenic or commensal) engage in significantly more HGT than is expected under the null model. Error bars are calculated as in Fig. 1.1.
29 a CL 0 0 U 0 CD'
1.5 Supplemental Figures and Tables
40 60
Number of Loss Events
Supplemental Fig. 1.1: The majority of inferred HGT events require over 100 independent loss events in order to accept a model of vertical descent. For each
inferred transfer we map homologs onto the species tree and infer the minimum number of independent loss events needed to support a model of vertical inheritance. This figure depicts the frequency with which loss events are inferred - most inferred transfers would require extensive loss events in order to accept the alternative model of vertical
transmission, supporting our approach to HGT detection.
0.6 0.5 0.4 0.3 C 0) 0.2 0.1 F 0.00 20 80 U >100 11 i I I I
Human Non-Human
Air Oral Uro Marine Soil
t2,
4
0
b Human Non-Human
Air Oral Uro Marine Soil
us y Nasopharynx Other Gut o Ginivae X'6 Other Skin o Vagina or Other Hydrothermal o Heterotroph 2 Other Heterotroph Other Food Farm Human Non-Human
Air Oral Uro Marine Soil
02 Nasopharynx Other Gut E Gingivae O6 ther, Skin 2 Vagina D Other Hydrothermal Heterotroph e ~ Other Heterotroph Other Food Farm Nasopharynx Other Gut Gingivae e-) Other Skin o Vagina Other Hydrothermal Heterotroph Other Heterotroph Other Food Farm
Supplemental Fig. 1.2: Heatmap of HGT among isolates in different environments at 5%, 7% and 10% 16S rRNA divergences. This figure shows the frequency of HGT
between each of the environments included in this study across three different distance cutoffs, in addition to the overall plot shown in Figure 1.3a of the main text. Each distance cutoff includes all comparisons satisfying the given separation criteria (e.g. 5% includes comparisons of all clusters of bacteria separated by at least 5% 16S rRNA
divergence). Although the specific values of enrichment vary across different distance cutoffs, the overall pattern of human, body site and body sub-site enrichment persists across all distance groupings. We show only the heatmap for all gene classes (excluding the inset heatplot for antibiotics that appears in the main text Figure 1.3c) because there are insufficient counts to yield reliable estimates for rates of long distance transfer when only antibiotic resistance genes are considered.
31 a P1 4 -CL 0
3 - 3% 4-5% C El7% E 2 - 510% -C CUr
a Air, Air, Uro,
- 1 Naso. Other Other
0
-Gut Oral, Oral, Skin Uro, Gingivae Other Vagina
-1-Supplemental Fig. 1.3: Barplot of HGT for each body site at 3%, 5%, 7% and 10% distance cutoffs. This figure summarizes the persistence of body-site and sub-site
enrichment across four distance cutoffs. As in Supplemental Fig. 1.2, distance cutoffs reflect all comparisons with at least the given 16S rRNA distance. The log-fold
enrichment indicated on the vertical axis describes the ratio of observed transfers within the given body site at each distance relative to HGT among all human isolates at the same phylogenetic distance cutoff. The poorly sampled nasopharynx (n = 25) and non-vaginal urogenital sites (n = 46) are the only categories for which the enrichment in transfer does not persist across phylogenetic distances (likely due to uncertainty arising from small
sample sizes). Otherwise, the majority (n = 480) of isolates belong to body sites for which enrichment persists across all observed distances.
HGT between different sequencing centers 50 1 Human -- Same site A 40-- Different site C- Non-Human 0
E
30 0 20 L 210-03 6 9 12 15 18 16S Distance (%)Supplemental Fig. 1.4: Ecological structure persists when only genome comparisons from different sequencing centers are allowed. We compute the frequency of transfer
within human associated isolates (yellow), non-human isolates (blue) human isolates from the same body site (green) and human isolates from different body sites (red), while only allowing genome comparisons between different genome sequencing centers. This controls for contamination that might arise in the sequencing and assembly process.
25 0 0 CL
E
0 U L 20 15 101 5 3HGT between different sequencing centers
-- Same ecology
Different ecology
6 9 12
16S Distance
(%)
15 18
Supplemental Fig. 1.5: Ecology is the dominant force shaping recent HGT in the human microbiome, even when HGT is only allowed between different sequencing centers. This figure compares the effects of ecology relative to phylogeny on HGT, when HGT is only allowed between different sequencing centers. The frequency of HGT is
shown among associated isolates (same ecology, blue) and between human-associated and non human-human-associated isolates (different ecology, yellow). Even the most distantly related bacteria with shared ecology engage in more HGT than the most closely related bacteria with different ecology when we control for contamination caused by sequencing projects from the same sequencing center.
HGT excluding cosmopolitan species 70 _ Human 60 Same site ,-- Different site a - Non-Human 0 L0 ________ 0 ~30 0. 20 10 3 9 12 15 18 16S Distance
(%)
Supplemental Fig. 1.6: Ecological structure persists when cosmopolitan species are excluded. We compute the frequency of transfer within human associated isolates
(yellow), non-human isolates (blue) human isolates from the same body site (green) and human isolates from different body sites (red), while excluding species that are present in multiple environments (cosmopolitan species). This controls for the potential
confounding effect of cosmopolitan species.
Supplemental Table 1.1: Sample shows the sample sizes used in the
sizes used in statistical comparisons. This table Mann-Whitney U-tests in Figs. 1.1, 1.2, and 1.4.
16S rRNA Distance Bins
Environment 3 4 5 6 7 8 9 10 11 Human 166 232 378 383 827 1327 1638 2672 3544 Human within 88 120 184 193 416 546 562 786 973 buwn 62 132 200 198 372 576 857 1689 2300 Non-Human 1658 1169 2859 2657 3810 6526 6891 10380 13841 Same ecology 166 232 378 383 827 1327 1638 2672 3544 Different 552 425 948 911 1876 3831 3979 6990 8263 ecology continent 84 253 652 Different 108 372 1186 continent Same oxygen 106 190 268 247 500 708 683 988 1297 tolerance ____ ____ ____ ____ ________ ____ pathogenicity 30 70 122 84 174 233 266 355 434
16S rRNA Distance Bins
Environment 12 13 14 15 16 17 18 Human 5001 7262 10802 15319 18587 18125 14944 H 1417 1896 2807 3935 4556 4275 3451 within I___ bumen 3101 4704 6840 9586 11739 10982 8946 Non-Human 22295 29688 45310 64169 76375 74374 58819 Same ecology 5001 7262 10802 15319 18587 18125 14944 Different 13433 18909 27956 39740 50099 50868 40880 ecology I I_ _ continent 2120 4709 1974 continent 3375 7831 3510
Note: Supplemental Tables 1-6 from this publication can be found online at nature.com. These tables are very long and have been omitted from this document due to space
Chapter 2: Identical CRISPR spacers among distantly related
bacteria reveal common strategies to target promiscuous
mobile elements.
Smith MB, Alm, EJ (2014) Identical CRISPR spacers among distantly related bacteria reveal common strategies to target promiscuous mobile elements. (In progress)
2.1 Abstract
The discovery of ubiquitous, recent horizontal gene transfer (HGT) in bacteria suggests that experimental observations may understate the host range of mobile genetic elements
(MGE) (Smillie et al. 2011). As a form of heritable, adaptive immunity in bacteria, arrays
of Clustered Regularly Interspersed Short Palindromic Repeats (CRISPR) provide a natural record of infection history that can be used to systematically explore the host range of MGE. Through the analysis of 159,468 CRISPR spacers in 3,314 bacterial genomes, here we show that even distantly related bacteria with less than 90% homology at the 16S rRNA gene often share matching CRISPR spacers with identical sequences
(7,009 observations), far more than expected by chance (P < 1 x 10-200, Chi-Square). Shared spacers are more likely to share homology to sequenced phage (10%) or plasmid genomes (2.7%) than are unique spacers (2.3% and 0.8% respectively), suggesting that
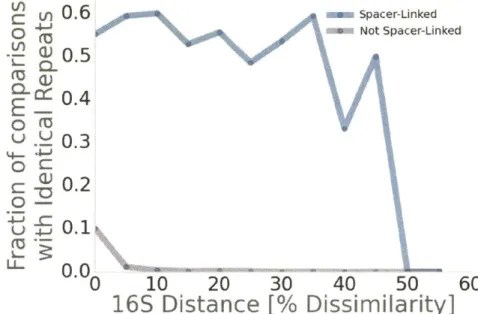
shared spacers target common elements in MGE and may confer broad resistance. At least 52% of bacteria with matching spacers also share identical CRISPR repeats, indicating that entire CRISPR arrays are often horizontally transferred. These
observations imply that targeted elements are widely shared and that bacteria recycle a surprisingly narrow set of effective molecular strategies to target MGE.