ecological interactions, and physically-induced variability
byAriane Verdy
B.Ing. Ecole Polytechnique de Montr6al, 2001
S.M. Massachusetts Institute of Technology & Woods Hole Oceanographic Institution, 2006 Submitted in partial fulfillment of the requirements for the degree of
Doctor of Philosophy at the
MASSACHUSETTS INSTITUTE OF TECHNOLOGY and the
WOODS HOLE OCEANOGRAPHIC INSTITUTION February 2008
©
2008 Ariane Verdy. All rights reserved.The author hereby grants to MIT and WHOI permission to reproduce and to distribute publicly paper and electronic copies of this thesis document in whole or in part in any
medium now known or hereafter created.
Author...
Join Program in Physical Oceanography Massachusetts Institute of Technology and Woods Hole Oceanographic Institution November 2007 Certified by... Glenn R. Flierl Professor of Oceanography Thesis Supervisor Accepted by ... . . . ... Raffaele Ferrari Chair, Joint Committee for Physical Oceanography Massachusetts Institute of Technology
ARCES
MASSACHUSETTS INSTITUlE
OF TEOMNOLOGY
APR
2 3 2008
by
Ariane Verdy
Submitted to the Joint Program in Oceanography at the Massachusetts Institute of Technology and the Woods Hole Oceanographic Institution, in partial fulfillment of the
requirements for the degree of Doctor of Philosophy November 2, 2007
Abstract
Marine ecosystems reflect the physical structure of their environment and the biological processes they carry out. This leads to spatial heterogeneity and temporal variability, some of which is imposed externally and some of which emerges from the ecological mecha-nisms themselves. The main focus of this thesis is on the formation of spatial patterns in the distribution of zooplankton arising from social interactions between individuals. In the Southern Ocean, krill often assemble in swarms and schools, the dynamics of which have important ecological consequences. Mathematical and numerical models are employed to study the interplay of biological and physical processes that contribute to the observed patchiness.
The evolution of social behavior is simulated in a theoretical framework that includes zooplankton population dynamics, swimming behavior, and some aspects of the variabil-ity inherent to fluid environments. First, I formulate a model of resource utilization by a stage-structured predator population with density-dependent reproduction. Second, I in-corporate the predator-prey dynamics into a spatially-explicit model, in which aggregations develop spontaneously as a result of linear instability of the uniform distribution. In this idealized ecosystem, benefits related to the local abundance of mates are offset by the cost of having to share resources with other group members. Third, I derive a weakly non-linear approximation for the steady-state distributions of predator and prey biomass that captures the spatial patterns driven by social tendencies. Fourth, I simulate the schooling behavior of zooplankton in a variable environment; when turbulent flows generate patch-iness in the resource field, schools can forage more efficiently than individuals. Taken together, these chapters demonstrate that aggregation/ schooling can indeed be the favored behavior when (i) reproduction (or other survival measures) increases with density in part of the range and (ii) mixing of prey into patches is rapid enough to offset the depletion. In the final two chapters, I consider sources of temporal variability in marine ecosystems. External perturbations amplified by nonlinear ecological interactions induce transient
ex-Southern Ocean, large-scale winds associated with ENSO and the ex-Southern Annular Mode cause convective mixing, which in turn drives air-sea fluxes of carbon dioxide and oxygen. Whether driven by stochastic fluctuations or by climatic phenomena, variability of the bio-geochemical/physical environment has implications for ecosystem dynamics.
Thesis Supervisor: Glenn R. Flierl Title: Professor of Oceanography
First and foremost, I thank my advisor, Glenn Flierl. I thank Mike Neubert, Hal Caswell, and the students and postdocs in the Mathematical Ecology Lab at WHOI for their hos-pitality and many stimulating discussions. Thanks to Mick Follows, Dan Rothman, and Bob Beardsley for helpful advice throughout the realization of this thesis. I am grateful for the mentorship provided by John Marshall and Sonya Legg. Thanks to my classmates and officemates for fun times. To my family, for unconditional support.
Funding was provided by the Academic Programs Office of the MIT-WHOI Joint Program, an Ocean Ventures Fund Award, an Anonymous Ys Endowed Science Fellowship, and by NSF grants OCE-0221369 and OCE-336839.
Introduction 11 1 Predator-prey dynamics with density-dependent mating success 19
1.1 Introduction: Allee effects ... 20
1.2 Stage-structured model ... 22
1.2.1 Density-dependent reproduction . ... 23
1.2.2 Full model and adimensionalization . ... 25
1.3 Asymptotic dynamics ... ... ... .. 27
1.3.1 Stability boundaries ... 29
1.3.2 Imposing structure in the population . ... 31
1.4 One-stage limit ... 33
1.4.1 Bifurcations and multiple equilibria . ... 36
1.4.2 Destabilization due to Allee effect . ... 39
1.4.3 On the Allee effect term in the prey equation ... 39
1.5 A continuous-weight model with power laws for birth and growth ... 42
1.6 Summary ... ... 46
1.7 Appendix: Fixed points and stability ... .. 48
2 Evolution and social behavior in krill 57 2.1 Introduction ... ... ... ... ... .. .. 58 2.2 Model formulation ... ... 60 2.2.1 Genetic model ... 61 2.2.2 Ecological dynamics ... .. 61 2.2.3 Turbulent stirring ... 64 2.3 Development of patches ... 66
2.3.1 Non-dimensional system of equations . ... 66
2.3.2 Numerical simulations ... ... 70
2.4 Conditions for success of the grouping strategy . ... 74 2.4.1 Grouping parameter and invasions
2.4.2 Mixing and stirring effects ...
2.4.3 Threshold values of flow and grouping parameter ... 2.5 Adding complexity: life history ...
2.6 Conclusions ...
2.7 Appendix A: Genotype frequencies in the two-allele model ... 2.8 Appendix B: Linear stability of the ecological model ...
3 Spatial instability driven by social behavior in predator-prey dynamics
3.1 Introduction ...
3.2 Motion in a one-dimensional space ... 3.2.1 The model ...
3.2.2 Linear growth of patches ... .
3.3 Analytical solution for fully-developed patches 3.3.1 Weakly nonlinear equations ... 3.3.2 Steady-state solutions .. . . . ... 3.4 Ecosystem dynamics . ...
3.4.1 Fast diffusion (v >> 1) ... 3.4.2 Slow diffusion (v < 1) ... 3.5 Swarming as a strategy for survival ...
3.5.1 Competition model ... 3.5.2 Optimal strategies ... 3.6 Summary ...
3.7 Appendix: Weakly nonlinear stability analysis .
.. . . . 92 S . . . . . 93 . . . .. . .. .. . . . 93 . ... . . . . 94 S . . . . . 95 . . . .. .. 97 ... . .100 . . . 102 ... . . . . 103 . . . 104 S. . . . .107 . . . ..107 . . . .109 . . . .112 . . . 114
4 Collective motion in a variable environment: Does schooling behavior improve foraging success? 4.1 Introduction . . . . 4.2 Individual-based modeling approach ... .. 4.2.1 Movement algorithm ... 4.2.2 Simulated groups ... 4.3 Variability of the flow ... 4.4 Foraging on patchy resources ... 4.4.1 Hybrid model and foraging algorithm . ... 4.4.2 Optimal strategy ... 4.5 Phase transitions in the density-distribution of Antarctic krill ... 4.5.1 Observed patterns ... 4.5.2 Emergent properties of simulated schools . ... 4.5.3 Behavior switching as a mechanism for observed phase transitions . 4.6 Conclusions .. .... ... ... .. ... ... .. 77 79 81 .. 83 86 .. 87 91 119 120 121 121 125 128 134 134 135 138 139 141 143 145
5 Sensitivity analysis of reactive ecological dynamics 5.1 Introduction ...
5.1.1 Characterizing transient dynamics ... 5.1.2 The sensitivity problem ...
5.2 Equilibria, linearizations, and their sensitivities . . . .
5.2.1 The linearization ... 5.2.2 Sensitivity of equilibria ... 5.2.3 Sensitivity of the linearization ... 5.3 Sensitivity of transient indices . ...
5.3.1 Sensitivity of reactivity ...
5.3.2 Sensitivity of the amplification envelope . . . . 5.3.3 Sensitivity of the optimal perturbation ... 5.3.4 Anisotropic measures of transient amplification 5.4 Applications to consumer-resource dynamics . . . . .
5.4.1 Predator-prey interactions . . . . 5.4.2 Multiple food chains ...
5.5 Discussion ...
5.6 Appendix A: The sensitivity problem in index notation
147 ... .. 148 S. . . . .149 S. . . 152 S. . . 154 ... 154 ... .. 155 S. . . . .155 . . . 156 . . . 157 S. . . 157 S. . . 158 S. . . 159 . . . . . 161 . . . . . 162 ... 174 ... 179 S. . . . .180
5.7 Appendix B: Derivatives of equilibria and indices of transient dynamics, with an example ... 6 Carbon dioxide and oxygen fluxes in the Southern Ocean: mechanisms of interannual variability 6.1 Introduction ... 6.2 Air-sea fluxes of carbon and oxygen in a global ocean model 6.2.1 Model description ... 6.2.2 Simulated variability ... . . . 6.3 Modes of air-sea flux variability, ENSO and SAM ... 6.4 M echanisms ... 6.4.1 Diagnostic Framework ... 6.4.2 Lagrangian model ... 6.4.3 Further simplifications to the diagnostic framework . 6.5 Conclusions ... ... .. 194 S. . . . .195 ... 195 S. . . . .197 S. . . 201 ... 204 ... 204 ... 207 S. . . . .210 ... 211 7 Concluding remarks 215 221 182 193 References
This thesis is about the structure and dynamics of marine ecosystems. Photosynthesis in the ocean provides energy to sustain a diverse and abundant fauna, which is assembled into communities of multiple species interacting with each other and with their environ-ment. The interplay of ecological and physical processes has important consequences for the evolution of communities. Some of these processes, such as individual behavior and predator-prey interactions, can be best expressed as mathematical equations. Theoretical frameworks can thus be used to represent idealized marine ecosystems. The main advan-tage of this approach is that it offers the possibility to perform quantitative analyses and to strip out most of the system's complexity in order to focus on key mechanisms.
Zooplankton patchiness
Zooplankton occupy an important position in oceanic food webs. By filling the size gap between the phytoplankton and animals that are too large to prey directly on microscopic algae, they provide a crucial link for energy transfer toward higher trophic levels. The spatial distribution of zooplankton is observed to be highly variable (e.g. Mackas and Boyd, 1979); the patchiness is produced in part by the environmental variability and in part by the ecological dynamics (Levin, 1992). Because of their small size, planktonic organisms have a limited ability to swim against currents, allowing their distribution to be strongly influenced by ocean circulation patterns. At small scales and mesoscales, turbulent motions generate patchiness (e.g. Flierl and McGillicuddy, 2002; Abraham, 1998). Clustering can also result from the actions and interactions of individuals (Levin, 1994; Young et al.,
2001). In particular, social behavior is responsible for the formation of dense aggregations in swimming organisms. These spatial patterns have significant effects on the structure and function of ecosystems (Steele, 1974; Hobson, 1989; Bracco et al., 2000; Brentnall et al.,
2003; Martin et al., 2002; Martin, 2003).
Social behavior refers to the tendency of individuals to move toward their conspecifics, which results in the formation of social groups. The behavior is observed in many kinds of animals, including larger species of zooplankton such as euphausiids (Mauchline, 1980; Folt and Burns, 1999; Hamner and Hamner, 2000). Also known as "krill", euphausiids are shrimp-like crustaceans found in pelagic waters throughout the world's oceans. Antarctic krill (Euphausia superba) is a notable example of zooplankton with social behavior. So-cial aggregations of krill (called swarms or schools) can be very dense, with up to 10, 000 individuals per cubic meter, and extend horizontally for several kilometers (e.g. Miller and Hampton, 1989; Hewitt and Demer, 1993). As a source of food for whales, seals, penguins, and other large predators, krill plays a central role in the Southern Ocean food web. Its eco-logical relevance has motivated numerous studies, both in situ and in laboratory settings, of the ecology and physiology of Antarctic krill. While these studies have contributed signif-icantly to understanding the species as well as the local ecosystem, the question remains: why has social behavior evolved so strongly in krill?
Distribution and behavior of Antarctic krill
Observations of the density distribution of krill in the Southern Ocean consistently show high levels of variability at a wide range of spatial scales. Non-random aggregations, which result not by chance but from biological and/or physical processes, occur throughout the year and over the whole geographical range of Antarctic krill. Hydroacoustic measure-ments have proven particularly useful for estimating the morphology, internal structure, and vertical position of such aggregations (Lawson, 2006). The smallest swarms have typical lengths of tens of meters and densities often exceeding 100 g/m3 (Kalinowski and Witek, 1985; Miller and Hampton, 1989). Aggregations tend to be larger, denser and
deeper during daytime than during the night (Lawson, 2006); swarms can reach densities of 1000 g/m3 and horizontal scales of a few kilometers (Hamner et al., 1983; Kalinowski and Witek, 1985; Miller and Hampton, 1989).
Variance spectra reveal that there is significantly more fine-scale structure in krill den-sity than in temperature or phytoplankton in the Southern Ocean (Figure 0-1). At scales of approximately 100 km, all spectra have the same slope, which suggests that ocean circula-tion controls the large-scale distribucircula-tion of the three tracers. At small scales, however, the spectrum of krill is flatter than the others; this implies that environmental variability is not the only factor generating patchiness in the density-distribution of krill, and that a different mechanism must explain the small-scale patterns (Levin, 1992). The scale at which the transition occurs is consistent with the observed length of krill swarms (< 10 km). The in-terpretation of these data is that social behavior is the main driver of small-scale variability in the density-distribution of krill.
The processes involved in the generation and maintenance of swarms can be investi-gated using a combination of data and models. Existing models of social aggregation in krill are either formulated as reaction-advection-diffusion equations (e.g. Flierl et al., 1999) or they are individual-based models (e.g. Flierl et al., 1999; Hofmann et al., 2004). Obser-vational and experimental data is used to constrain the parameter values in these models. Theory predicts that the size of social aggregations in zooplankton depends primarily on the swimming speed, the distance at which individuals can sense their neighbors, and the rate at which they are diffused (Flierl et al., 1999). Some of these parameters can be mea-sured directly (the swimming velocity) or indirectly (the sensing radius), while others are poorly constrained (the diffusivity).
Despite their relatively small size, Antarctic krill are strong swimmers: adults can main-tain cruising speeds of 0.08 - 0.15 m/s (Kils, 1982), which corresponds to roughly two body lengths per second. It is believed that individuals use visual methods to detect each other (Strand and Hamner, 1990). The distance at which individuals can respond to neigh-bors is difficult to measure, but can be estimated from the distance at which they avoid nets
Ill
10
-0.01 0.10
Cycles/kmn
1.00
Figure 0-1: Fourier spectra of the spatial distributions of temperature, fluorescence, and krill biomass in the Southern Ocean. Spatial scale increases from the right to the left. Temperature is an indicator of water movements; fluorescence is a proxy for phytoplankton activity. From Weber (1986), reproduced in Levin (1992).
or divers, from the morphology of their eye compound, or from model sensitivities. These methods yield maximum sensing distances of 0.2 m (Hofmann et al., 2004) to about 1 m (Lawson, 2006).
The tendency to swim toward neighbors that are within sensing range is, however, coun-terbalanced by the homogenizing effect of diffusion. Zooplankton individuals tend to dis-perse as a result of randomness in the swimming movements and of the turbulent mixing resulting from small-scale ocean circulation patterns. Social aggregations can only form if the attraction tendency is greater than the effective diffusion (e.g. Okubo, 1986). Diffusiv-ity, especially the movement-related component, is difficult to measure; this parameter is often adjusted in models so that self-organized aggregations can develop. When realistic values for krill behavior are used, simulated social aggregations have spatial scales of 10 m or less (Hofmann et al., 2004). These correspond to the smallest of observed swarms. The mechanisms though which swarms assemble into larger scale patterns are not known, but perhaps involve using the variability of the flow at different scales.
Why is social behavior a successful strategy?
Several hypotheses have been proposed to explain why social behavior has evolved in eu-phausiids. Benefits gained by aggregating include a higher probability of mating, improved foraging success, and reduced predation risk. Some of these ideas are supported by obser-vational evidence. In the species Nyctiphanes australis, swarming is seasonal and linked to breeding (Blackburn, 1980; O'Brien, 1988), suggesting that organisms aggregate in order to find mates. In the Southern Ocean, schools of Antarctic krill are observed to disperse rapidly when approached by underwater vehicles (Hamner et al., 1983; O'Brien, 1987), which is thought to be a strategy for escaping predator attacks by confusing the predator. Ritz (2000) has speculated that the hydrodynamics in schools might optimize the capture rate of suspended prey. Modeling studies also suggest that collective motions can improve ability to forage in a noisy resource field (Griinbaum, 1998; Wood and Ackland, 2006).
that available resources are shared with other group members. When in aggregations, krill are also more vulnerable to large predators that have evolved efficient strategies to detect and exploit groups (Nicol and O'Dor, 1985; Ritz, 1994): in the St-Laurent estuary, for example, mammals are attracted by aggregations of krill (Sourisseau et al.; de Lafontaine et al., 1991; Kingsley and Reeves, 1998) which might be induced by tidal currents (Cott6 and Simard, 2005); krill densities are generally high and patchy in regions where whales are observed (Simard and Lavoie, 1999). In addition, dense aggregations favor the spread of infectious diseases which can lead to mass mortality in krill (G6mez-Gutidrrez et al., 2003).
These ideas can be put into mathematical form to quantify the costs and benefits of social behavior and relatedly to address the question of why it has evolved so strongly in krill. Numerical simulations provide powerful tools for studying spatial ecosystems involving multiple interacting species with their distribution constantly changing in time.
Overview of thesis
To investigate the mechanisms and consequences of zooplankton patchiness, I develop and use numerical models that include swimming behavior, population dynamics, and some as-pects of environmental variability. First, I examine the density-dependence of reproductive success as a driver for the evolution of social behavior. The benefit associated with the proximity of mates trades off with the cost of intra-specific competition for resources. In
Chapter 1, I formulate a model that accounts for these two effects. The stage-structured
consumer-resource model includes a mating probability for the consumer, which is as-sumed to be a saturating function of the local density of mature conspecifics. In Chapters 2 and 3, I consider a spatial version of that ecosystem model to simulate the formation of social groups. The model is written as a set of reaction-advection-diffusion equations for the density of phytoplankton and krill. The advection term represents swimming behav-ior of the predator; a simple behavbehav-ior rule produces aggregations. Chapter 2 addresses
the success of the grouping strategy under different environmental conditions. The spa-tial distribution of zooplankton influences their ability to eat and to reproduce; whether aggregation behavior is overall a successful strategy depends on the balance of the costs and benefits. Chapter 3 focuses on the asymptotic dynamics of the patchy ecosystem in the absence of environmental variability. The steady-state density-distribution is solved numerically and compared to the solution obtained analytically from the weakly-nonlinear approximation to the model. In Chapter 4, I investigate the foraging success of a school-ing population. To this end, I construct an individual-based model for krill coupled to a continuous-field physical-ecological model that simulates the variability, in time and space, of the resource. The next chapters examine other external mechanisms that induce spatial and temporal variability in marine ecosystems. In Chapter 5, I analyze the transient re-sponse of consumer-resource models to external perturbations. In Chapter 6, I describe the biogeochemical variability in the Southern Ocean induced by large-scale climatic patterns. The main findings of each chapter are summarized in Chapter 7.
Predator-prey dynamics with
density-dependent mating success
Abstract
An Allee effect arising from density-dependent mating success is incorporated into mathematical models of predator-prey interactions. When the predator's life cycle is formulated as a two-stage model and coupled to a logistically-growing resource, reproduction and recruitment can be expressed as a transfer of biomass from the prey to the predator. The mating probability modulates the rate at which offsprings are produced, thus effectively reducing the predation rate in the model. The im-plications of nonlinearity in the mating function for predator-prey dynamics are investigated. Examination of the fixed points and bifurcations in the model reveals that enhancing the Allee effect can destabilize a locally stable equilibrium, stabilize oscillating dynamics, or cause catastrophic extinction of the predator population. The stage-structured model is compared to a model with a continuous weight dis-tribution; if the birth and growth rates are assumed to have a power-law dependence on weight, the continuous model reduces to a set of ordinary differential equations that behaves similarly to the discrete-stage predator-prey model with Allee effect.
1.1 Introduction: Allee effects
When individual fitness is positively correlated with the density of conspecifics, the pop-ulation growth rate increases with poppop-ulation size. This correlation is referred to as the "Allee effect" (after ecologist W.C. Allee) and is often cited as a possible cause of animal extinctions. In sexually-reproducing species, Allee effects arise from density-dependence of the mating success, the probability of encounters between potential mates being propor-tional to the local number of individuals (Dennis, 1989; McCarthy, 1997; Courchamp et al., 1999). Behaviors that induce local density enhancement, such as the formation of social groups, might have evolved because of their positive impact on the per capita reproduction rate (Stephens and Sutherland, 1999).
Allee effects can be incorporated into single-species population models by simply mul-tiplying the reproduction function by the probability of successful mating (Boukal and Berec, 2002). The density-dependence affects the population dynamics (e.g. Scheuring, 1999; Schreiber, 2003). Multi-species and spatial models with Allee effects also reveal sig-nificant implications for predatory interactions (Kent et al., 2003; Webb, 2003; Zhou et al., 2005) and biological invasions (e.g. Lewis and Kareiva, 1993; Taylor and Hastings, 2005). Here I investigate the effects of density-dependent reproduction on the dynamics of predator-prey models. A classical formulation for predator-prey interaction is the Rosen-zweig and MacArthur (1963) model,
dP dP = rP 1 - P P\ G(P)Z (1.1) dt K dZ - EG(P)Z - dZ (1.2) dt
where P is the prey population and Z the predator population. It can be employed to de-scribe the dynamics of planktonic ecosystems, in which case the prey represents a primary producer (phytoplankton) and the predator is an herbivore (zooplankton).
are abundant, is expressed as a Holling-Type II function, G(P) = g P where g is the maximum predation rate and Ph is the half-saturation prey density; e is the assimilation efficiency, and d is the mortality rate. The model assumes logistic growth for the prey, with r the maximum growth rate and K the carrying capacity. Dynamics of systems of the form (1.1-1.2) have been thoroughly investigated (e.g. May, 1972; Gilpin, 1972; Myerscough et al., 1996; Kot, 2001). The basic structure of the model has also been adapted to take into account spatial heterogeneity, higher-order trophic levels, etc. To include Allee effects in the predator population, Bazykin (1998; reproduced in Webb, 2003) and Zhou et al. (2005) multiply the predator growth term in (1.2) by the density-dependent probability of reproducing (see Section 1.4.3).
A different approach is adopted here for constructing predator-prey models with non-linear life cycle processes. In a structured population model, reproduction and growth can be viewed as processes generating biomass. This view is emphasized by associating de-velopmental stages with individual weight, so that organisms changing stage experience changes in their weight. Both discrete and continuous formulations are considered for the population structure. The simplest model has two discrete stages, corresponding to juvenile and adult organisms, which are born and recruited in continuous time. Knowing how much mass is gained by the predator population in a given time interval, it is possible to infer how much resources must have been consumed to produce it; that information is then used to formulate an equation for the population dynamics of the prey. This contrasts with the more conventional approach, which decouples developmental activities and inter-specific interactions (see e.g. Gurney and Nisbet, 1998); it provides a new way of constructing multi-species ecological models.
The chapter begins with a description of the discrete-stage predator-prey model in Sec-tion 1.2. Stability of the model equilibria is examined in SecSec-tion 1.3. In SecSec-tion 1.4, an equivalent standard predator-prey model is derived by reformulating the structured model in terms of a single-stage predator population; differences with other published models that include the Allee effect only in the equation for the predator are highlighted. In Section 1.5,
it is shown that consistent results are obtained when a continuous-weight model is used to describe the dynamics of the predator population. Results are briefly discussed in Section
1.6.
1.2 Stage-structured model
Consider a stage-structured population for the predator, with a life cycle consisting of ju-venile and adult stages. The life cycle is represented schematically in Figure 1-1: birth of new individuals supplies the juvenile stage, during which organisms develop; if they survive, they are recruited into the adult stage, where they reproduce and eventually die. Reproduction and maturation are assumed to be food-dependent processes, so that birth and recruitment rates are limited by the availability of resources. The birth rate can also be a function of adult density; the mortality rate is assumed to be constant.
Mathematically, this is expressed as
dN = B(P, Na)Na - Q(P)Nj - djNj
(1.3)
dN
= Q(P)Nj - daNa (1.4) dt
where N is the number of individuals, with subscripts j and a referring to the juvenile and adult stages, respectively; P is the prey density, B is the birth rate,
Q the recruitment rate,
and d the mortality rate.When thinking about resource consumption, it is useful to convert the number of in-dividuals into predator biomass. If inin-dividuals in the juvenile and adult stages have an average weight of wj and wa, respectively, with the total biomass given by Z = wN, we
write dZ wB( dZj= B(P, Za)Za - Q(P)Zj - djZj (1.5) dt Wa dZa wa = Q(P)Zj - daZa (1.6) dt wi
From the equations above it is evident that the increase of adult biomass through recruit-ment exceeds the amount of biomass removed from the juvenile stage, the ratio wa/wj be-ing greater than 1: in the discrete-stage formulation, recruitment implies a sudden weight gain. Similarly, newborn individuals acquire a finite mass. Assuming that this new biomass is taken out of the prey population, as illustrated in Figure 1-1, and that the transfer has ef-ficiency E, the equation for the resource is
dP rP 1 - - [ B(P, Za)Za + - 1 Q(P) Z (1.7)
where r is the maximum growth rate and K is the carrying capacity.
1.2.1 Density-dependent reproduction
To account for intraspecific density-dependence, the effect of adult population size is in-cluded in the birth function. The maximum birth rate is multiplied by the probability of mating, HI, which we write as a rectangular hyperbolic function (Boukal and Berec, 2002):
Z,
II(Za)
=
(1.8)
where c, referred to as the "Allee effect constant", is the density at which the probability of mating is 1/2. The magnitude of this parameter is a measure of the intensity of the Allee effect.
The mating success function (1.8) can be inferred from the probability for a female to encounter at least one mate during the reproductive period, assuming that the area searched
---
mortality -> I- - birth -[juveniles. - recruitment
->
adults J- mortalityFigure 1-1: Life cycle of the average weight of wj and wa, recruitment is taken out of the
a)
0 2 €-0 0, 0 02-stage predator population. Juveniles and adults have an respectively. Generation of new biomass through birth and resource. 2 0 0 0a .I-0 1 2 3 predator biomass (Z) 1 2 predator biomass (Z)
Figure 1-2: Growth rate versus population size in a single-stage population with density-dependent mating success (c > 0, black curves) or constant mating success (c = 0, gray curves) and linear mortality. a) population growth rate, b) per capita growth rate. Negative feedbacks that would slow down growth at high density are not taken into account.
by females, A, is an exponentially distributed random variable (Dennis, 1989). Following Dennis (1989), we write the probability of encountering no mates as e-m pAZ., where p is
the ratio of males to females and m is a constant with units of m-kg- 1.
Define S - mpA, with probability density function f(S). Assuming that a single encounter is sufficient for the full reproductive potential to be realized and that p is constant, the probability of successful mating is obtained by integrating the probability of meeting at least one mate over all possible values of S:
1 -
e-szf(S)dS
(1.9)
The integral in (1.9) is the Laplace transform of f(S); it corresponds to the probability of not mating. If the probability density function of S is an exponential distribution,
1
f(S) <S>e-S/<S> (1.10)
where <S> is the mean value for the effective search area. Substituting (1.10) into (1.9) yields the function (1.8), with c =<S>- 1.
An alternative derivation of (1.8) can be obtained by considering "a 1 : 1 sex ratio and a monogamous mating system in which females compete for males" (Boukal and Berec, 2002); in that case the constant is inversely proportional to A, which is assumed to be the same for all individuals (McCarthy, 1997). The density-dependent effect on per capita and population growth rates is illustrated in Figure 1-2.
1.2.2 Full model and adimensionalization
For the dependence of the birth and recruitment rates on resource availability, a Holling Type II functional form is assumed. While this function is formally derived from consider-ations of prey handling time and predator attack rate, it is used here in a looser interpretation to describe variations in biomass production rate, from linear increase at low prey density
to saturation at high prey density. Using the mating probability described above, we write
P
Za
B=b P + Ph Za + c and PP + Ph
where b and q are maximum rates, and Ph is the half-saturation prey density. It is implied that the maximum recruitment rate, q, is a function of the ratio of weights Wa/Wj: the larger the ratio, the more time must be spent in the juvenile stage in order to gain enough weight to become an adult.
The ecosystem dynamics are given by the following three coupled differential equa-tions: dZ-3 = b P Zan - q P Z -dZ (1.11) dt Wa P +Ph P + Ph Z d dZa wa P dt - q P - daZa (1.12) dt wb P + Ph dP P = rP 1 - )
dt
K
b4 Za + a 1 Ph Zi (1.13)1E
w
P+ h
+
W
P+Ph
The structured predator-prey model is similar in some ways to the one proposed by Wang and Chen (1997) when there are no time delays (equation 3.1 in their paper). These authors also consider a two-stage structure for the predator, and assume that resource de-pletion is proportional to the rate at which juveniles are generated. Their model, however, does not include an Allee effect, not does it take into account uptake of resources by the juvenile class (included here in the recruitment term).
In (1.11-1.13), the Allee effect term appears in the equation for the prey; the num-ber of new juveniles depends on the mating success, hence so does the amount of re-sources required to produce this new biomass. Previous models have included the
density-dependence only in the predator equation (Bazykin, 1998; Zhou et al., 2005); these are discussed in Section 1.4.3. Omitting the mating probability (II) in the prey equation (1.13), however, implies that there is an unidentified sink for resources, a fraction of which leave the ecosystem without going through the predator population. This is different from the fraction 1 - e of resources that are ingested but not converted to juvenile biomass (these
resources leave the ecosystem as a result of predator respiration or excretion).
The system can be adimensionalized to facilitate the analysis. Prey biomass is scaled by Ph, juvenile and adult predator biomass are respectively scaled by ErPh/q and ErPhwa/bwj; time is scaled by r- 1. Lower-case letters indicate scaled variables. Dimensionless parame-ters are introduced:
r•?7 Wa/Wj 3 = b/r =- q/r 6 = d/r x =K/Ph
as well as A, which is simply the Allee effect constant c redefined. After substituting the expression for II, the non-dimensional system of equations is
dzj p0 za - z - bjzj (1.14) dr p+1 za+A I dza P zj - Jaza (1.15) dp = p 1 -a + (77- 1) z (1.16) dTr = p+1 za+A
The dynamics of this system are analyzed next. Stability of the fixed points will be examined in parameter space, focusing on the Allee effect parameter, A, the birth and re-cruitment parameters, 3 and 0, and what we refer to as the "enrichment parameter", X.
1.3 Asymptotic dynamics
The 3-compartment model has three fixed points: trivial extinction (p* = z* = za* = 0), extinction of the predator (p* = X, zj = z* = 0), and coexistence. The first is always
-n0 -2.5 0 real(z.) -01 3 0 1 2 5 4 ·0 0 real(za) -10 10 -n-I1-1 3! 5 2 1 40 0 real(p)
Figure 1-3: Solutions to the equation for the coexistence equilibrium, in the complex plane; a) juvenile predator density, b) adult predator density, c) prey density. Solutions labeled 1 and 2 are real and positive; 3 and 4 are complex conjugates; 5 has both positive and negative real parts. Parameters are
3
= 3, 0 = 1,6J
= 0.15, J6 = 0.1, X = 0.5, 77 = 2, A = 1.recruitment parameter (0)
Figure 1-4: Regions of stability in the stage-structured predator-prey model, in function of the birth parameter (3) and the recruitment parameter (0). Other parameters as in Figure 1-3. Thick lines indicate bifurcations.
0o3
5 1 2
0 4
E. I,
unstable, while the second is always stable for A > 0, a well-known consequence of the Allee effect.
The coexistence equilibria and their stability are examined numerically; details of the calculations are presented in Appendix 1.7.1. Equilibrium values are shown in Figure 1-3 for specific values of the model parameters. The system has five coexistence equilibria; at most two are real and positive, one is strictly negative, and the others come in pairs of complex conjugate. Solutions that are negative or imaginary are not biologically possible and will not be considered further. Stability depends on the parameters. We find that of the two possible coexistence equilibria, only the one corresponding to higher predator biomass can be stable; thus there can be a single coexistence attractor. Transitions from stability to instability are examined next.
1.3.1 Stability boundaries
The region of stable coexistence is shown in Figure 1-4, when all parameters are fixed but ,3 and 0. There are minimum values of the birth parameter and the recruitment parameter below which coexistence is not possible, and above which it is asymptotically stable. As these parameters are increased, the coexistence fixed point loses its stability and a stable limit cycle is created instead, thus allowing for oscillatory asymptotic dynamics.
Because of the structure in the predator population, stability of the coexistence equilib-rium is not highly sensitive to variations in 3 or 0 when they are not varied simultaneously. Multiple stable equilibria (Figure 1-4) are a consequence of the Allee effect; for some parameter values, initial conditions determine whether the system will reach asymptotic coexistence or extinction of the predator.
The various dynamical regimes are illustrated in Figure 1-5; asymptotic solutions are shown together with example of trajectories in phase space. For small values of 3 and 0, the extinction equilibrium is globally stable; there are no real and positive coexistence equi-libria. All initial conditions lead to extinction of the predator, while the prey density settles at the carrying capacity (Figure 1-5a). When the parameters are increased, two
equilib-a) W Cz C) Cz V' CO -9 U,
Figure 1-5: Phase portraits illustrating the dynamical regimes in the stage-structured predator-prey model; star symbol indicates steady state. a) 0 = 0 = 1, all initial con-ditions lead to extinction of the predator (there is no possible coexistence equilibrium). b) 0 = 0 = 2.5, the system reaches one of two possible equilibria, stable coexistence or extinction of the predator. c) = 0 = 10, the system either exhibits a limit cycle, or extinction of the predator occurs. d) /3 0 = 30, all initial conditions lead to extinction
of the predator after transient oscillations (both coexistence equilibria are unstable). Other parameters as in Figure 1-3.
ria appear as the result of a saddle-node bifurcation; one of them, the one associated with the highest predator biomass, is stable. Figure 1-5b shows two steady-states, one corre-sponding to stable coexistence and the other to extinction of the predator. The coexistence attractor becomes unstable when the values of 3 and 0 are large. The transition from sta-bility to instasta-bility occurs via a supercritical Hopf bifurcation; oscillatory dynamics appear as the system is attracted to a stable limit cycle, shown in Figure 1-5c. When the param-eters are further increased, the stable oscillator disappears and the extinction equilibrium becomes globally stable again. This results from a homoclinic bifurcation: the limit cycle merges with the low-density coexistence equilibrium and vanishes; all initial conditions then lead to extinction of the prey, as illustrated in Figure 1-5d. For most initial conditions, large transient oscillations are seen before the extinction equilibrium is reached. Unlike in the slow birth and recruitment scenario (Figure 1-5a), the system has two coexistence equilibria, but they are not stable.
1.3.2 Imposing structure in the population
Can the structured model be simplified by assuming that the proportion of adults and juve-niles in the population is constant? In (1.14-1.16), the ratio of juvenile to adult biomass,
R - zj/za, evolves according to
_R 1
8zj
zj 8za87
z,
,7
z8,2,7
= - P R20 P za R)+(6a - 6j)R (1.17)
p+1 p+1
za+A
In steady-state, the ratio is
R* = 0 ( - Ja) - + (6 - a) + 0 Za (1.18)
C,)
C,
0.4
0 50 100 150 200
Figure 1-6: Left: time series of adult biomass. Sustained oscillations in the 3-compartment model (gray curve) disappear when the population structure is assumed to be fixed (black curve, from equations 1.19-1.20). Parameters are 0 = 10, 0 = 2, r = 2, X = 0.8, bj = 0.3,
6a = A = 1. Right: the corresponding trajectories in phase plane, showing a limit cycle and an attractor.
By substituting this in equations (1.15-1.16), we can derive an equivalent standard predator-prey model, in which the population structure is fixed:
dzp p(1_ :E)
dzT -- P R*za - aza (1.19)
dp p+ z1
d• = p 1- p + (+ - 1) R*za (1.20) The coexistence equilibria are the same as in the full, structured model; however the sta-bility properties are different, as shown in Figure 1-6. Parameters that lead to stable os-cillatory behavior in the structure model lead to a stable equilibrium in the constant ratio version (1.19-1.20). This indicates that imposing structure in the population affects the predator-prey dynamics. A different approach for formulating a two-dimensional model is examined in the next section.
' ''' ' ''' ''' '' · · .. .. · ·
1.4 One-stage limit
Most predator-prey models do not distinguish between the different stages of predator de-velopment (but see e.g. Persson et al., 1998; de Roos et al., 2003), and to investigate the dynamical consequences of the Allee effect it is useful to formulate an unstructured version of the model which can be directly compared to popular models of interacting species. In this section, the population structure is "deconstructed" by projecting the predator equa-tions onto a single-stage population model.
Let's assume that juvenile and adult organisms differ only by their body mass, ignoring all other characteristics such as the ability to reproduce or to capture prey. The matura-tion process then implies nothing else than a weight gain, and the rate of recruitment is inversely proportional to the weight difference between stages. By assuming that juveniles and adults have the same weight, we then effectively remove all information on the popu-lation structure. To investigate this, it is convenient to return to the dimensional equations (1.11-1.13).
In the limit wa/wj = 1, recruitment occurs very rapidly, so that q -+ oc. This leads to
q Ph > d, so that the last term in (1.11) can be neglected. Then, in steady-state,
bZ
Zi = - Za+ (1.21)
qZa + c Substituting in (1.12) and (1.13) yields
dP
= rP 1- - (1.22)dt K K P+PhZa+c
dZa P
Z
2= b Za -dZa (1.23)
dt
P + Ph Za + c
This system of equations is analogous to (1.1-1.2), with the function G(P) replaced by
b P Za
G(P, Za) a (1.24)
Table 1.1: Equilibrium densities in the 2-stage model and the equivalent standard (unstruc-tured) model. Parameters: wj = w, = 1, E = 0.5, b = 2, d = 0.1, r = 1, K = 1.5, Ph = 3, c = 1. The coexistence equilibrium is stable for all values of q.
structured model standard pred/prey model
q = 2 q = 20 q = 200
P* 0.88 0.58 0.54 0.53
Z* 0.75 0.12 0.01
Z* 1.71 1.93 1.96 1.96
that is, the predation function is multiplied by the probability of mating. Note that the probability function appears in the equation for the prey as well as in the equation for the predator. In this case G(P, Za) is interpreted as production of biomass through reproduction (adults are giving birth to new adults), and the newly generated biomass is taken out of the resource.
Numerical simulations confirm the agreement between the stage-structured model (1.11-1.13) with Wa = wj, and the equivalent standard predator-prey model (1.22-1.23), when the recruitment rate is large (Table 1.1). The equilibrium predator biomass (juvenile + adults) is underestimated in the unstructured model.
The system (1.22-1.23) is asimensionalized as in Section 5.4.1.2. Dropping the sub-scripts, we get d- = p 1- (1.25) d7 X p+lz+A dz = p p z2 - 6z (1.26) d7 p+lz+A
I will refer to this system of equations as the "modified Rosenzweig-MacArthur model"; the standard version of the model is retrieved when A = 0, i.e. when density-dependence of the mating success is suppressed.
prey
0.5
prey
Figure 1-7: Basin of attraction for the coexistence equilibrium, for different values of the enrichment parameter; from top to bottom: X = 0.45, X = 0.8, X = 1.5. Thick lines show the saddle's manifolds; black dots indicate attractors; half-filled circles, saddle points; an empty circle, a repellor. Thin line in bottom plot shows a trajectory with initial condition near the unstable equilibrium, being attracted to the limit cycle. All initial conditions within the area delimited by the stable manifold lead to coexistence. Other parameters are / =
A = 1, 6 = 0.1. a) x = 0.45 b) x = 0.8
4
,,,,,, 2 .0 0.4 0.6A
allows three coexistence equilibria; calculation of the fixed points and their stability is in Appendix 1.7.2.
1.4.1 Bifurcations and multiple equilibria
Although the number of coexistence equilibria has been reduced from five to three, the dynamics of the predator-prey system (1.25-1.26) are qualitatively the same as for the stage-structured model. The trivial equilibrium is always unstable; extinction of the predator is always stable. Of the three coexistence equilibria, at most two are real and positive, and of those two, only the corresponding to high predator density can be stable (and if it is not stable, a stable limit cycle may exist). The low-density equilibrium is a saddle-point: it attracts trajectories along its stable manifold, and repels them along the unstable manifold.
When there are multiple possible asymptotic behaviors, the initial conditions determine the outcome of the predator-prey interactions. In the 1-stage model, the saddle-point's stable manifold delimitates the basins of attraction for coexistence and extinction. The stable manifold, drawn by integrating the model backwards in time with initial conditions close to the saddle point, is shown in Figure 1-7 for various values of X. The enrichment parameter affects the value of the fixed points, as well as the stability of the high-density coexistence equilibrium. Although increasing X leads to destabilization of the coexistence attractor (the so-called paradox of enrichment), it also enlarges the basin of attraction of the coexistence asymptotic state. By reducing the region of phase space in which trajectories are attracted to the extinction fixed point, enrichment thus contributes to sustaining predator populations that are subject to an Allee effect.
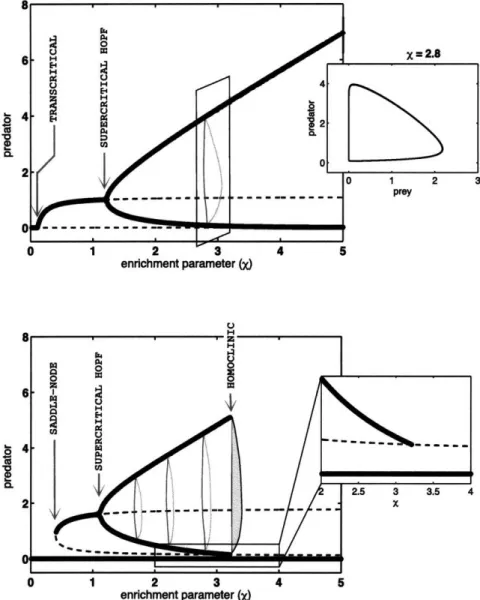
The bifurcations resulting from varying the parameter X in the model with Allee effect are shown in Figure 1-8, bottom panel. It is compared with the bifurcation diagram of the equivalent Rosenzweig-MacArthur model obtained by setting A = 0, shown in the top panel. Coexistence is the only possible asymptotic behavior for most values of the enrich-ment parameter in the model without Allee effect. For large values of X, there is a stable limit cycle; the amplitude of the cycle decreases with the parameter, until it collapses to a
0-'U
0
0 1 2 3 4 5
enrichment parameter (x)
Figure 1-8: Bifurcations in predator-prey models with and without Allee effect; the enrich-ment parameter is varied. Dashed lines indicate unstable equilibria; solid lines are obtained from numerical integration of the model. Top: A = 0; the extinction equilibrium loses its stability as the coexistence equilibrium becomes stable, via a transcritical bifurcation. A limit cycle appears for sufficiently large values of X as a result of a supercritical Hopf bifurcation; the oscillatory dynamics are represented in the Figure as two thick black lines, showing the minimum and maximum values of the predator population in the simulation, after transients have died out. A cross-section of the diagram shows the limit cycle (in-set). Bottom: A = 1; two coexistence equilibria appear through a saddle-node bifurcation. A limit cycle results from a supercritical Hopf bifurcation, but disappears for large val-ues of X. Inset shows in more details the collision of the limit cycle with the low-density coexistence equilibrium in a homoclinic bifurcation.
E
0.
.-Allee effect parameter (.)
Figure 1-9: Dynamical regimes of the model for different values of the Allee effect param-eter (A) and the birth parameter (P). Solid black lines bound the region of stability of the coexistence equilibrium. Lower curve indicates a saddle-node bifurcation; below it, extinc-tion of the predator is the only attractor. Higher black curve indicates a super-critical Hopf bifurcation; above it, the coexistence equilibrium exists but is unstable. The dashed gray line represents a homoclinic bifurcation, and delimitates the region of existence of a stable limit cycle; the curve is drawn based on results from numerical experiments. Parameters are X = 0.8, 6 = 0.1.
stable equilibrium in a supercritical Hopf bifurcation. As X decreases more, the equilib-rium predator density decreases until it meets the extinction equilibequilib-rium, to which it loses its stability in a transcritical bifurcation.
In the model with Allee effect, the transcritical bifurcation is replaced by a saddle-node bifurcation, and the coexistence attractor disappears suddenly when X decreases, leading to catastrophic extinction of the predator population. A homoclinic bifurcation occurs for larger values of X, when the stable limit cycle collides with the saddle point and disappears; the oscillating predator-prey system then experiences sudden extinction of the predator.
1.4.2 Destabilization due to Allee effect
The bifurcations discussed above are shown in a two-dimensional parameter space (Figure
1-9). The position of the saddle-node and Hopf bifurcations is found analytically:
be-cause they are associated with loss of stability of the coexistence equilibrium, they take place when the leading eigenvalue of that equilibrium's jacobian goes through zero. The homoclinic bifurcation is found numerically.
As evidenced in Figure 1-9, adding an Allee effect can have a significant impact on the stability of the ecosystem, compared to the standard case without density-dependent reproduction. For very small values of the parameter
3,
the stable coexistence equilibrium, which is stable when A = 0, disappears when an Allee effect is introduced, leading thepredator population to extinction. Similarly, increasing the value of A from 0 can destabilize a limit cycle, for large values of 0, with the same catastrophic result for the predator. For intermediate values of
3,
Allee effects can destabilize the stable coexistence and induce oscillatory dynamics. This is in agreement with previous study arguing that Allee effects are destabilizing for predator-prey interactions (Zhou et al., 2005). On the other hand, in a system with weak density-dependence (A < 1), increasing the Allee effect parameter can actually stabilize the coexistence equilibria, or even allow survival of a predator population otherwise doomed to be extinct.1.4.3 On the Allee effect term in the prey equation
The dynamics of our single-stage model are qualitatively similar to the dynamics of the models of Bazykin (1998) and Zhou et al. (2005). These authors also formulate predator-prey models with Allee effect for the predator, but do not include the Allee effect term in the prey equation. To compare the two formulations, let's write
dp = p 1 - z (1.27)
dr
p
+1
dz
p
z
2- = 0 p- + z 6z (1.28)
with
z
Z ± model A (1.29)
F = 1 model B (1.30)
Model A is the modified Rosenzweig-MacArthur model (1.25-1.26). Model B has two co-existence fixed points (see Appendix 1.7.B). Although model A has one more fixed point, that equilibrium is always negative; thus there are no major differences in qualitative be-havior between the two models, i.e. they exhibit the same bifurcations in parameter space. However, there are significant quantitative differences; bifurcations occur for different val-ues of the model parameters (Figure 1-10), and the equilibrium valval-ues of predator and prey biomass differ (Figure 1-11).
From Figure 1-10, it is clear that including the Allee effect in the prey equation affects the asymptotic behavior of the model. For example, with A = 5, - = 2, this version of the model supports a stable limit cycle, but when the Allee effect term is omitted in the prey equation, extinction of the predator is the only possible steady-state. Also, the extinction boundary (saddle-node bifurcation) is less sensitive to the Allee effect parameter in model A; compared to model B, larger variations in A are required for catastrophic extinction of the predator.
The equilibrium zooplankton biomass can be significantly higher in our model, as shown in Figure 1-11. Another interesting difference is that increasing A always results in a decrease in predator biomass in model B, whereas it can have the opposite effect in
model A. Although it is counter-intuitive that the biomass increases when reproduction rate is reduced, a similar effect arises in the standard predator-prey model (1.1-1.2) when the predation rate is increased: slowing down predation allows for higher prey density at equi-librium which, depending on parameter values, may enhance the per capita growth rate of the predator population. This is unlike reducing the assimilation efficiency, which always causes the equilibrium predator population to decrease (see Appendix 1.7.3).
Allee effect parameter (Q)
Figure 1-10: Regions of stability for the coexistence equilibrium. Black: this model. Gray: Allee effect term is not in the prey equation. Lower curve is saddle-node bifurcation
(S-N); higher curve is supercritical Hopf bifurcation (H). Stable coexistence of the prey and
predator is possible between the two curves. Parameters are X = 1, 6 = 0.1.
0
0.
0 2 4 6
Allee effect parameter (X)
8 10
Figure 1-11: Equilibrium predator density; stable (solid lines) and unstable (dashed) equi-libria. Limit cycles are not shown. Black: this model. Gray: Allee effect term is not in the prey equation. Predator extinction is always stable in both models. Parameters:
SA
In model B, the derivative
&Z*/OA,
calculated in Appendix 1.7.3, is strictly negative; thus increasing the strength of the Allee effect is qualitatively equivalent to reducing the assimilation efficiency. In contrast, because it appears in both equations in model A, the Allee effect term effectively decreases the predation rate. The derivative c9Z*/OA is positive for small values of A, and can change sign when the Allee effect parameter is increased; this is analogous to the effect of varying the predation parameter 3 in the model without Allee effect, as discussed in Appendix 1.7.3.Thus we can think of an effective predation rate, inversely proportional to the Allee effect parameter,
Z +
z±A
and the sensitivity of the predator equilibrium biomass to A is qualitatively similar to the sensitivity to 3eff. When the effective predation rate is low (strong density-dependence in mating success), the population size increases with 3eff; however because enhanced pre-dation causes a decline in the standing prey density, the equilibrium prepre-dation population decreases when 3eff increases when the the effective predation rate is large. This is illus-trated in Figure 1-11.
1.5 A continuous-weight model with power laws for birth
and growth
In the single-stage projection of the predator-prey model, an Allee effect arising from non-linear mating success translates into density-dependent predation, with important conse-quences for the dynamics of the two interacting populations. In deconstructing the popula-tion structure, however, we have lost all informapopula-tion on the uptake of resources by growing organisms. A different approach consists of formulating a model for the integrated biomass in a population with a continuous distribution in weight space; this is examined here. For specific forms of the growth and reproduction function, the continuous-weight model
re-duces exactly to a standard form of predator-prey model, analogous to the one obtained in the previous section.
The McKendrick-von Foerster equation is adapted to describe the dynamics of a weight-structured population. With n = n(w, t) the number density per unit weight, we have
8n 8
+ - G(w, P)n = -dn (1.31)
Tt
+w-with boundary condition
G(WB, P) n(wB, t) = B(w, P) I n(w, t) dw (1.32)
representing the birth process; WB is the weight at birth; G is the growth rate, d the mortality rate, B the birth function, and II the mating probability.
Growth and birth are separated into a weight-dependent part and a resource-dependent part. We assume that limitation by the availability of resources can be expressed as a Holling type II function;
P G(w, P) = g(w) (1.33)
P + Ph
P B(w, P) = b(w) (1.34)P + Ph
The mating probability can be written as a rectangular hyperbolic function of an arbi-trary moment of N. For simplicity, we assume that is is related to the a2 moment
II
=
N2 (1.35)N,, + c
For the weight-dependence, we assume power laws. Let
g(w) = go w"a (1.36) b(w) = bow12
where al and a2 are non-negative integers. The boundary condition (1.32) then becomes
go WB fn(wB, t) = bow 2 II n(w, t) dw (1.38)
Now, make use of the definition of central moments
Nm
-
Wmn dw
(1.39)
Nm is the mth raw moment of the number distribution. No is the total number of individu-als; the first moment, N1, gives the total biomass. The ratio N1/No is the mean weight of
individuals in the population. Similarly, higher moments (N2/No, N3/No, and N4/No) can
be related to the variance, skewness and kurtosis of the distribution, respectively. Multiplying (1.31) by wm and integrating by parts yields
dNm dm = bo P P
Wm I N2 + m 90 ---- Nm-l+, - dNm (1.40)
dt P + PhW P + P(
assuming d to be constant. The partial differential equation has been transformed into a set of ordinary differential equations.
From the equation for the first moment, we can infer the amount of predator biomass generated; it is given by the sum of the birth and growth terms:
P
APuptake =- P (b wB INO2 90 Na-1) (1.41)
As before, it is assumed that this new biomass comes from ingestion of resources. We can then write an equation for the prey, which is assumed to grow logistically in the absence of predators;
dP
(
P\ 1
dP= rP 1 P) - (APuptake) (1.42)
dt K 6
Closed set of equations can be obtained for a, = 0 and a, = 1. When the growth rate is independent of weight (a1 = 0), then (1.40) yields a recursive relation between a2 + 1
equations.
When the growth rate is a linear function of weight (al = 1), we get a system of at
most 3 ordinary differential equations:
dN1 P P = bo WB IIN, + 2 go N - dN1 (1.43) dt P+Ph P+Ph dt P+ P P + P dPN
d--=rP 1
-
P 1 P + o 2bo
Na2
+N)
(1.45)
dtP
+
Ph (
This three-dimensional system bears some similarities with equations (1.11-1.13), es-pecially if the value of a2 is greater than 1 because then more mature (heavier) individuals have a larger birth rate than young ones. The bifurcations structure of these equations is not discussed here, but could be addressed in a future study.
In the special case a2 = a1 = 1, the model (1.43-1.45) reduces to a two-dimensional
system of equations. These can be adimentionalized as in Section 5.4.1; we define =
bo/r, y _ go/r, and use z for the scaled predator biomass; weight is scaled by wB. This yields dz p z2 p dz= 0 p +z - 6z (1.46) dr p+1z+A p+1P d- =p ~ 1 - p Z) (1.47) dr X p+1 z+A)
-These equations are similar to the one-stage model (1.26-1.25) but with an extra term involving y, and exhibit the same dynamical behavior. We can also rearrange these equa-tions to get dz= P z - 6z (1.48) d pp+p = p 1 - zE (1.49) d X p+l p 1