HAL Id: hal-02353028
https://hal.archives-ouvertes.fr/hal-02353028
Submitted on 7 Nov 2019HAL is a multi-disciplinary open access archive for the deposit and dissemination of sci-entific research documents, whether they are pub-lished or not. The documents may come from teaching and research institutions in France or abroad, or from public or private research centers.
L’archive ouverte pluridisciplinaire HAL, est destinée au dépôt et à la diffusion de documents scientifiques de niveau recherche, publiés ou non, émanant des établissements d’enseignement et de recherche français ou étrangers, des laboratoires publics ou privés.
Insights on the unique electro-catalytic behavior of
PtBi/C materials
B.S.R. Kouamé, S. Baranton, Pascal Brault, C. Canaff, W. Chamorro-Coral,
A. Caillard, K. de Oliveira Vigier, C. Coutanceau
To cite this version:
B.S.R. Kouamé, S. Baranton, Pascal Brault, C. Canaff, W. Chamorro-Coral, et al.. Insights on the unique electro-catalytic behavior of PtBi/C materials. Electrochimica Acta, Elsevier, 2019, 329, pp.135161. �10.1016/j.electacta.2019.135161�. �hal-02353028�
Insights on the Unique Electro-Catalytic Behavior of PtBi/C Materials
B. S. R. Kouamé1, S. Baranton1, P. Brault2, C. Canaff1, W. Chamorro-Coral2, A. Caillard2, K.
De Oliveira Vigier1, C. Coutanceau1,*
1IC2MP, UMR CNRS 7285, Université́ de Poitiers, 4 rue Michel Brunet TSA 51106, 86073
Poitiers, Cedex 9, France.
2GREMI, UMR 7344, CNRS - Université d'Orléans, BP 6744, 45067 Orléans Cedex 2,
France.
Contact : [email protected]
Abstract:
Molecular dynamics simulations have been performed to study the growth and the final
structure of PtxBi1-x clusters under conditions close to those encountered in classical low
temperature chemical or physical synthesis methods, such as the water-in-oil route or plasma
sputtering route, respectively. According to the simulations, PtxBi1-x nanoparticles should
consist in well crystallized Pt core surrounded by Bi structures, with strong interaction between
Pt and Bi atoms. The simulation results were compared with physicochemical
characterizations of PtxBi1-x/C (x = 1.0, 0.9 and 0.8) materials synthesized at room temperature
via the water-in-oil microemulsion method. XRD and XPS measurements led to the conclusion
that Pt and Bi were not alloyed in PtxBi1-x nanoparticles and that the nanoparticle surface was
bismuth-rich, respectively, in perfect agreement with molecular dynamics simulations. XPS
and electrochemical measurements allowed also demonstrating a strong electronic interaction
between Pt and Bi, still in agreement with molecular dynamics. The electrocatalytic behaviors
of the PtxBi1-x/C catalysts have been studied. PtxBi1-x/C displayed the higher activity towards
glycerol electrooxidation in alkaline media, with an onset potential of ca. 0.300 V vs RHE and
a unique selectivity towards glyceraldehyde/dihydroxyacetone formation for potentials lower
* ISE member
than 0.600 V vs RHE. A discussion on the relationship between composition/structure of the
PtxBi1-x catalytic materials and activity/selectivity for glycerol electrooxidation allowed
proposing a mechanism involving a single-carbon adsorption mode on Pt and an electronic
effect for the desorption of low oxidized species from Pt sites driven by the early stage of the
Bi0 to BiII transition.
Key-words: Activity, Bismuth, Electrooxidation, Glycerol, Molecular dynamics, Nanoparticles, Platinum, Selectivity
1. Introduction
With the depletion of fossil carbon, the use of renewable carbon which can come from
vegetable oils or lignocellulosic biomass has received increasing interest. These feedstocks are
rich of carbohydrates (cellulose and hemicellulose) in the case of lignocellulosic biomass1,2,
which are non-edible biopolymers coming from agriculture waste for instance, and of glycerol,
which is a by-product of the production of biodiesel3,4, in the case of vegetable oils. The
conversion of these polyols and carbohydrates into value-added products has been extensively
studied5 - 8 owing to the large availability of these compounds. They are therefore now
considered as green raw materials and platform molecules for the industries of the future.
Amongst all chemical reactions that can be performed from polyols and carbohydrates,
selective oxidation reactions are very promising routes to synthesize building blocks for
surfactants and polymers, as examples. Therefore, all oxidized species derived from
bio-sourced polyols and carbohydrates are recognized to have important industrial interests6,7.
However, strong oxidants, such as chromic acid, nitric acid or permanganate, have been used
to perform oxidation reactions, but they are considered environmentally non-friendly and they
led to non-selective formation of many undesired compounds5,9. It is still required to propose
cleaner processes to selectively oxidize polyols/carbohydrates, that is the reason why catalytic
and electrocatalytic methods have been developed. Recently, the development of
electrocatalytic systems working either under direct fuel cell or electrolysis cell
configurations10-15 have received more and more attention.
In this context, platinum-bismuth (PtBi) and palladium-bismuth (PdBi) materials have been
extensively studied for several decennia owing to their high catalytic activity towards
controlled electrooxidation reactions of alcohols, polyols and carbohydrates5,13, 16 , 17. Intermetallic PtBi nanoparticles have also been shown to display high electrocatalytic activity
necessitated either 9-12 h at reaction temperature of 735 °C18or three days at reaction
temperatures between 145 and 160 °C19. However, PtBi catalytic materials must be produced
with time and energy savings, i.e. at low temperature using rapid chemical or physical methods,
such as spontaneous adsorption of Bi at the Pt nanoparticle surface, redox surface reaction,
plasma co-deposition, etc. Colloidal methods are very interesting routes to obtain PtBi
nanoparticles (NPs) under mild experimental conditions through wet chemistry synthesis.
Amongst these colloidal methods, the water-in-oil microemulsion method has been shown to
be very easy to implement and adapted for a wide family of metals.
The modification of Pt nanoparticles by bismuth has been shown to enhance the catalytic
activity for glycerol oxidation and electrooxidation, and to orient the selectivity towards low
oxidized species such as dihydroxyacetone and glyceraldehyde by both catalytic and
electro-catalytic oxidation processes5,13,16,20. In the case of the electrocatalytic oxidation of glycerol,
as an example, the onset potential was decreased by ca. 0.200 V on Pt0.9Bi0.1/C in comparison
with that on Pt/C13,20.
This unique catalytic behavior of PtBi catalysts must be understood with the scope of the
optimization of electrooxidation reactions in terms of conversion yield, selectivity and
efficiency. To achieve this, it is necessary to know the exact structure of the catalytic materials.
This can be achieved by modeling the nucleation and growth process of PtBi nanoparticles to
obtain information on the final structure and by comparing these results with experimental ones
obtained from a comprehensive characterization of the catalytic materials. Such information
could help to design the best material in terms of composition and structure. Herein, we will
use molecular dynamics simulations to study the growth of PtxBi1-x clusters under conditions
close to those encountered in classical low temperature chemical or physical synthesis
methods, such as the water-in-oil microemulsion or plasma sputtering routes, respectively. The
= 1.0, 0.9 and 0.8) materials synthesized by wet chemistry. At last, a discussion on the
relationship between composition/structure of the PtxBi1-x catalytic materials and
activity/selectivity of the glycerol electro-oxidation reaction will be proposed.
2. Experimental
Synthesis of carbon supported Pt, Pt0.9Bi0.1 and Pt0.8Bi0.2 nanomaterials.
PtxBi1-x/C catalysts were prepared by mixing sodium borohydride (99%, Acros Organics)
as reducing agent with a microemulsion carrying the metal salts (H2PtCl6 • 6 H2O, 99.9% purity
and anhydrous BiCl3, 99.9 % purity from Alfa Aesar) dissolved in ultra-pure water (MilliQ®
Millipore, 18.2 M cm). Brij®L4 (Sigma Aldrich) was chosen as surfactant and the organic
phase was n-heptane (99%, Acros Organics). Appropriate amounts of metal salts were
dissolved to obtain a concentration of 0.10 mol L-1 (Pt4+ + Bi3+). After the reaction process
with NaBH4, carbon powder (Vulcan XC72, Cabot Corporation) was added in the colloidal
solution to obtain a nominal loading of 40 wt% metal on carbon and the mixture was kept under
sonication for 1 h. The mixture was filtered on a 0.22 µm hydrophilic PVDF membrane filter
(Durapore®, Millipore), rinsed with acetone and ultra-pure water. The carbon-supported
catalyst was dried overnight in an oven at 75 °C.
Physicochemical characterization catalysts.
TGA. Thermogravimetric analyses were carried out with a TA Instrument SDT Q600 to determine the actual metal loadings of catalytic powders. Catalytic powder (ca. 3 mg) was put
in an alumina crucible and heated under air from 25 °C to 900 °C with a temperature slope of
5 °C min-1.
ICP-OES. Inductively Coupled Plasma – Optical Emission Spectroscopy measurements were performed using a Perkin-Elmer Optima 2000 DV.
AAS. Atomic absorption spectroscopy analyses were carried out with a Perkin Elmer AA200 Atomic absorption spectrometer.
TEM. Transmission electron microscopy measurements were performed using a JEOL JEM 2100 (UHR) with a resolution of 0.19 nm. The size distribution of the Pt-NPs as well as their
mean particle size were determined using the Feret’s diameter from the counting of 500 isolated NPs using the ImageJ free software.
XRD. XRD patterns were acquired using PANalytical Empyrean X-ray diffractometer. Measurements were performed from 2θ = 20 ° to 2θ = 140 ° in a step mode, with a step interval
of 0.06 ° and a fixed acquisition time of 10 s at each value of 2θ. All XRD patterns were
analyzed using the Levenberg−Marquardt method and deconvoluted using a pseudo-Voigt
fitting by means of a computer refinement program (Fityk)21.
XPS. XPS spectra were collected using a VG ESCALAB 3 MKII spectrometer using a monochromatized Mg Kα radiation (1253.6 eV). The source is operated at 300 W (15 kV and
20 mA). Powder analysis covered a surface of 2 mm × 3 mm. The binding energies are lined
up with respect to the C 1s peak at 284.6 eV. The fits of the XPS spectra are carried out using
a Shirley function for the background.
Electrochemical study of catalysts. Measurements were performed at 293 K in a conventional three-electrode electrochemical cell using a reversible hydrogen electrode (RHE)
and a glassy carbon plate (3 cm2 geometric surface area) as reference and counter electrodes,
respectively. The working electrode was prepared by dispensing a catalytic ink onto a glassy
carbon disc (0.071 cm-2 geometric surface area). The catalytic ink consisted in the dispersion
of 17.7 mg of catalytic powder in 2.117 ml of ultra-pure water, 0.529 mL of 2-propanol
(LC-MS CHROMASOLV®, Fulka) and 0.354 mL of Nafion® solution (5 wt% Nafion®
perfluorinated resin solution in aliphatic alcohols). After homogenization in an ultrasonic bath
(about 50 seconds), 3µL of catalytic ink was deposited on the freshly polished glassy carbon
First, nine cyclic voltammograms (CVs) were performed between 0.05 V and 1.00 V vs.
RHE at the scan rate of 50 mV s-1 until stable CVs were obtained. Then, the 10th cyclic
voltamograms were recorded between 0.05 V and 1.20 V vs. RHE in N2-purged 0.1 M NaOH
(Semiconductor Grade 99.99%, Aldrich) supporting electrolyte with a Model 362 Scanning
Potentiostat from Princeton Applied Research at 5 mV s-1.
Catalytic activity was studied by recording the stable third linear scan voltammograms at 5
mV s-1 in 0.1 M NaOH + 0.1 M glycerol (Reagent Plus ≥ 99%, Sigma Aldrich) solution in
ultra-pure water using a PGZ 402 potentiostat from Voltalab.
3. Results and discussion
3.1 Molecular dynamics simulation of the growth of PtxBi1-x clusters
Molecular dynamics (MDs) simulation is a very efficient method for the study of the growth
and properties of nanoparticles,22,23 because this method considers molecular scale processes.
Basically, all the trajectories of a specie (atom, molecule) are calculated using the Newton
second law, 𝑑 2
𝑑𝑡2𝑟⃗(𝑡) = −∇ ⃗⃗⃗⃗𝑉, where 𝑟⃗(𝑡) represents the instantaneous position of each atom and V is the interaction potential between interacting atoms. The most important inputs for
using such a calculation method are the expressions of interaction potentials and the set of
initial conditions expected to match or to be representative of experimental conditions.
The PtBi nanoparticle synthesis by the water-in-oil microemulsion method is carried out at
room temperature (25 °C). According the -Pt-Bi phase diagrams described by Okamoto24, at
so low temperature and low bismuth atomic ratios, the solubility of Bi in Pt is negligible, and
BiPt phases couldn’t be formed. Therefore, it is important to get insights on the structure of
materials because it will certainly drive electrocatalytic behavior of the catalysts. Because
water-in-oil microemulsion occurs in a rather complex system (metal salts, water, oil phase,
surfactant, reducing agent, hydrogen evolution during synthesis process, etc.), it is very
MDs simulations of PtBi material growth were carried out from plasma sputtering of platinum
and bismuth atoms. For the initial conditions, the calculations are intended to describe the
growth of PtnBi500-n nanoparticles, where n represents the number of Pt atoms in the
nanoparticle (n ≤ 500) in the configuration of a gas aggregation source25,26.
Briefly, a plasma is generated in a vacuum chamber by electrical breakdown between a
negatively biased, magnetized electrode (magnetron target) and the surrounded grounded
vessel in an argon low pressure atmosphere (10 Pa). Generated argon ions are bombarding the
target made of the elements to be sputtered (Pt and Bi). The Ar pressure is high enough that
the sputtered atoms can collide in the plasma creating nucleus which further continue to grow,
while the energy of bond formation is released to the ambient gas. The simulation box (Lx
Ly Lz = 16 16 16 nm3) is thus composed of a mixture of Ar, Pt and Bi atoms randomly
distributed, with typical ratios between Ar atoms and metal atoms in the vapor phase comprised
between 2 and 10 26. In agreement with our experimental setup, a value of 8 corresponding to
nAr = 4000 and (nPt + nBi) = 500, was chosen. The growth phenomena were studied for nPt =
400, 450 and 500 leading to clusters with atomic compositions of Pt0.8Bi0.2, Pt0.9Bi0.1 and Pt.
The inputs imply that the collision number in the simulations will be less or equal to the actual
one in real experiments and that the reactivity is not forced, if no event between two collisions
or interactions is considered, which applies for the definition of the mean free path. To mimic
the synthesis of PtBi nanomaterials by wet chemistry and to be as close as possible to the
experimental conditions, the temperature of 300 K was used for the MDs simulations. The
temperature of the Ar plasma was maintained around 300 K (with low fluctuations) by using a
Berendsen thermostat. By transporting and dissipating the energy of clusters bond formation
after collisions, the Ar atoms act as the solvent in the case of the synthesis of nanoparticles by
temperature at 300 K before 10 ns, as it is proven by the crystalline core of the Pt nanoparticles formed.
The next step consisted in defining the interaction potentials. The Pt-Pt and Bi-Bi interaction
potentials were treated by the very relevant Embedded Atom Method (EAM)27-31. The Pt-Bi
interaction potential was built using the mixing rules suitable for EAM potentials32. The curves
of interaction potentials as a function of the interatomic distance are shown in figure 1. Since
the Pt-Bi bond strength is higher than those for Pt-Pt and Bi-Bi, it can be expected at a first
sight that Bi atoms are located on the outermost surface. Moreover, the Pt-Bi equilibrium
distance is larger than the Pt-Pt distance, which reinforces this expectation. The nanoparticle
growth was monitored by integrating the equation of motions (time step of 1 fs) over a
timescale of 10 ns (needing 107 iterations each), to fully complete the thermal relaxation of the
whole system. Figure 2 display snapshots at 10 ns for all considered Pt1-xBix atomic
compositions.
The first important information is that the Bi atoms are always decorating Pt core clusters.
The second one is that the Pt core is crystalline. Indeed, the atomic arrangement which can be
observed in Figure 2 is typical of a crystalline structure of the Pt clusters, with numbers of 1st
nearest neighbors between 10 and 12; (111) planes are also distinguishable. The third
observation is that each cluster is stoichiometric, i.e. the Pt/Bi atomic composition is not only
globally preserved but is also verified for each cluster. At last, the molecular dynamics
simulation clearly indicates that for 20 at. % Bi (Pt0.8Bi0.2), the Pt core cluster is almost fully
hidden by Bi atoms (Figure 2 c).
Inspection of the Bi organization on the Pt cluster cores shows that in the case of the Pt0.9B0.1
50% of Bi atoms form dimers bonded to one Pt atoms (local bonding of PtBi2). For the Pt0.8Bi0.2
atomic composition, 30% of Bi atoms form dimers (local bonding of PtBi2) and 30% form
cm3 mol-1 while that of Pt is 9 cm3 mol-1. So, there is a strong hindering of the Pt surface atoms
by Bi atoms. According to Solla-Gullón et al.33, on Pt(111) one Bi atoms blocks three Pt sites.
Therefore, it could be expected that the optimal composition for efficient catalytic conversion
of molecules is PtxBi-x with x > 0.8. In the case of Pt0.9Bi0.1 (Figure 2b), the Bi-free space makes
Pt surface accessible, allowing enhancement of Pt activity through electronic interactions
between Bi and Pt atoms and/or adsorption mode of molecules reacting at the surface.
3.2 Physicochemical characterization of PtxBi1-x/C catalysts.
Pt/C, Pt0.9Bi0.1/C and Pt0.8Bi0.2/C nanocatalysts synthesized by a water-in-oil microemulsion
method11,13,20 at 25 °C were comprehensively characterized by different physicochemical
characterization methods: TGA, ICP-OES, AAS, TEM, XRD, and XPS to access the loading,
composition and structure of the nanocatalysts. Results are given in Table 1.
Thermogravimetric analysis allowed assessing the metal loadings on carbon, which were
comprised between 37.5 wt% and 43.5 wt% (SI 1), i.e. close to the nominal loading of 40 wt%
for all catalysts. The bulk composition of Pt0.9Bi0.1 and Pt0.8Bi0.2 NPs were determined by both
ICP-OES and AAS. Both techniques led to very close compositions, which were consistent
with the expected ones. TGA, ICP-OES and AAS characterizations evidenced the complete
insertion in catalytic NPs of metals contained in microemulsions.
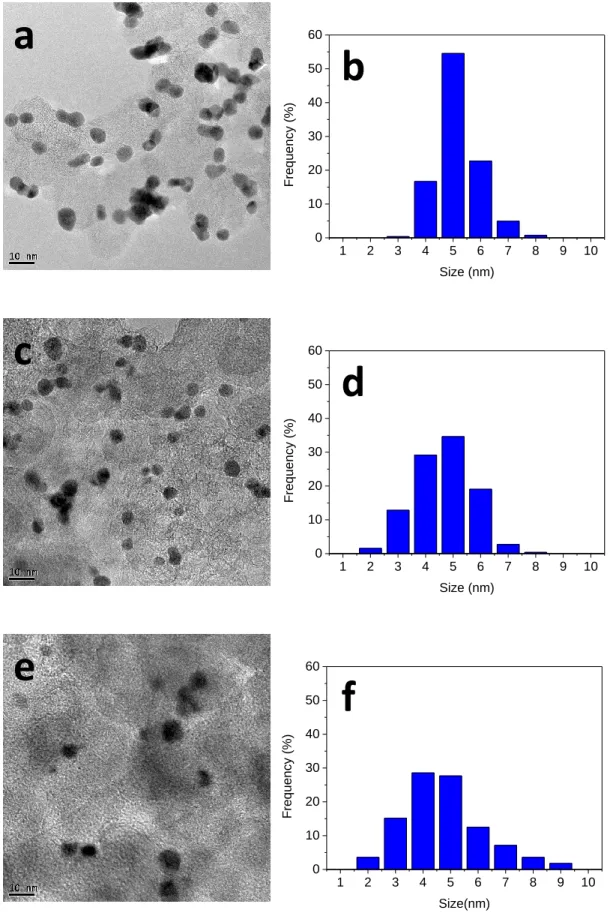
The mean sizes of the Pt/C and PtxBi1-x/C NPs were determined from TEM photographs.
Figure 3 display typical TEM images of isolated Pt/C (Figure 3a), Pt0.9Bi0.1/C (Figure 3c) and
Pt0.8Bi0.2/C (Figure 3e), with the corresponding size distribution histograms in Figures 3b, 3d
and 3f, respectively. The mean particle size for Pt/C was calculated to be ca. 5.2 nm, those for
Pt0.9Bi0.1/C and Pt0.8Bi0.2/C to be both ca. 4.7. While the Pt nanoparticles are well dispersed on
the carbon support, the PtBi nanoparticles tend to form agglomerates (not shown).
XRD patterns were recorded in the 20 ° ≤ 2θ ≤ 140 ° range (Figure 4). All the diffraction
to be consistent with the JCPDS 04−0802 card for platinum except for the small peak at 2θ =
23.1° in all patterns and a massive of peaks centered at ca. 30° in the case of Pt0.8Bi0.2/C, which
were attributed to the {002} set of planes of turbostratic graphite34,35 and to the presence of
isolated small (amorphous) Bioxide clusters36, respectively. The mean crystallite sizes were
determined from the full width at half maximum of the (111) diffraction peak at ca. 2 = 40°
related to the Pt fcc structure using the Scherrer equation and considering the approximation
of spherical crystallites (shape factor K = 0.89)37. They were estimated in the range of 3.1 nm
for Pt/C to 4.3 nm for Pt0.9Bi0.1/C. One must consider that due to strain/deformation effects
inherent to nanoparticle with nanoscopic sizes, the crystallite sizes determined using the
Scherrer equation is underestimated. It is worth to note the invariance of the position of the
diffraction peaks related to the fcc structure with the increase of the bismuth atomic ratio in the
Pt-based materials. The cell parameter values of the PtBi alloys (aAlloy) calculated using the
Bragg equation averaging the values of the four lattice parameters obtained for {111}, {200},
{220} and {311} planes are therefore very close to that of pure platinum (0.3916 nm), i.e.
0.3920 nm for Pt0.9B0.1 and 0.3926 nm for Pt0.8Bi0.2. According to Slater38, the atomic radius of
Bi is equal to 1.185 times the atomic radius of Pt (rPt = 1.185 rBi). The cell parameter of an
alloyed fcc PtxM1-x (0 ≤ x ≤ 1) bimetallic structure (aPtM) can be calculated from the cell
parameter values of pure Pt and M fcc structures, aPt and aM, using the Vegard’s law (Eq. 1):
aPtM = xaPt + (1 - x)aM (1)
where aPt and aBi are expressed using equations (2) and (3) in the cases of Pt and Bi fcc
structures, respectively:
aPt = 2 √2 rpt (2)
aBi = 2 √2 rBi = 1.185 2 √2 rpt = 1.185 aPt (3)
aPtBi = xaPt + (1-x)aBi = xaPt + 1.185aPt(1-x) = apt(1.185 – 0.185x) (4)
aPt0.9Bi0.1 = 0.3916 (1.185 – 0.9 0.185) = 0.3988 nm
aPt0.8Bi0.2 = 0.3916 (1.185 – 0.8 0.185) = 0.4061 nm
The changes in cell parameter values for Pt0.9Bi0.1 and Pt0.8Bi0.2 structures(0.3920 and
0.3926 nm, respectively) with respect to that for Pt (0.3916 nm) are not significant, and
therefore it can be concluded that Pt and Bi are not alloyed (or very few) in the bimetallic
materials.
At last, XPS measurements on fresh materials were carried out (Figures 5a,b,c,d) and
revealed a total Bi atomic composition values for Pt0.9Bi0.1 (Figure 5b) and Pt0.8Bi0.2 (Figures
5d) catalysts 1.5 times to twice higher than the actual bulk ones as determined by AAS and
ICP-OES, reaching 21 at% and 28 at% Bi, respectively. Because the mean escape depths of
electrons by XPS are in the range of 1 to 2 nm for Pt and Bi39 and the mean particle size of
bimetallic catalysts is around 5 nm, the high Bi at% values indicated that bismuth was
preferentially located close to the surface of the PtBi nanoparticles, accordingly to the MD
simulations.
The Pt 4f profiles (Figures 5a,c) could be fitted by a single curve, according to the fit
obtained on reference spectra recorded on Pt0 (Casa XPS component parameters:
LF(0.6,1.3,100,90)), centered at 71.2 eV which indicates that only Pt0 oxidation state is present
in both materials. In contrary, the Bi 4f profiles (Figures 5b,d) needed three or four mixed
Lorentzian-Gaussian curves to be accurately fitted. From the positions of the peaks, the Bi 4f7/2
peak located at 157.5 eV, 158.3 eV and 159.7 eV could reasonably be assigned to the presence
of Bi0, BiII and BiIII oxidation states40, respectively. The peak at 161.4 eV is assigned to a tiny
proportion of BiIV.Bismuth oxide structures concentrated mainly on the platinum surface were
already observed by Kimatura et al.41 for 1% Bi-5% Pt/C catalyst synthesized by reduction of
Because the electrocatalytic measurement were performed on “activated” PtxBi1-x/C
catalysts, after 10 cycles in supporting electrolyte between 0.05 V and 1.00 V vs RHE to obtain
stables CVs over the time scale and potential range of the experiments, XPS spectra were also
recorded on the “activated” catalysts after stopping the last CV at ca. 0.05 V vs RHE (Figure 5 e,f,g,h). The ratios of the different species are given in Table 1. The atomic ratios of platinum
remain constant. It is worth to note that the ratios of highly oxidized BiIII and BiIV atoms is
always, before and after cycling, much higher in Pt0.8Bi0.2 than in Pt0.9Bi0.1. This indicates that
higher number of bismuth atoms in Pt0.8Bi0.2 are less or not interacting with platinum. It is also
worth to note that no Bi0 was detected after cycling. This result was surprising because,
according to other authors, Bi should be metallic at a so low potential42,43. However, results are
provided by ex-situ XPS measurements, and small clusters of Bi0 (MDs simulations predicted
the formation of Bi dimers and trimers at the Pt surface) could be oxidized in air into BiII during
the transfer of the electrode from the cell to the XPS chamber.
To summarize the above characterization results, the actual metal loadings and bulk atomic
ratios are close to the expected (nominal) ones, Pt and Bi atoms are not alloyed and the
nanoparticle surface is bismuth-rich. Therefore, the PtBi materials prepared by the water-in-oil
micro-emulsion route consist in Pt nanoparticles of ca. 5 nm diameter surrounded by bismuth
structures, in agreement with the molecular dynamics calculation in section 3.1. According to
XPS results, bismuth atoms are under different oxidized states, forming likely Bi(OH)
2 as main
structure, as well as Bi(OH)3 and/or Bi2O3 structures, although the presence of Bi0 after
potential cycling and stop at 0.05 V vs RHE is also very likely. At last, the higher is the bismuth
atomic ratio, the higher is the highly oxidized bismuth atom proportion in the samples, i.e. atom
proportion less or not interacting with platinum.
Because electrocatalytic reactions take place only at the surface of the catalytic materials,
gaining information on their surface structure is of paramount importance. Electrochemical
methods are very powerful to study the surface structure of materials since only surface atoms
which can be electroactive are probed and the surface structures are determined in the
environment of their use. Figures 6a displays the tenth stable cyclic voltammograms (CVs) of
PtxBi1-x/C materials in 0.1 M NaOH N2-saturated electrolyte recorded between 0.05 and 1.20
V vs RHE. The Pt/C catalyst gives the typical CV shape (black line) of polycrystalline platinum
nanoparticles in a clean alkaline electrolyte. The first 9 CVs between 0.05 V and 1.0 V vs RHE
of Pt0.8Bi0.2/C showed no significant changes in shape and only a very small decrease in
oxidation and reduction current, whereas no change was observed on Pt0.9Bi0.1/C (SI 2). These
observations speak towards the preservation of the structures of fresh catalysts upon the ten
first voltammetric cycles.
The CV of Pt0.9Bi0.1/C (red line) shows a (quasi) total inhibition of the hydrogen
underpotential deposition (HUPD) and HUPD desorption, as the typical redox feature in the
so-called hydrogen region between ca. 0.05 and 0.40 V vs RHE are not present, in agreement with
previous observations44. This suggests either a (quasi) full coverage of Pt surface by Bi
structures or an electronic effect of Bi on Pt inhibiting the hydrogen adsorption process. From
0.25 V vs RHE a low positive current slightly increases with potential and for potentials higher
than 0.40 V vs RHE, two oxidation peaks are observed centered at 0.62 and 0.82 V vs RHE,
the first one appearing before and the second one superimposing with the Pt surface oxidation
process. Indeed, the oxidation current recorded after the peak centered at 0.82 V vs RHE, i.e.
between ca. 0.90 V and 1.20 V vs RHE, originates from the Pt oxidation process45. The facts
that the Pt surface is covered by bismuth species and that the Pt surface oxidation still happens
at high potentials suggest that part of the Pt surface is accessible for oxidation reaction, which
agreement with MDs simulations. However, MDs simulations indicated that in the case of
Pt0.8Bi0.2 the Pt surface coverage by bismuth atoms was very high, but the Pt surface oxidation
process appears completely not affected. From those observations, it results that either
dissolution of bismuth upon oxidation, or reorganization of bismuth on Pt surface, or oxygen
transfer between bismuth oxide species and platinum surface occurs allowing the oxidation of
the latter. In the case of polycrystalline Pt electrode modified by Bi adatoms, Kardigan et al.45
proposed that the main oxidation peak that they observed at ca. 0.85 V vs RHE was related to
the redissolution of Bi, whereas the cathodic one at ca. 0.73 V vs RHE was related to Bi
underpotential deposition. CVs recorded before and after 1000 potential cycles between 0.05
and 1.00 V for Pt/C, Pt0.9Bi0.1/C and Pt0.8Bi0.2/C are presented in Figure 6b. After 1000 cycles,
the Pt/C catalyst undergoes dramatic loss of surface area whereas the capacitive current in the
double layer region remains almost constant. Such phenomenon was already observed in
alkaline media and was attributed either to Pt particle detachment from the carbon surface46 or
to corrosion/dissolution of Pt nanoparticles47. However, by comparing polarization curves
recorded on Pt/C in figure 7a and 7b, one can remark that the loss in active surface area of Pt/C
has little impact on the catalytic activity towards glycerol electrooxidation.
The CV after 1000 cycles for Pt0.9Bi0.1/C remains almost similar as the one after 10 cycles,
indicating the very good stability of this catalyst. In this case, at least, the
dissolution/redeposition mechanism appears not convenient because it would be reasonable to
expect that a continuous loss of bismuth by dissolution occurs. The rearrangement of Bi atoms
with the electrode potential, like a breathing process (Pt fully covered with Bi0 species at low
potentials and partially covered with Bi2O3 or Bi(OH)3 species at high potentials) cannot be
discarded. Another reasonable hypothesis concerns the possible reversible spill-over of oxygen
In contrary, the CV after 1000 cycles for Pt0.8Bi0.2/C is greatly modified compared with the
one after 10 cycles. The changes in CV shape over the 1000 voltammetric cycles are presented
in SI 3 every 100 cycles for a sake of clarity. The shape changes drastically from the first to
the 500th cycles and then stabilize for higher number of cycles. The redox features between
0.10 V and. 0.55 V vs RHE have completely disappeared and the CV resembles closely that of
Pt0.9Bi0.1/C. In this second case, dissolution of bismuth species likely takes place until reaching
a stable surface structure close to that of the stable Pt0.9Bi0.1/C material. This suggests that
different kinds of bismuth atoms exist, those that can be dissolved and those that cannot be
dissolved. In this context, the redox feature from 0.10 V to 0.55 V vs RHE in the Pt0.8Bi0.2/C
CV profile is due to Bi atoms not interacting with Pt, and which dissolve upon potential cycles,
whereas the remaining redox features in the range from 0.25 V to 0.90 V vs RHE are due to
stabilized Bi atoms in interaction with Pt.
It is worth to note that the current plateau for potentials in the range from 1.00 to 1.20 V vs
RHE for the positive scan direction is not affected by potential cycling in the case of Pt0.9Bi0.1/C
and Pt0.8Bi0.2/C materials, whereas it displays lower current density values after 1000 potential
cycles for Pt/C. This suggests that the presence of bismuth protects the Pt nanoparticles from
degradation.
XRD patterns were recorded on Pt0.9Bi0.1/C and Pt0.8Bi0.2/C electrodes before (fresh) and
after (aged) 1000 cycles between 0.05 V and 1.00 V vs RHE and compared with that of a Pt/C
catalyst in order to check if PtBi alloys could be formed upon cycling (SI 4). No change in
XRD peak positions is observed, which indicates that no alloy is formed and that the Pt core
Bi shell structure of the fresh catalysts is conserved after 1000 cycles between 0.05 and 1.00 V
vs. RHE.
Considering the negative potential scan, the sharp reduction peak centered at ca. 0.70 V vs
potentials is related to both the reduction of bismuth oxides formed in the oxidation peak
centered at 0.82 V vs RHE and to the reduction of platinum surface oxides, whereas the
shoulder at lower potentials is related to the reduction of bismuth oxide species formed in the
oxidation peak centered at ca. 0.62 V vs RHE. It is worth to note that the oxidation peak
centered at 0.82 V and the feature related to Pt surface oxidation starts at the same potential,
and that reduction of bismuth oxide species formed from 0.70 to 0.90 V and of platinum surface
oxides leads to a unique reduction peak. Both these observations suggest strong interactions
between both metals (bismuth species in contact with platinum, in total agreement with MDs
calculations).
Zuo et al.40 investigated the change of the Bi valence state in a Bi2O3 electrode along the
cathodic linear sweep voltammetry in Na+ containing aqueous electrolyte using ex situ XPS.
By following the changes in the Bi 4f XPS peaks, they concluded that Bi2O3 can be firstly
reduced into BiII and then to elemental Bi0 during the cathodic process, which also explained
the appearance of two anodic CV peaks (oxidation from Bi0 to BiIII bridging with BiII). The
CV of Pt0.8Bi0.2/C (blue line in Figure 6a) points out, in addition to the same features as for
Pt0.9Bi0.1/C at potentials higher than 0.60 V vs RHE, the existence of supplementary redox
feature in the potential range from 0.10 V to ca. 0.55 V vs RHE with the peak maximum at ca.
0.48 V vs RHE. The redox features between 0.10 to ca. 0.55 V vs RHE occurs in a potential
range which is convenient with the potential of 0.48 V vs ESH (standard hydrogen electrode)
for the following reaction in aqueous alkaline media48:
2 Bi + 6 OH- = Bi2O3 + 3 H2O + 6 e- (5)
XPS measurements showed indeed that Bi0 was present in fresh Pt0.8Bi0.2/C materials. It is
then proposed that those redox peaks at low potentials are related to the oxidation/reduction of
Bi species less interacting with the Pt surface or having different structures than those leading
To summarize main results from the electrochemical study of PtxBi1-x/C materials, different
kinds of bismuth atoms coexist in PtBi NPs, those in direct strong interaction with Pt, those in
interaction with Bi atoms in strong interaction with Pt, forming small clusters according to
molecular dynamics simulations, and those deposited on the carbon surface not in interaction
with Pt. Bismuth structures deposited far from platinum are not stable and dissolve upon
potential cycles. It can also be stated that the strong interactions between Pt and Bi atoms, as
also stipulated from molecular dynamics calculations, leads to electronic effects inhibiting
under potential hydrogen deposition reaction and allowing platinum surface oxidation. At last,
bismuth atoms in Pt0.9Bi0.1/C catalyst are metallic for potentials lower than ca. 0.300 V vs.
RHE, are oxidized into BiII from ca. 0.300 V to ca. 0.800 V vs RHE and into BiIII for higher
potentials.
3.4 Electrocatalytic behavior of PtxBi1-x/C catalysts.
The electrochemical activities of PtxBi1-x/C catalysts in NaOH 0.1 mol L-1 N2-purged
electrolyte in the presence of 0.1 mol L-1 glycerol, corresponding to the third scans, are
compared in Figure 7. For fresh catalysts (Figure 7a), the onset potential, defined as the
potential at which the current density of 0.05 mA cm-2 is reached, is ca. 0.400 V vs RHE for
Pt/C and Pt0.8Bi0.2/C, whereas it is decreased down to 0.300 V vs RHE for Pt0.9Bi0.1/C. For
potential higher than 0.400 V vs RHE, the Pt0.8Bi0.1/C catalysts leads to the lower current
densities, i.e. to lower catalyst mass activity as all electrodes are loaded with the same mass of
metals (100 µgmetal cm-2). The important information is that although according the molecular
dynamics calculations in part 3.1 and electrochemical study in part 3.3 the Pt surface is
expected to be completely covered by bismuth, the Pt0.8Bi0.2/C material displays a catalytic
activity for glycerol oxidation at high potentials. The Pt0.9Bi0.1/C catalyst displays the lowest
onset potential and the highest activity (higher current densities from 0.300 V vs RHE than
constant voltages (0.55 V and 0.7 V) for the oxidation of 2 M glycerol in 0.5 M NaOH were
performed in an electrolysis cell by Cobos-Gonzalez et al.13 at Pt/C and Pt0.9Bi0.1/C (SI 5).
Pt0.9Bi0.1/C led always to higher initial and stabilized current density over 4 hours of
experiments than Pt/C anodes. The higher activity at constant potential indicates lower
poisoning of the surface and higher turn-over frequency per Pt sites. Indeed, in this case also
molecular dynamics calculations and electrochemical studies showed that the coverage of Pt
by Bi was very high. This indicates also that a part of the platinum surface is still available in
both cases for the adsorption of glycerol and second that the blocking of hydrogen adsorption
is likely related to change in Pt surface electronic density of states implied by the strong
interaction with Bi, as predicted by MDs simulation.
The lower activity of Pt0.8Bi0.2/C is explained in terms of lower Pt surface available for
glycerol electrooxidation. Indeed, the activity towards 0.1 M glycerol electrooxidation of the
Pt0.8Bi0.2/C catalyst recorded after 1000 potential cycles between 0.05 and 1.00 V in N2-purged
glycerol-free electrolyte tends to that of the Pt0.9Bi0.1/C catalyst over the whole studied potential
range (Figure 7b), confirming the results in section 3.3 where the CV of Pt0.8Bi0.2/C in N2
-purged glycerol free-electrolyte after 1000 potential cycles resembles that of Pt0.9Bi0.1/C.
The activity and selectivity of Pt0.9Bi0.1/C catalyst for glycerol electrooxidation in alkaline
medium is well documented. From in situ infrared spectroscopy measurements (SI 6) and
HPLC analyses of reaction products after chronoamperometry measurements at different
electrolysis cell voltages (SI 5), it has been established that in the low potential range from ca.
0.300 V to ca. 0.600 V vs RHE, glyceraldehyde and dihydroxyacetone are by far the main
products formed, whereas for higher potentials, carboxylate species are also formed in
significant amounts13,20 (SI 6.1). The same trends were observed in acidic medium49. These
works also evidenced that the presence of bismuth avoided the C-C bond breaking, i.e. the
3.5 Discussion
It is generally recognized that the first step of the electrooxidation at low potentials (lower
than 0.4 V vs RHE) of alcohols and polyols, such as ethanol and glycerol, at platinum
based-catalysts consists in the dehydrogenation reaction leading to adsorbed aldehyde-like species50
according to the following general reaction:
in acidic medium: Pt + R-CH2OH Pt-CHO-R + 2 H+ + 2 e
-in alkal-ine media: Pt + R-CH2OH + 2 OH-Pt-CHO-R + 2 H2O + 2 e
-But with pure platinum, adsorbed aldehyde is further transformed into adsorbed acetyl-like
species that can be oxidized as soon as Pt becomes able to activate water, typically for
potentials higher that 0.5 - 0.6 V vs RHE into into carboxylic/carboxylate species and CO2 (if
C-C bond breaking occurs)51 via the Langmuir-Hinshelwood mechanism. These oxidation
processes can be enhanced by modifying platinum with foreign metal atoms, leading to the
so-called bifunctional mechanism of electrocatalysis52, i.e. the third body effect53. In the case of
Pt0.9Bi0.1/C, it is likely that Bi structures participate to this mechanism. It was indeed previously
demonstrated by comparing the activity of Pd/C and Pd0.9Bi0.1/C catalysts towards glycerol
electrooxidation in alkaline medium20, that the onset potential was shifted towards lower
potentials from ca. 150 mV (Pd0.9Bi0.1/C leading to the same activity as Pt/C), whereas the
selectivity towards the formation of carboxylates as main products was the same as for pure Pt.
Moreover, the participation of Bi to the third body mechanism also explain the higher current
densities recorded on Pt0.9Bi0.1/C than those observed on Pt/C.
At low electrode potentials, the only formation of low oxidized species (mainly
glyceraldehyde and a few hydroxyacetone) that don’t need the participation of an extra oxygen
atom from water activation on Pt surface, indicates clearly that the bifunctional mechanism is
not involved. But, assuming the same first steps of glycerol adsorption on Pt0.9Bi0.1/C as on
adsorption/oxidation reactions also indicates that the turn-over frequency, and further the
desorption rate of adsorbed aldehyde species, are enhanced on Pt0.9Bi0.1/C material. De Souza
et al. 54 also observed that the presence of Bi modified the adsorption energies of adsorbates
on Pt surface.
To explain the higher activity for glycerol oxidation and selectivity towards
dihydroxyacetone of Bi-modified Pt(111) in acidic medium, Garcia et al.55 proposed the
formation of an enediol intermediate with two carbons adsorbed on two adjacent Pt sites with
their alcohol groups interacting with a single Bi adatom. This mechanism is certainly possible
in the configuration of Pt surfaces modified by low Bi adatom coverages ( was between 0.13
and 0.17 in the work of Garcia et al.). However, in the present work, the coverage of Pt seems
to be much higher, according to both MDs simulations and electrochemical characterizations,
which could prevent the formation of multi-bonded intermediates and favor mainly
single-bonded intermediates due to a steric effect, leading mainly to glyceraldehyde at low potentials
and glycerate at higher potentials. This observation was also made by De Souza et al.54 for the
glycerol electrooxidation in alkaline medium on Pt electrodes modified by Bi adatoms.
On the other hand, the structure of Bi deposits on Pt surface in the present case differs from
that of adatoms in the case of Garcia et al.55 and De Souza et al.54. First, molecular dynamics
simulation predicted the formation of Bi dimers and trimers. Second, it was previously clearly
shown that the electrochemical behavior of Pd modified by Bi adatoms was very different than
that of Pd0.9Bi0.1 nanoparticles prepared by the water-in-oil microemulsion method. In the case
of Pd nanoparticles modified by Bi adatoms56, it was previously observed an increase of the
current densities for the glycerol electrooxidation from ca. 0.6 V vs RHE, but a small effect on
the onset potential. The same behavior, i.e. increase of the activity without significant shift of
the onset potential, was observed from ca. 0.4 V vs. RHE by de Souza et al.54 with Pt electrode
water-in-oil microemulsion methodErreur ! Signet non défini., the onset potential of glycerol
electrooxidation was shifted by ca. 150 mV towards lower values. This discrepancy was
explained in terms of different Bi structures deposited on Pd surfaces (adatoms and small
amorphous Bi clusters), leading to different interactions between glycerol adsorbates and PdBi
surface. This certainly is applicable to Pt surfaces, owing to the very close behavior of both
metals (Pd and Pt). Indeed, in the present case, the onset potential of glycerol oxidation is
shifted by ca. 150 mV towards lower value on Pt0.9Bi0.1/C than on Pt/C.
Adzic57 proposed that the presence of foreign atom structures at the platinum surface can
lead to the dilution the Pt surface atoms, which limits the mean number of adjacent Pt atoms
and further the nature of adsorbed species as well as the strength of their adsorption. Moreover,
the absence of a typical COads infrared absorption band for glycerol oxidation on Pt0.9Bi0.1 (SI
6.2) conversely to what is obtained on Pt (multibonded and linearly CO according to the
wavenumber value around 1800 cm-1 and 2050 cm-1) indicates that the C-C bond breaking, that
necessitates several adjacent Pt sites, is avoided in the presence of 10 at% of Bi atoms on Pt
nanoparticles.
It is worth to note that the onset potential of glycerol oxidation starts at ca. 0.300 V vs RHE,
i.e. at the same potential as that of Bi oxidation onset potential from certainly Bi0 to BiII. The
early stage of this redox transition seems to be involved in the reaction process not by direct
interaction of Bi species with adsorbed species from glycerol but by changing the electronic
surface state of platinum, leading to lower the bonding strength between Pt sites and adsorbed
aldehyde/ketone species, and at last by favoring their desorption. This reaction allows
liberating Pt sites for further adsorption of glycerol and iterations of the different reaction steps.
This mechanism involving both a geometric effect (dilution of adjacent Pt atoms) and a strong
activity of Pt0.9Bi0.1/C catalyst at low potentials and its high selectivity towards low oxidized
species.
4. Conclusion
Pt/C, Pt0.9Bi0.1/C and Pt0.8Bi0.2/C materials were synthesized at room temperature using a
microemulsion method and their nature and structure were characterized by different
physicochemical and electrochemical methods. In order to gain insight on the final structure of
materials, results from physicochemical characterization were compared to predictions from
molecular dynamics simulations. From physicochemical characterizations, and particularly
XRD measurements before and after potential cycling, PtxBi1-x materials appeared to consist in
Pt nanoparticles of ca. 4 - 5 nm diameter decorated by bismuth structures. From MDs, the final
structures of PtxBi1-x nanoparticles consisted in a crystalline Pt core surrounded by Bi atoms,
forming dimers and trimers depending on the Bi to Pt ratio. The growth dynamics showed a
systematic Bi segregation towards the Pt core surface. This is consistent with the shape of the
interaction potential vs distance curves showing a minimum at shorter distance for Pt-Pt
interaction than for Pt-Bi interaction, which should favor the formation of a Pt core. Stronger
Pt-Bi interaction (deeper well) at larger distance than that for Pt-Pt is responsible for Bi location
on the outer Pt nanoparticle surface. Both physicochemical and simulation methods lead to
consistent results, confirming the Pt core Bi shell structure of the nanoparticles.
Pt0.9Bi0.1/C has demonstrated the highest activity towards glycerol electrooxidation with an
oxidation onset potential shifted by ca. 0.250 V towards lower values compared with that
obtained with Pt/C. In addition, to the high activity at low potentials, Pt0.9Bi0.1/C is also very
selective towards glyceraldehyde/hydroxyacetone for potentials lower than 0.6 V vs RHE.
Such selectivity cannot be explained by the ability of bismuth to adsorb OH species, because
the bifunctional mechanism is not effective in the considered potential range. It is then
owing to the strong interaction between bismuth and platinum. MDs also predicted strong
electronic interaction between Pt and Bi, leaning on the deep interaction potential well for
Pt-Bi. This strong electronic effect together with the one-carbon adsorption mode due to dilution
of Pt sites by bismuth structures (ensemble effect) favor the formation of
glyceraldehyde/dihydroxyacetone and their desorption. In addition, the enhancement of the
desorption rate is driven by the early stage of the Bi0/BiII transition, which will certainly affect
the electronic state of platinum surface. Now, the understanding of the role of the Bi redox
transition in the electronic change of Pt surface and further in activity/selectivity enhancement
brought by Bi is, in our opinion, the next important step to be able to design the best catalysts
for biomass electro-reforming.
Although MDs simulation were useful to determine the structure of PtxBi1-x nanomaterials,
this simulation method can’t represent totally the reality, because it is physically impossible to take into account all parameters (in terms of calculation time and data processing). It is then a
simplification allowing to propose general trends, and in the present case those relative to the
structures and possible electronic interactions between atoms during the nanoparticle
formation, only based on known and relevant interaction potentials between atoms (Pt-Pt,
Bi-Bi and Pt-Bi-Bi). Therefore, some differences between simulated and real materials, such as the
final size, arise, which could affect electronic and geometric effects and hence the catalyst
behavior. This is the reason why MD simulations in the present article have not the ambition
to simulate the electrochemical and electrocatalytic behaviors of PtxBi1-x nanostructures, but
only that to confirm the initial structures of catalysts (which is maintained over the long-term
electrochemical experiments).
Acknowledgements
This work was partly funded by the ANR project ECO-PLAN under grant
Nouvelle Aquitaine” for financial support. PB gratefully acknowledges G. Raos (Ref. [29]) for
providing us with Bi-Bi EAM potential data file. CC and SB acknowledge Dr. Mario Simoes,
Dr. Anna Zalineeva and Dr. Jesus Cobos-Gonzalez for previous experimental contributions.
References
1. A. Tathod, T. Kane, E.S. Sanil, P. L. Dhepe. Solid base supported metal catalysts for the
oxidation and hydrogenation of sugars. J. Mol. Catal. A: Chemical 388–389 (2014) 90–99
2. E. Bahcegul, H. E. Toraman, N. Ozkan, U. Bakir. Evaluation of alkaline pretreatment
temperature on a multi-product basis for the co-production of glucose and
hemicellulose-based films from lignocellulosic biomass. Bioresour. Techn. 103 (2012) 440–445.
3. M. A. Dasari, P. P. Kiatsimkul, W. R. Sutterlin, G. J. Suppes. Low-pressure hydrogenolysis
of glycerol to propylene glycol. Appl. Catal. A: General. 281 (2005) 225– 231.
4. R. Ciriminna, C. Della Pina, M. Rossi, Mario Pagliaro. Understanding the glycerol market. Eur. J. Lipid Sci. Technol. 116 (2014) 1432–1439
5. P. Gallezot, Selective oxidation with air on metal catalysts, Catal. Today 37 (1997) 405 –
418.
6. M. J. Climent, A. Corma, S. Iborra. Converting carbohydrates to bulk chemicals and fine
chemicals over heterogeneous catalysts. Green Chem. 13 (2011) 520–540.
7. A. Behr, J. Eilting, K. Irawadi, J. Leschinski, F. Lindner. Improved utilisation of renewable
resources: New important derivatives of glycerol. Green Chem. 10 (2008) 13–30.
8. S. Hermans, A. Deffernez, M. Devillers. Au–Pd/C catalysts for glyoxal and glucose selective
oxidations. ACS Sustainable Chem. Eng. 4 (2016) 2432−2438.
9. S. Carrettin, P. Mc Morn, P. Johnston, K. Griffin, C. J. Kielyc, G. A. Attard, G. J. Hutchings.
Oxidation of glycerol using supported gold catalysts. Top. Catal. 27 (2004) 131–136.
10. V. Bambagioni, M. Bevilacqua, C. Bianchini, J. Filippi, A. Lavacchi, A. Marchionni, F.
Vizza, P. K. Shen. Selfsustainable production of hydrogen, chemicals, and energy from
renewable alcohols by electrocatalysis. ChemSusChem 3 (2010) 851–855.
11 . M. Simões, S. Baranton, C. Coutanceau, Electrochemical Valorisation of Glycerol,
ChemSusChem 5 (2012) 2106 – 2124.
12 . Y. X. Chen, A. Lavacchi, H. A. Miller, M. Bevilacqua, J. Filippi, M. Innocenti, A.
Marchionni,W. Oberhauser, L. Wang, F. Vizza, Nanotechnology makes biomass
electrolysis more energy efficient than water electrolysis, Nature Comm. 5 (2014) 4036
1-6.
13 . J. Cobos-Gonzalez, S. Baranton, C. Coutanceau. Development of Bi-Modified PtPd
Nanocatalysts for the Electrochemical Reforming of Polyols into Hydrogen and
Value-Added Chemicals. ChemElectroChem 3 (2016) 1694–1704.
14. Z. Zhang, L. Xin, W. Li. Electrocatalytic oxidation of glycerol on Pt/C in anion-exchange
membrane fuel cell: Cogeneration of electricity and valuable chemicals. Appl. Catal. B:
Environmental 119–120 (2012) 40–48.
15. T. Rafaïdeen, S. Baranton, C. Coutanceau. Highly efficient and selective electrooxidation
of glucose and xylose in alkaline medium at carbon supported alloyed PdAu nanocatalysts.
Appl. Catal. B: Environmental 243 (2019) 641–656.
16. T. Mallat, A. Baiker, Oxidation of alcohols with molecular oxygen on platinum metal
catalysts in aqueous solutions, Catal. Today 19 (1994) 247 – 284.
17 . A. Zalineeva, M. Padilla, U. Martinez, A. Serov, K. Artyushkova, S. Baranton, C.
Coutanceau, P. B. Atanassov. Self-Supported PdxBi Catalysts for the Electrooxidation of
18. E. Casado-Rivera, D. J. Volpe, L. Alden, C. Lind, C. Downie, T. Vázquez-Alvarez, A. C.
D. Angelo, F. J. DiSalvo, H. D. Abrunã. Electrocatalytic Activity of Ordered Intermetallic
Phases for Fuel Cell Applications. J. Am. Chem. Soc. 126 (2004) 4043 – 4049.
19. C. Roychowdhury, F. Matsumoto, P. F. Mutolo, H. D. Abrunã, F. J. DiSalvo, Synthesis,
Characterization, and Electrocatalytic Activity of PtBi Nanoparticles Prepared by the
Polyol Process, Chem. Mater. 17 (2005) 5871 – 5876.
20. M. Simões, S. Baranton, C. Coutanceau, Enhancement of catalytic properties for glycerol
electrooxidation on Pt and Pd nanoparticles induced by Bi surface modification, Applied
Catalysis B: Environmental 110 (2011) 40 – 49.
21. M. Wojdyr. Fityk: a general-purpose peak fitting program. J. Appl. Crystallogr. 43 (2010)
1126−1128.
22. P. Brault, E. Neyts, Molecular dynamics simulations of supported metal nanocatalyst
formation by plasma sputtering, Catal. Today 256 (2015) 3 – 12
23. P. Brault, C. Coutanceau, P. C. Jennings, T. Vegge, J. Berndt, A. Caillard, S. Baranton, S. Lankiang, Molecular dynamics simulations of ternary PtxPdyAuz fuel cell nanocatalyst
growth. Int. J. Hydrogen Energy 41 (2016) 22589 – 22597
24. H. Okamoto, The Bi-Pt (Bismuth-Platinum) System. J. Phase Equilibria 12 (1991) 207 –
210.
25. A. Caillard, S. Cuynet, T. Lecas, P. Andreazza, M. Mikikian, A. –L. Thomann, P. Brault,
PdPt catalyst synthesized using a gas aggregation source and magnetron sputtering for fuel
cell electrodes. J. Phys D: Applied Physics 48 (2015) 475302.
26. E. Quesnel, E. Pauliac-Vaujour, V. Muffato. Modeling metallic nanoparticle synthesis in a
magnetron-based nanocluster source by gas condensation of a sputtered vapor. J. Appl.
27. X. Zhou, R. Johnson, H. Wadley. Misfit-energy-increasing dislocations in vapor-deposited
CoFe/NiFe multilayers. Phys. Rev. B 69 (2004) 144113.
28. D. K. Belashchenko. Computer Simulation of the Properties of Liquid Metals: Gallium,
Lead, and Bismuth. Russ. J. Phys. Chem. A 86 (2012) 779-790.
29. Y. Gao, G. Raos, C. Cavallotti, M. Takahashi. Molecular Dynamics Simulation on Physical
Properties of Liquid Lead, Bismuth and Lead-bismuth Eutectic (LBE). Procedia
Engineering 157 (2016) 214 – 221.
30. S. M. Foiles, M. I. Baskes, M. S. Daw. Embedded-atom-method functions for the fcc metals
Cu, Ag, Au, Ni, Pd, Pt, and their alloys. Phys. Rev. B 33 (1986) 7983; Erratum: Phys. Rev.
B 37 (1988) 10378.
31. M. S. Daw, S. M. Foiles, M. I. Baskes. The embedded-atom method: a review of theory
and applications. Mat. Sci. Reports 9 (1993) 251–310.
32. R. A. Johnson. Alloys models with the embedded-atom method. Phys. Rev. B 39 (1989)
12554.
33. J. Solla-Gullón, P. Rodríguez, E. Herrero, A. Aldaz, J. M. Feliu, Surface characterization
of platinum electrodes. Phys. Chem. Chem. Phys. 10 (2008) 1359–1373.
34. H. Zhu, X. Li, F. Han, Z. Dong, G. Yuan, G. Ma, A. Westwood, K. He. The effect of
pitch-based carbon fiber microstructure and composition on the formation and growth of SiC
whiskers via reaction of such fibers with silicon sources. Carbon 99 (2016) 174−185.
35. H. Yi, H. Wang, Y. Jing, T. Peng, Y. Wang, J. Guo, Q. He, Z. Guo, X. Wang,.Advanced
asymmetric supercapacitors based on CNT@Ni(OH)2 core-shell composites and 3D
graphene networks. J. Mater. Chem. A 3 (2015) 19545−19555
36. J. Hou, C. Yang, Z. Wang, W. Zhou, S. Jiao, H. Zhu. In situ synthesis of α–β phase
heterojunction on Bi2O3 nanowires with exceptional visible-light photocatalytic
37. B. E. Warren, X-Ray Diffraction; Dover Publications, Inc., New York (1990) pp. 251-254.
38. J. C. Slater. Atomic Radii in Crystals. J. Chem. Phys. 10 (1964) 3199–3204.
39. P. J. Cumpson, M. P. Seah. Elastic Scattering Corrections in AES and XPS. II. Estimating
Attenuation Lengths and Conditions Required for their Valid Use in Overlayer/Substrate
Experiments. Suf. Interface Anal. 25 (1997) 430–446.
40. W. Zuo, W. Zhu, D. Zhao, Y. Sun, Y. Li, J. Liu, X. W. Lou. Bismuth oxide: a versatile
high-capacity electrode material for rechargeable aqueous metal-ion batteries. Energy
Environ. Sci. 9 (2016) 2881 – 2891.
41. H. Kimura, K. Tsuto, T. Wakisaka, Y. Kazumi, Y. Inaya. Selective oxidation of glycerol
on a platinum-bismuth catalyst. Appl. Catal. A 96 (1993) 217 – 228.
42. J. Clavilier, J. -M. Feliu, A. Aldaz, An irreversible structure sensitive adsorption step in
Bismuth uderpotential deposition at platinum electrodes. J. Electroanal. Chem., 243 (1988)
419 – 433.
43. S. Blais, G. Jerkiewicz, E. Herrero, J. M. Feliu. New insight into the electro-oxidation of
the irreversibly chemisorbed bismuth on Pt(111) through temperature-dependent research.
J. Electroanal. Chem. 519 (2002) 111–122.
44. M. M. Tusi, N. S. O. Polanco, S. G. Da Silva, E. V. Spnacé, A. O. Nato. The high activity
of PtBi/C catalyst for ethanol electro-oxidation in alkaline media. Electrochem. Comm. 13
(2011) 143 – 146.
45. F. Kadirgan, B. Beden, C. Lamy. J. Electroanal. Chem. Electrocatalytic oxidation of
ethylene-glycol. Part II. Behaviour of platinum ad-atom electrodes in alkaline medium.
143 (1983) 135–152.
46. A. Zadick, L. Dubau, N. Sergent, G. Berthomé, M. Chatenet. Huge Instability of Pt/C
47. S. Cherevko, A. R. Zeradjanin, G. P. Keeley, K. J. J. Mayrhofer. A Comparative Study on
Gold and Platinum Dissolution in Acidic and Alkaline Media. J. Electroch. Soc. 161
(2014) H822-H830.
48. J. Van Muylder, M. Pourbaix, Atlas d’équilibres électrochimiques à 25 ◦C, Gauthier-Villars
& Cie, Paris, 1963.
49. Y. Kwon, Y. Birdja, I. Spanos, P. Rodriguez, M. T. M. Koper. Highly Selective
Electro-Oxidation of Glycerol to Dihydroxyacetone on Platinum in the Presence of Bismuth. ACS
Catal. 2 (2012) 759−764.
50. F. Vigier, C. Coutanceau, F. Hahn, E.M. Belgsir, C. Lamy. On the mechanism of ethanol
electro-oxidation on Pt and PtSn catalysts: electrochemical and in situ IR reflectance
spectroscopy studies. J. Electroanal. Chem. 563 (2004) 81 – 89.
51. F. Vigier, S. Rousseau, C. Coutanceau, J.- M. Léger, C. Lamy. Electrocatalysis for the
direct alcohol fuel cell. Top. Catal. 40 (2006) 111 – 121.
52. M. Watanabe, S. Motoo. Electrocatalysis by ad-atoms. 2. Enhancement of oxidation of
methanol on platinum by ruthenium ad-atoms. J. Electroanal. Chem. 60 (1975) 267−273.
53. T. J. Schmidt, R. J. Behm, B. N. Grgur, N. M. Markovic, P. N. Ross Jr. Formic Acid
Oxidation on Pure and Bi-Modified Pt(111): Temperature Effects. Langmuir 16 (2000)
8159−8166.
54. M. B. C. de Souza, R. A. Vicente, V. Y. Yukuhiro, C. T. G. V. M. T. Pires, W. Cheuquepan,
J. L. Bott-Neto, J. Solla-Gullon, P. S. Fernandez. Bi-modified Pt Electrodes toward
Glycerol Electrooxidation in Alkaline Solution: Effects on Activity and Selectivity. ACS
Catal. 9 (2019) 5104−5110.
55. A. C. Garcia, Y. Y. Birdja, G. Tremiliosi-Filho, M. T .M. Koper, Glycerol electro-oxidation
56. C. Coutanceau, A. Zalineeva, S. Baranton, M. Simoes. Modification of palladium surfaces
by bismuth adatoms or clusters: Effect on electrochemical activity and selectivity towards
polyol electrooxidation. Int. J Hyd. energy 39 (2014) 15877–15886.
57. R. R. Adzic, (1984). “Electrocatalysis on surfaces modified by foreign metal adatoms,” in
Advances in Electrochemistry and Electrochemical Engineering, eds. H. Gerisher, C. W.
Table 1. Physicochemical characterization data obtained for Pt/C, Pt0.9Bi0.1/C and Pt0.8Bi0.2/C.
Pt/C Pt0.9Bi0.1/C Pt0.8Bi0.2/C
Metal loading TGA
(wt%) 40.5 43.5 37.5 Composition ICP-OES (at%) 100 Pt Bi Pt Bi 92 8 84 16 Composition AAS (at%) 100 Pt Bi Pt Bi 88.2 11.8 78.2 21.8 Particle size (nm) 5.2 4.7 4.7 Crystallite size (nm) 3.5 4.3 3.1 Cell parameter (nm) 0.3916 0.3919 0.3926 Composition XPS (at%) Fresh catalysts
Pt0: 79 Bi total: 21 Pt0: 72 Bitotal: 28 Bi(OH)2: 72 % Bi(OH) 3: 22% Bi2O4: 6% Bi0 9 % Bi(OH)2: 34% Bi(OH) 3: 51% Bi2O:6% Composition XPS (at%) Catalysts after 10 potential cycles Pt0: 79 Bi total: 21 Pt0: 71 Bitotal: 29 Bi(OH)2: 87 % Bi(OH)3: 8% Bi2O4: 5% Bi(OH)2: 69% Bi(OH)3: 20% Bi2O4: 11%
Figure caption
Figure 1. Plots of the pair part of the interaction potentials as a function of the interatomic distance (r) used in the MD simulations. blue line: VPtPt(r); red line: VBiBi(r); grey line: VPtBi(r).
Figure 2. Snapshot of the final clusters at 10 ns. Argon atom (4000) are not represented for clarity. (nPt + nBi) = 500. (a) Pt alone (b) Pt0.9Bi0.1 (c) Pt0.8Bi0.2.
Figure 3. (a,b,c) TEM images and (d,e,f) corresponding histograms of particle size distribution from TEM observations on (a,d) Pt/C, (b,e) Pt0.9Bi0.1/C and (c,f) Pt0.8Au0.2/C.
Figure 4. XRD diffraction patterns of Pt/C (black line), Pt0.9Bi0.1/C (red line) and Pt0.t8Bi0.2/C
catalysts (blue line).
Figure 5. XPS spectra for Pt 4f and Bi 4f orbitals (a,b) on fresh Pt0.9Bi0.1/C, (c,d) on fresh
Pt0.8Bi0.2/C catalysts, (e,f) on cycled Pt0.9Bi0.1/C and (g,h) on cycled Pt0.8Bi0.2/C (10
voltammetric cycles between 0.05 and 1.00 V vs RHE at 20°C in 0.1 M NaOH electrolyte).
Figure 6. (a) Tenth stable cyclic voltammograms of Pt/C (black line), Pt0.9Bi0.1/C (red line)
and Pt0.8Bi0.2/C (blue line) materials and (b) cyclic voltammograms recorded after 1000
potential cycles between 0.05 and 1.20 V vs RHE at 50 mV s-1 on Pt0.9Bi0.1/C (red line) and
Pt0.8Bi0.2/C (blue line) materials (v = 5 mV s-1, N2-saturated 0.1 M NaOH electrolyte, T = 20
°C).
Figure 7. (a) Polarization curves of 0.1 M glycerol oxidation recorded (a) after 10 potential cycles between 0.05 and 1.00 V in N2-purged glycerol-free electrolyte at Pt/C (black line),
Pt0.9Bi0.1/C (red line) and Pt0.8Bi0.2/C (blue line) materials (v = 5 mV s-1, N2-saturated 0.1 M
NaOH electrolyte, T = 20 °C); (b) after 1000 cycles between 0.05 and 1.00 V in N2-purged
glycerol-free electrolyte at Pt0.9Bi0.1/C (red line) and Pt0.8Bi0.2/C (blue line) catalysts (v = 5 mV
Figure 3 1 2 3 4 5 6 7 8 9 10 0 10 20 30 40 50 60 Freq ue nc y (%) Size (nm) 1 2 3 4 5 6 7 8 9 10 0 10 20 30 40 50 60 Freq ue nc y (%) Size (nm) 1 2 3 4 5 6 7 8 9 10 0 10 20 30 40 50 60 Freq ue nc y (%) Size(nm)
a
b
c
d
e
f
Figure 5
80 75 70 65
Binding Energy (eV)
10000 CPS
170 165 160 155
Binding Energy (eV)
5000 CPS
80 75 70 65
Binding Energy (eV)
5000 CPS
80 75 70 65
Binding Energy (eV)
10000 CPS
170 165 160 155
Binding Energy (eV)
5000 CPS
80 75 70 65
Binding Energy (eV)
5000 CPS
170 165 160 155
Binding Energy (eV)
2000 CPS
a
b
c
d
e
f
g
h
170 165 160 155Binding Energy (eV)