HAL Id: insu-01769225
https://hal-insu.archives-ouvertes.fr/insu-01769225
Submitted on 4 Nov 2020HAL is a multi-disciplinary open access archive for the deposit and dissemination of sci-entific research documents, whether they are pub-lished or not. The documents may come from teaching and research institutions in France or abroad, or from public or private research centers.
L’archive ouverte pluridisciplinaire HAL, est destinée au dépôt et à la diffusion de documents scientifiques de niveau recherche, publiés ou non, émanant des établissements d’enseignement et de recherche français ou étrangers, des laboratoires publics ou privés.
Atmospheric CO2 measurements with a 2-µm DIAL
instrument
Erwan Cadiou, Jean-Baptiste Dherbecourt, Guillaume Gorju, Jean-Michel
Melkonian, Antoine Godard, Jacques Pelon, Myriam Raybaut
To cite this version:
Erwan Cadiou, Jean-Baptiste Dherbecourt, Guillaume Gorju, Jean-Michel Melkonian, Antoine Go-dard, et al.. Atmospheric CO2 measurements with a 2-µm DIAL instrument. EPJ Web of Conferences, EDP Sciences, 2018, (The 28th International Laser Radar Conference (ILRC 28), Bucharest 2017), 176, art. 05045 (4 p.). �10.1051/epjconf/201817605045�. �insu-01769225�
A
TMOSPHERICCO
2 MEASUREMENTS WITH A2-
µmDIAL
INSTRUMENT Erwan Cadiou1,2, Jean-Baptiste Dherbecourt1*, Guillaume Gorju1,Jean-Michel Melkonian1, Antoine Godard1, Jacques Pelon3, Myriam Raybaut1 1
ONERA, The French Aerospace Lab, Chemin de la Hunière, F-91761 Palaiseau cedex, France 2
CNES, centre de Toulouse, 18 avenue Edouard Belin, F-31401 Toulouse cedex 9, France 3
LATMOS, Université Pierre et Marie Curie, 4 Place Jussieu Paris, France
ABSTRACT
We report on ground-based atmospheric concentration measurements of carbon dioxide, using a pulsed direct detection differential absorption lidar operating at 2051 nm. The transmitter is based on a tunable parametric source emitting 10-mJ energy, 10-ns duration Fourier-limited pulses. Range resolved concentration measurements have been carried out on the aerosol back-scattered signal. Cloud signals have been used to get long range integrated-path measurements.
1 INTRODUCTION
Space born differential absorption lidar (DIAL) measurements give some new opportunities to better understand the cycles of the three main greenhouse gases: CO2, CH4 and water vapor.
Such instruments allow monitoring these gases during day and night and at high latitude which current passive missions cannot do. The spatially resolved data provided would better constraint the greenhouse gases transport models and help identify their sources and sink [1,2]. Then several DIAL missions are in preparation: Merlin (CNES/DLR) to measure CH4 and ASCENDS
(NASA) for CO2. One of the challenges of these
missions is to get robust laser sources emitting at least two wavelengths (inside and outside an absorption line of the gas) to perform the DIAL measurement.
In the 2 µm spectral region, the gases of interest present particularly well-suited lines for space-borne applications which can be efficiently addressed by solid state laser technologies [3,4]. In this paper we present long-range absorption measurements on the R30 2-µm absorption line of the CO2. The lidar transmitter is based on a nested
cavity oscillator (NesCOPO) whose wide tunability in the 1.98 - 2.3 µm range allows targeting the three species of interest [5,6].
2 LASER TRANSMITTER
The experimental set-up is depicted in Fig. 2. The whole system is pumped by a single frequency Nd:YAG laser delivering 100 mJ-energy, 12 ns pulses at a 30 Hz repetition rate. In order to reach a high energy level while maintaining a nearly diffraction limited beam quality, a MOPA architecture has been implemented.
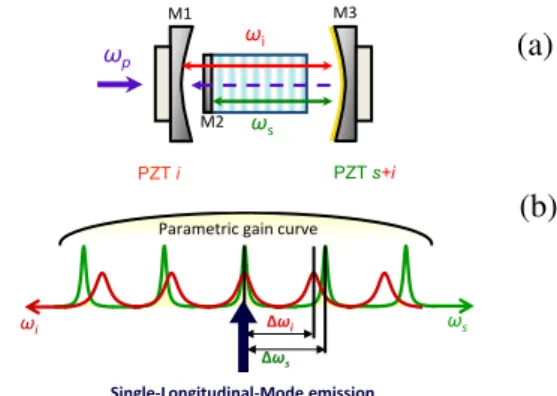
The master oscillator is a NesCOPO with a 10 mm long type II periodically poled lithium niobate (PPLN) nonlinear crystal used close to degeneracy and composed of several gratings with different poling periods. Single-longitudinal-emission is ensured by a dissociation of the two-cavity length in the 10 % range, leading to a single coincidence of signal and idler modes within the parametric gain bandwidth. The two mirrors of the signal cavity are mounted on piezo-electric transducers allowing shifting the signal and idler mode combs. In this way, the coincidence between the two combs can be adjusted and the emitted wavelength tuned with a very high precision.
Figure 1 (a) NesCOPO device. Signal and idler cavities can be adjusted independently by the mean of
piezoelectric transducers. (b) Signal and Idler modes overlap: with adequate dissociation, a single frequency
is emitted. ωs ωi M1 M2 M3 ωp PZT i PZT s+i Single-Longitudinal-Mode emission ωi ωs
Parametric gain curve
Δωi
Δωs
(a)
The NesCOPO is followed by parametric amplifier stages including a type 0, 12 mm long PPLN crystal and four 20 mm long bulk KTP (Potassium titanyl phosphate) crystals. The oscillation build-up time of the NesCOPO is compensated by a delay line inserted in the pump beam path before the amplifiers. To maintain the beam quality at the output the KTP crystals are oriented in a walk-off compensation configuration. A dichroic mirror is inserted between the second and the third crystal to mitigate back-conversion defects, following the approach from [7].
Figure 2 Schematic diagram of the MOPA overall design
The emitter delivers 10 ns pulses tunable between 1980 nm and 2300 nm. In the following lidar experiments, the available energy at 2051 nm was in the 5 - 10 mJ range. The signal beam factor was measured from the 16 % - 84 % knife edge widths method, and estimated to be 𝑀𝑀2� ��� for both vertical and horizontal directions.
The signal frequency is measured shot by shot by a WSU 10 High Finesse wavemeter. In order to match with the wavemeter spectral sensitivity, the signal frequency is doubled with a KTP crystal. The half maximum linewidth of the emitter was characterized to be narrower than 60 MHz through heterodyne beat-note analysis with a reference laser diode [5].
3 SPECTRAL PURITY
An important property that characterizes the ability of a laser source to perform precise DIAL measurements is its spectral purity. It is defined as the ratio of the energy contained in a narrow spectral bandwidth to the total output energy. The purity requirements for spaceborne greenhouse gases remote sensing are extremely high with a
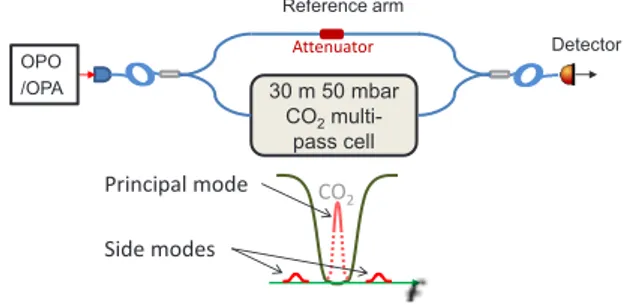
ratio better than 99.9 % [3]. The spectral purity of the parametric MOPA source can be monitored with the system depicted in Fig. 2 (a) following the approach from [8]. The measurement consists in tuning the source at the center of a spectroscopic line in order to strongly attenuate the main longitudinal mode of the signal through a multipass cell and detect the side modes transmission. In this purpose the MOPA output signal is centered on the 2051 nm CO2 line and coupled to a CO2 30 m multi-pass cell. The pressure of the cell is chosen at 50 mBar, which is sufficiently high to get a transmission inferior to ��−4 on a 600 MHz spectral bandwidth around the center of the line and sufficiently low so that the side modes of the OPO experience a small attenuation (lower than 10 %) as depicted on Fig. 2.
Figure 2 Schematic diagram of the line-center spectral purity measurement experimental set-up. Reference and cell transmitted signals are detected with a 100 ns
delay on the same detector.
The transmission of the cell 𝜏𝜏���� is deduced from the ratio between the energy at the output of the cell and the energy of a reference arm. In our experiment both energies were measured on the same detector. This is made possible by the 100 ns delay separating the pulses of the two arms introduced by the multi-pass-cell. An attenuator is placed on the reference arm to put the reference signal in the same amplitude range as the cell signal. The energy at the output of the cell being superior to the side mode energy, the spectral purity S can be limited by:
𝑆𝑆 𝑆�������������
������ � � � 𝜏𝜏���� (1)
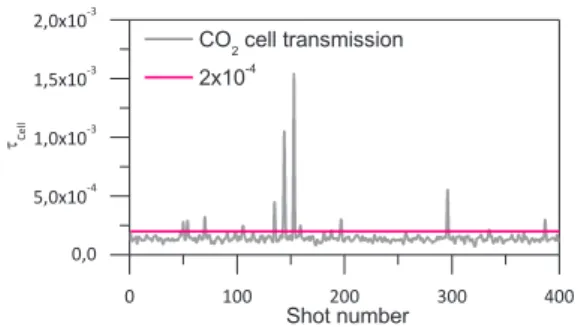
The cell transmission is measured on a shot by shot basis (at 30 Hz). Fig. 3 shows this transmission measurement for 400 consecutive
30 m 50 mbar CO2 multi-pass cell OPO /OPA CO2 Attenuator Reference arm Principal mode Side modes Detector 2
EPJ Web of Conferences 176, 05045 (2018) https://doi.org/10.1051/epjconf/201817605045
The NesCOPO is followed by parametric amplifier stages including a type 0, 12 mm long PPLN crystal and four 20 mm long bulk KTP (Potassium titanyl phosphate) crystals. The oscillation build-up time of the NesCOPO is compensated by a delay line inserted in the pump beam path before the amplifiers. To maintain the beam quality at the output the KTP crystals are oriented in a walk-off compensation configuration. A dichroic mirror is inserted between the second and the third crystal to mitigate back-conversion defects, following the approach from [7].
Figure 2 Schematic diagram of the MOPA overall design
The emitter delivers 10 ns pulses tunable between 1980 nm and 2300 nm. In the following lidar experiments, the available energy at 2051 nm was in the 5 - 10 mJ range. The signal beam factor was measured from the 16 % - 84 % knife edge widths method, and estimated to be 𝑀𝑀2� ��� for both vertical and horizontal directions.
The signal frequency is measured shot by shot by a WSU 10 High Finesse wavemeter. In order to match with the wavemeter spectral sensitivity, the signal frequency is doubled with a KTP crystal. The half maximum linewidth of the emitter was characterized to be narrower than 60 MHz through heterodyne beat-note analysis with a reference laser diode [5].
3 SPECTRAL PURITY
An important property that characterizes the ability of a laser source to perform precise DIAL measurements is its spectral purity. It is defined as the ratio of the energy contained in a narrow spectral bandwidth to the total output energy. The purity requirements for spaceborne greenhouse gases remote sensing are extremely high with a
ratio better than 99.9 % [3]. The spectral purity of the parametric MOPA source can be monitored with the system depicted in Fig. 2 (a) following the approach from [8]. The measurement consists in tuning the source at the center of a spectroscopic line in order to strongly attenuate the main longitudinal mode of the signal through a multipass cell and detect the side modes transmission. In this purpose the MOPA output signal is centered on the 2051 nm CO2 line and coupled to a CO2 30 m multi-pass cell. The pressure of the cell is chosen at 50 mBar, which is sufficiently high to get a transmission inferior to ��−4 on a 600 MHz spectral bandwidth around the center of the line and sufficiently low so that the side modes of the OPO experience a small attenuation (lower than 10 %) as depicted on Fig. 2.
Figure 2 Schematic diagram of the line-center spectral purity measurement experimental set-up. Reference and cell transmitted signals are detected with a 100 ns
delay on the same detector.
The transmission of the cell 𝜏𝜏���� is deduced from the ratio between the energy at the output of the cell and the energy of a reference arm. In our experiment both energies were measured on the same detector. This is made possible by the 100 ns delay separating the pulses of the two arms introduced by the multi-pass-cell. An attenuator is placed on the reference arm to put the reference signal in the same amplitude range as the cell signal. The energy at the output of the cell being superior to the side mode energy, the spectral purity S can be limited by:
𝑆𝑆 𝑆�������������
������ � � � 𝜏𝜏���� (1)
The cell transmission is measured on a shot by shot basis (at 30 Hz). Fig. 3 shows this transmission measurement for 400 consecutive
30 m 50 mbar CO2 multi-pass cell OPO /OPA CO2 Attenuator Reference arm Principal mode Side modes Detector
shots. The purity appears to be better than 99.98% for 95% of the shots.
0 100 200 300 400 0,0 5,0x10⁻⁴ 1,0x10⁻³ 1,5x10⁻³ 2,0x10⁻³ Shot number CO2 cell transmission 2x10⁻⁴ Cell
Figure 3 CO2 cell transmission measured for 400 shots.
4 LIDAR EXPERIMENTS AND RESULTS
To implement atmospheric measurements the emitter output is coupled with a receiver collecting backscattered light. The receiver configuration is shown in Fig. 4. A Newtonian reflector focuses the backscattered light on a 500 µm pin-hole conjugated with a 30 MHz bandwidth uncooled extended InGaAs photodiode. The resulting field of view of 650 µrad is adapted to the transmitted laser beam. Emissions and reception axis overlap to get signal on a maximum range. The lidar axis is oriented at a 45° elevation angle which enables to reach clouds at the top of the boundary layer. The resulting signal is acquired with a 8-bits, 500 MHz digitizer.
Figure 4 Schematic diagram of the receiver Table 1 Experimental parameters
Transmitter Receiver
𝜆𝜆�� 2050.9689 nm Aperture 25.4 cm 𝜆𝜆��� 2050.8008 nm Detector type InGaAs
Energy 5-10 mJ NEP 3 pW/√Hz
Linewidth 60 MHz Bandwidth 30 MHz Divergence 500 µrad FOV 650 µrad
First concentration measurements have been carried out on the CO2 R30 absorption line at 2 µm. Experimental conditions are described in table 1. In order to have on-signal and off-signal backscatter coefficients as close as possible, the emitted wavelength alternates between on-line and off-line at each shot. Following the acquisition, signals are processed according to the following steps:
1. Background subtraction of blind records; 2. Subtraction of the pretrigger offset; 3. Traces are normalized in energy. For the
data used in this paper, the energy is measured by the lidar detector on the light scattered on the transmitter optics. 4. Average at each wavelength; 5. Smoothing by a 50-m hann window. The logarithm of the ratio of the resulting traces ��� and ���� yields the single path differential optical depth:
�𝐴𝐴���𝑟𝑟� =� � ln �
�����𝑟𝑟�
����𝑟𝑟� � (2) Local dry air volume mixing ratio ���2 is retrieved by evaluating the slope of the single path differential optical depth:
���2�𝑟𝑟� =
�
(� − �����𝑟𝑟�)���𝑟𝑟�
𝑑𝑑�𝐴𝐴�� 𝑑𝑑𝑟𝑟 (3) where �� is the weight function defined as :
���𝑟𝑟� = (𝜎𝜎���𝑟𝑟� − 𝜎𝜎����𝑟𝑟�)𝜌𝜌𝑎𝑎𝑎𝑎𝑎𝑎�𝑟𝑟� (4) with 𝜌𝜌𝑎𝑎𝑎𝑎𝑎𝑎 the air density, and 𝜎𝜎�� and 𝜎𝜎��� the cross sections calculated according to the Voigt profile and the Hitran 2012 data base.
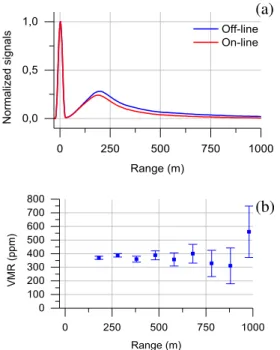
Typical on-line and off-line signals are depicted on Fig. 4 (a) for a total accumulation of 8000 shots. The Fig. 4 (b) shows ���2 obtained for a Δ𝑟𝑟 = ��� 𝑚𝑚 resolution.
On each range gate Δ𝑟𝑟, the slope of the differential optical depth is evaluated by a linear least square regression. Standard deviation errors are calculated from the noise measured on the pretrigger signal. In the first 600 m, the retrieved concentration lies between 350 and 400 ppm with a precision varying from 5 to 15% depending of the signal to noise ratio (SNR) which decreases with the measurement range. Some biases coming
from the digitizer are expected to introduce additional errors up to 25% of the retrieved CO2
concentration for low SNR beyond 750 m.
0 250 500 750 1000 0,0 0,5 1,0 Off-line On-line N or m aliz ed signals Range (m) 0 250 500 750 1000 0 100 200 300 400 500 600 700 800 VM R (p pm ) Range (m)
Figure 4 (a) OFF-line and ON-line return signals for a total of 8 000 shots (10 minutes) (b) Atmospheric dry air ��2 mixing ratio retrieved from the signal with a 200 m spatial resolution. Error bars represents the RMS measurement errors due to the detector noise.
5 CONCLUSIONS
We presented CO2 DIAL measurements using a
NesCOPO allowing targeting the three main green-house gases of interest. Preliminary range-resolved measurements on CO2 have been
presented. Further improvements will consist in improving the performances of the instrument by limiting biases and optimize the transmitter and receiver units, and carrying out measurement on other species, namely CH4 and H2O.
ACKNOWLEDGEMENTS
This work is partially supported by the CNES Research and Technology program.
References
[1] D. M. Hammerling, S. R. Kawa, K. Schaefer, S. Doney, and A. M. Michalak, 2015: Detectability of CO2 flux signals by a space-based lidar mission, J. Geophys. Res. Atmos. 120, 1794–1807.
[2] C. Weaver, C. Kiemle, S. R. Kawa, T. Aalto, J. Necki, M. Steinbacher, J. Arduini, F. Apadula, H. Berkhout, and J. Hatakka, 2014: Retrieval of methane source strengths in Europe using a simple modeling approach to assess the potential of spaceborne lidar observations, Atmos. Chem. Phys. 14, 2625–2637.
[3] G. Ehret, C. Kiemle, M. Wirth, A. Amediek, A. Fix, and S. Houweling, 2008: Space-borne remote sensing of CO2, CH4, and N2O by integrated path differential absorption lidar: a sensitivity analysis, Appl. Phys. B 90, 593–608. [4] J. Caron and Y. Durand, 2009: Operating
wavelengths optimization for a spaceborne lidar measuring atmospheric CO2., Appl. Opt. 48, 5413–22.
[5] J. Barrientos Barria, A. Dobroc, H. Coudert-Alteirac, M. Raybaut, N. Cézard, J.-B. Dherbecourt, T. Schmid, B. Faure, G. Souhaité, J. Pelon, J.-M. Melkonian, A. Godard, and M.
Lefebvre, 2014: Simultaneous remote
monitoring of atmospheric methane and water vapor using an integrated path DIAL instrument based on a widely tunable optical parametric source, Appl. Phys. B 117, 509–518. [6] J. Barrientos Barria, D. Mammez, E. Cadiou,
J.-B. Dherbecourt, M. Raybaut, T. Schmid, A. Bresson, J.-M. Melkonian, A. Godard, J. Pelon, and M. Lefebvre, 2014: Multispecies high-energy emitter for CO2, CH4, and H2O
monitoring in the 2 μm range," Opt. Lett. 39, 6719–22.
[7] G. Arisholm, O. Nordseth, and G. Rustad, 2004: Optical parametric master oscillator and power amplifier for efficient conversion of high-energy pulses with high beam quality, Opt. Express 12, 4189.
[8] G. Ehret, A. Fix, V. Weiss, G. Poberaj, and T. Baumert, 1998: Diode-laser-seeded optical parametric oscillator for airborne water vapor DIAL application in the upper troposphere and lower stratosphere, Appl. Phys. B Lasers Opt. 67, 427–431
(a)
(b)
4
EPJ Web of Conferences 176, 05045 (2018) https://doi.org/10.1051/epjconf/201817605045