Discovery of Reactive Microbiota-Derived
Metabolites that Inhibit Host Proteases
The MIT Faculty has made this article openly available.
Please share
how this access benefits you. Your story matters.
Citation
Guo, Chun-Jun et al. “Discovery of Reactive Microbiota-Derived
Metabolites That Inhibit Host Proteases.” Cell 168, 3 (January 2017):
517–526 © 2017 Elsevier Inc
As Published
http://dx.doi.org/10.1016/J.CELL.2016.12.021
Publisher
Elsevier BV
Version
Author's final manuscript
Citable link
http://hdl.handle.net/1721.1/117726
Terms of Use
Creative Commons Attribution-NonCommercial-NoDerivs License
Discovery of reactive microbiota-derived metabolites that inhibit
host proteases
Chun-Jun Guo1, Fang-Yuan Chang2, Thomas P. Wyche3, Keriann M. Backus4, Timothy M. Acker5, Masanori Funabashi1, Mao Taketani1, Mohamed S. Donia6, Stephen Nayfach7, Katherine S. Pollard7, Charles S. Craik5, Benjamin F. Cravatt4, Jon Clardy3, Christopher A. Voigt2, and Michael A. Fischbach1,*
1Department of Bioengineering and Therapeutic Sciences and California Institute for Quantitative
Biosciences, University of California, San Francisco, San Francisco, CA 94158, USA
2Department of Biological Engineering and Synthetic Biology Center, Massachusetts Institute of
Technology, Cambridge, MA 02115, USA
3Department of Biological Chemistry and Molecular Pharmacology, Harvard Medical School,
Boston, MA 02115, USA
4Department of Chemical Physiology, The Scripps Research Institute, La Jolla, California 92307,
USA
5Department of Pharmaceutical Chemistry, University of California, San Francisco, San Francisco,
CA 94158, USA
6Department of Molecular Biology, Princeton University, Princeton, NJ 08544, USA
7Integrative Program in Quantitative Biology, Gladstone Institutes, and Division of Biostatistics,
University of California, San Francisco, San Francisco, CA 94143, USA
SUMMARY
The gut microbiota modulate host biology in numerous ways, but little is known about the molecular mediators of these interactions. Previously, we found a widely distributed family of nonribosomal peptide synthetase gene clusters in gut bacteria. Here, by expressing a subset of these clusters in Escherichia coli or Bacillus subtilis, we show that they encode pyrazinones and dihydropyrazinones. At least one of the 47 clusters is present in 88% of the NIH HMP stool
Correspondence and lead contact: [email protected].
• DATA AND SOFTWARE AVAILABILITY
A supplementary data set including all the NMR information about the compounds characterized in this study (Data File S1) and a supplementary data table including all the cysteine targets identified in target identification experiments (Data File S2) and can be found with this article online at
AUTHOR CONTRIBUTIONS
Conceptualization, C.J.G. and M.A.F.; Investigation, C.J.G., F.Y.C., T.P.W., K.M.B., T.M.A., M.F., M.T., M.S.D., and S.N.; Writing – Original Draft, C.J.G. and M.A.F.; Writing – Review & Editing, F.Y.C., T.P.W., T.M.A., K.M.B., M.F., M.T., M.S.D., S.N., K.S.P., C.S.C., B.F.C., J.C., and C.A.V.; Funding Acquisition and Supervision, M.S.D., K.S.P., C.S.C., B.F.C., J.C., C.A.V., and M.A.F.
Publisher's Disclaimer: This is a PDF file of an unedited manuscript that has been accepted for publication. As a service to our
customers we are providing this early version of the manuscript. The manuscript will undergo copyediting, typesetting, and review of
HHS Public Access
Author manuscript
Cell
. Author manuscript; available in PMC 2018 January 26.Published in final edited form as:
Cell. 2017 January 26; 168(3): 517–526.e18. doi:10.1016/j.cell.2016.12.021.
A
uthor Man
uscr
ipt
A
uthor Man
uscr
ipt
A
uthor Man
uscr
ipt
A
uthor Man
uscr
ipt
samples, and they are transcribed under conditions of host colonization. We present evidence that the active form of these molecules is the initially released peptide aldehyde, which bears potent protease inhibitory activity and selectively targets a subset of cathepsins in human cell proteomes. Our findings show that an approach combining bioinformatics and heterologous gene cluster expression can rapidly expand our knowledge of the metabolic potential of the microbiota while avoiding the challenges of cultivating fastidious commensals.
eTOC
Discovery of a new family of microbial metabolites, that is widely expressed by the microbes of the human gut, and that chemically modify host cellular proteins.
INTRODUCTION
The microbiota influence host biology in numerous ways, very few of which are understood at the level of molecular mechanism (Donia and Fischbach, 2015; Lee and Hase, 2014; Nicholson et al., 2012). In a previous survey of biosynthetic gene clusters from the human microbiome, we reported the presence of thousands of biosynthetic loci of unknown function, including large families that are present in >50% of the subjects from the NIH Human Microbiome Project (Donia et al., 2014). The small molecule products of these genetic elements represent large gaps in our knowledge of what the microbiota are capable of producing, and constitute an enticing opportunity to discover new mediators of
interspecies interactions.
As a test case for expanding our knowledge of the biosynthetic capacity of the microbiota, we set out to characterize a family of nonribosomal peptide synthetase (NRPS) gene clusters that are found in a variety of gut bacterial genome sequences (Donia et al., 2014). These clusters attracted our attention for two reasons: First, they are present in >90% of the stool samples from the HMP, suggesting that the metabolites they encode are widely distributed among healthy humans. Second, they reside almost exclusively in gut bacterial genome
A
uthor Man
uscr
ipt
A
uthor Man
uscr
ipt
A
uthor Man
uscr
ipt
A
uthor Man
uscr
ipt
sequences; only a few environmental isolates harbor a cluster in the family, raising the possibility that their small molecule products play a role in interspecies signaling in the gut.
RESULTS
Computational analysis of the gut NRPS cluster family
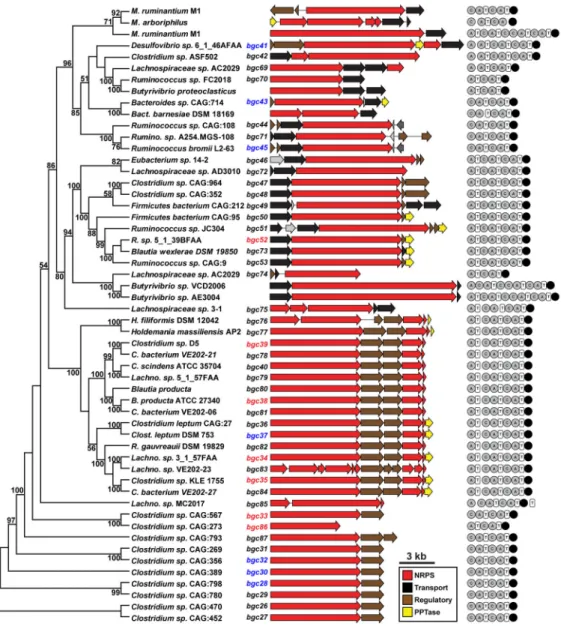
We began by performing a multi-gene BLAST search (Medema et al., 2013) to identify new clusters in the family from genome sequences that had been deposited since our previous analysis. This search yielded 19 new clusters at a threshold of 30% average sequence identity, increasing the size of the family to 47 (Figure 1). The resulting reanalysis shows a family that has the following characteristics: 1) It consists of four clades: one featuring a three-module NRPS (e.g., bgc52), another with a two-module NRPS and a loading module on a separate protein (e.g., bgc35), a third consisting solely of a two-module NRPS (e.g., bgc26), and a fourth containing NRPSs of variable domain architecture. In every case, the NRPS features a terminal reductase (R) domain. 2) Almost all of the gene clusters are found in anaerobic Firmicutes from the class Clostridia, although a few of the clusters are found in Gram-negative organisms (Bacteroides and Desulfovibrio). 3) Nearly all of the clusters reside in isolates from the human gut and that of other mammals (Figure 1). Very few of the clusters are found in relatives of these organisms that are free-living or inhabit a non-intestinal host-associated niche, implying a function that is relevant to the biology of host colonization. 4) Each clade contains clusters from hosts that have never been isolated; genome sequences of the hosts from which these clusters derive were assembled from metagenomic samples in a recent study (Nielsen et al., 2014). As such, the only way to access these clusters is to synthesize them, a problem of increasing importance as the volume of metagenomic sequence data increases and tools are developed for assembling short-read metagenomic data into cluster-size fragments.
We selected 14 of these clusters for analysis, colored red or blue in Figure 1. Clusters were chosen to represent the diversity of sequences and domain architectures from the four clades of the family. Since none of the host organisms have been manipulated genetically and most are from a bacterial class (Clostridia) that is largely refractory to genetic manipulation, we decided not to make targeted genetic deletions in any of the native host strains. Instead, we expressed gene clusters heterologously in two commonly used laboratory hosts, Escherichia coli and Bacillus subtilis. The host organisms of three of the clusters (bgc34, bgc35, bgc52) were available from laboratories or culture collections; clusters from these hosts were cloned in their native form (omitting regulatory genes) into E. coli or B. subtilis vectors in which expression was driven by a strong promoter (see Figure S1 for more details). The remaining 11 clusters were either from organisms that could not be obtained or from metagenomic sequence data, so the host organism was never isolated. These clusters were synthesized directly from primary genome or metagenome sequence with optimized codons (leaving out regulatory genes) and cloned into E. coli or B. subtilis expression vectors under the control of a strong promoter. Cluster-harboring strains were cultivated at 5 ml scale for 1–2 days to determine whether they produce a pathway-specific metabolite.
A
uthor Man
uscr
ipt
A
uthor Man
uscr
ipt
A
uthor Man
uscr
ipt
A
uthor Man
uscr
ipt
Experimental analysis of the gut NRPS gene clusters
LC-MS analysis of culture fluid extract from E. coli strains harboring bgc35 and bgc52 showed evidence of seven and eight new peaks, respectively (Figure 2), which is notable since both clusters are from Gram-positive hosts. From 4 L of culture fluid, we purified multi-milligram quantities of each compound (Figure 2). Three lines of evidence reveal that these molecules are a family of pyrazinones and dihydropyrazinones: 1) The purified compounds have UV absorption maxima 220 and 300 nm, consistent with a pyrazinone core. 2) High-resolution LC-MS analysis of the compounds yields masses and empirical formulae consistent with a series of α-amino-acid-derived pyrazinones and dihydropyrazinones with variable sidechains at both positions (Table S4). 3) 1D and 2D NMR experiments show chemical shifts and correlations characteristic of pyrazinones (Data file S1) (MacDonald et al., 1976). An E. coli strain harboring bgc34 produced a subset of the bgc35 products, but at a level so low it would not have been observed without a targeted mass ion search.
Results from two other clusters showed additional modes of diversity in the family. When bgc38 was expressed in B. subtilis, we observed one new peak corresponding to a
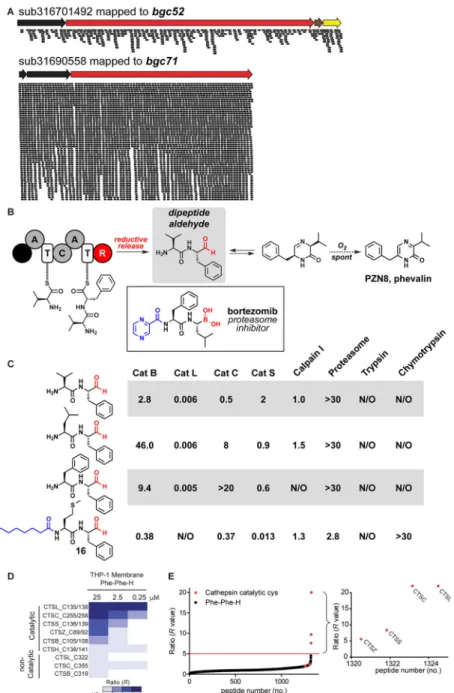
pyrazinone with ethyl and methylindole side chains, indicating that α-aminobutyrate (or an unknown precursor) can be a native monomer; bgc39 was a low-level producer of the bgc38 products. bgc33 and bgc86 were of particular interest: these clusters were discovered from a metagenomic sample, so their host organisms were never isolated (Figure 1). An E. coli strain carrying a synthetic, codon-optimized version of bgc33 yielded two classes of molecules: a pyrazinone that derives from methionine and valine (15), and a corresponding set of N-acylated dipeptide aldehydes, including one that bears an N-octanoyl acyl chain (16) (Figure 2 and Table S5). In comparison, only the pyrazinone product (15) can be identified from the E. coli strain harboring bgc86.
In addition to the 16 molecules that were produced at a titer sufficient to purify milligram quantities for NMR experiments, we identified 16 additional pathway-dependent molecules from bgc35 and bgc52. These metabolites are produced at a lower titer and their structures are proposed on the basis of diagnostic high-resolution MS/MS fragmentation patterns (Figure S2 and Table S4). In addition to the seven clusters from which we observed
products, seven additional clusters were synthesized and expressed in E. coli DH10β, E. coli BAP1, or B. subtilis 168 (colored blue in Figure 1); no high-titer products were observed from any of these BGCs using an LC-MS trace comparison. In total, from 7 of 14
heterologously expressed clusters, we discovered 32 compounds, of which 28 are previously unknown molecules (Figure 2 and Table S4).
The same molecules are produced by a native strain and in a biochemical reconstitution
The results from our heterologous expression experiments raise an important question: Are the molecules we isolated the native products of the cluster or artifacts of expression in E. coli or B. subtilis? To address this question, we used two complementary approaches. First, we cultivated the bgc52 producer, Ruminococcus sp. 5_1_39BFAA, in ten different culture media in an effort to find a condition under which we could observe production of the bgc52 products. LC-MS analysis of cell-free culture extracts from one of the media, M17, revealed peaks identical to five of the most prominent compounds produced under conditions of
A
uthor Man
uscr
ipt
A
uthor Man
uscr
ipt
A
uthor Man
uscr
ipt
A
uthor Man
uscr
ipt
heterologous expression in E. coli (Figure S3), suggesting that these pyrazinones are the native products of bgc52 (it is unlikely these compounds derive from a different biosynthetic pathway in the same organism, since Ruminococcus sp. 5_1_39BFAA harbors only one additional nonribosomal peptide synthetase in its genome, a condensation-thiolation di-domain protein).
Using a similar approach, we could not find a condition under which the bgc35 producer, Clostridium sp. KLE 1755, produced the molecules we observed from E. coli-bgc35. As an alternative approach, we overexpressed the 280 kDa, two-module bgc35 NRPS in E. coli and purified it as an N-terminal His6 fusion protein. We then attempted to reconstitute the
biosynthetic pathway by incubating the NRPS with Sfp and coenzyme A (to 4 ′-phosphopantetheinylate both thiolation domains), amino acid substrates (either all 20 proteinogenic amino acids or aromatic amino acids only), ATP for monomer activation, and NADH as a cofactor for the terminal reductase domain. LC-MS analysis of a time course of this reaction showed the formation of two products identical to compounds 2 and 4, suggesting that these are native products of bgc35 (Figure 2).
The gut NRPS family is widely distributed in healthy humans
Having identified the small molecule products of a subset of the gut NRPS family, we next turned to the question of how widely distributed this cluster family is in the human population. In previous work, we showed that of the smaller subset of 28 clusters that was known at the time, at least one cluster was present in >90% of the ~100 stool metagenomic samples from the HMP phase I. These data were derived from a global analysis that involved mapping metagenomic reads to proteins from 14,000 BGCs using the fast, metagenomics-optimized algorithm mBLASTx (Donia et al., 2014). Here, we used two complementary methods to determine the abundance of the gut NRPS family in publicly available metagenomic data sets. First, since we had a smaller set of BGCs to map, we developed a highly sensitive and specific analytical method in which we used BLASTn to map quality-filtered metagenomic reads from the 149 metagenomic stool samples from HMP Phase I to the large NRPS gene in each BGC. Using this analysis, we found that at least one of the clusters is present in >88% of the 149 stool samples. Second, we used a recently developed approach that leverages a large gene catalog of >9 million gut microbiome genes (Nayfach et al., 2015), and found that at least one of the clusters was present in >93% of 1,267 publicly available stool samples. Together, these results confirm that this gene cluster family is widely distributed in healthy human subjects.
Gut NRPS clusters are actively transcribed under conditions of host colonization
A cluster might be present in a metagenomic sample but not expressed in the gut; indeed, many metabolic pathways present in metagenomic samples are expressed at very low levels in corresponding metatranscriptomic data sets (Franzosa et al., 2014; Gosalbes et al., 2011). To address whether the gut NRPS clusters are transcribed under conditions of native host colonization, we recruited reads from publicly available RNA sequencing (RNA-seq) data sets from the stool samples of eight healthy subjects (Franzosa et al., 2014). Illumina reads from several runs on each sample were combined and used to construct a BLAST database, which we then searched using the 47 full-length gut NRPS BGCs as query sequences. Seven
A
uthor Man
uscr
ipt
A
uthor Man
uscr
ipt
A
uthor Man
uscr
ipt
A
uthor Man
uscr
ipt
of the eight samples (87.5%) harbored at least one actively transcribed gene cluster from this family, and the robust level of transcription observed in most samples is notable, given that the anaerobic Firmicutes from which the gut NRPS clusters derive are often lower
abundance members of the community. (Figures 3 and S4).
The active gut NRPS product may be the initially released dipeptide aldehydes
The NRPSs in this family harbor a C-terminal reductase domain that catalyzes the chain-terminating release of a C-terminal aldehyde (Figures 1 and 3). The newly liberated dipeptide aldehydes exist in equilibrium with the cyclic imine; in the presence of oxygen, this dihydropyrazinone oxidizes spontaneously and irreversibly to the fully aromatic pyrazinone. Three lines of evidence suggest that the active form of the gut NRPS product is the initially released dipeptide aldehyde:
First, under physiological conditions, the peptide aldehydes are stable for long enough to be active. We measured the half-life of oxidation for three compounds – the peptide aldehyde versions of 5, 10, and 12 – in vitro at physiological pH: they ranged from 3–28 hr (Figure S5), which would provide sufficient time for systemic distribution in the host. Indeed, compounds 1 and 2 are stable enough that we isolate milligram quantities of the cyclic imine after >24 hr of aerobic E. coli culture. Moreover, these molecules are produced in the gut, which is anaerobic, so the slow process of spontaneous oxidation would not begin until the compounds encounter oxygenated host tissues. Notably, the major product of bgc33, N-octanoyl-Met-Phe-H (16), is N-acylated, preventing it from cyclizing and oxidizing to a pyrazinone. These findings raise the possibility that peptide aldehydes are the predominant active product of every cluster in the family.
Second, peptide aldehydes have a long history in the literature of being highly potent, cell permeable protease inhibitors. Starting with the discovery of the leupeptins from soil isolates of Streptomyces almost four decades ago (Aoyagi et al., 1969a; 1969b), numerous peptide aldehydes – mostly N-carboxybenzyl (Cbz) protected di-, tri-, and tetrapeptide aldehydes – have been synthesized and shown in vitro and in vivo to have potent inhibitory activity against serine and cysteine proteases and the proteasome (Lee and Goldberg, 1998; Otto and Schirmeister, 1997; Thompson, 1973; Westerik and Wolfenden, 1972). Dipeptide aldehydes were the starting point for the development of the clinically used dipeptide boronate proteasome inhibitor bortezomib (Figure 3) (Adams et al., 1998). Cbz-protected versions of multiple gut NRPS products, including Cbz-Val-Phe-H, have been synthesized and shown to inhibit various cysteine proteases (Mehdi et al., 1988; Woo et al., 1995).
Third, since dipeptide aldehydes with a free amino group have not been tested as protease inhibitors, we assessed the activity of three of the bgc52 and bgc35 products (Val-Phe-H, Leu-Phe-H, and Phe-Phe-H) and the bgc33-derived compound 16 against a panel of proteases in vitro, comparing them to the corresponding pyrazinones and N-tert-butyloxycarbonyl (N-Boc) protected dipeptide aldehydes (Figures 3 and S5). Consistent with previous reports on N-Cbz-protected dipeptide aldehydes (Mehdi et al., 1988; Woo et al., 1995), the N-Boc protected dipeptide aldehydes were active at low- to mid-nanomolar against the lysosomal cysteine proteases cathepsins B and L. The free-amino dipeptide aldehydes had similarly potent (single-digit nanomolar) activity against cathepsin L but
A
uthor Man
uscr
ipt
A
uthor Man
uscr
ipt
A
uthor Man
uscr
ipt
A
uthor Man
uscr
ipt
greatly reduced activity against cathepsin B, showing that they are capable of highly potent inhibitory activity and exhibit selectivity not seen in their N-Boc protected counterparts (Figures 3 and S5). This difference in selectivity was also seen in compound 16, which had undetectable activity against cathepsin L but 13 nM activity against cathepsin S. None of the compounds tested here had quantifiable activity against trypsin, chymotrypsin, or the proteasome at the concentrations tested. Overall, these data suggest that the dipeptide aldehydes harbor potent and selective protease inhibitory activity, as assessed in vitro. The proteases we assayed were chosen based on literature precedent, so the enzyme inhibition data do not point to a specific target. To determine the target of the peptide aldehydes in an unbiased way, we applied a quantitative chemical proteomic method, termed isoTOP-ABPP (Weerapana et al. 2010, Backus et al., 2016) to measure the global
interactions of a representative dipeptide aldehyde, bgc35 product Phe-Phe-H, with cysteine residues in the human cell lysates. We treated membrane preparations of the human innate immune (monocytic) cell line THP-1 with the bgc35 product Phe-Phe-H or vehicle, and then these samples were treated with a cysteine reactive iodoacetamide-alkyne (IA-alkyne) probe and conjugated to an isotopically differentiated (heavy or light, respectively) TEV protease-cleavable biotin tag using copper-catalyzed azide–alkyne cycloaddition (CuAAC or click) chemistry. Vehicle- and peptide-treated samples were then combined, enriched, subjected to sequential trypsin and TEV digests and evaluated by LC-MS/MS. Site-specific blockade of IA-alkyne labeling as measured by quantitation of heavy/light MS1 chromatographic peaks designates cysteine residues that are targeted by Phe-Phe-H (heavy/light ratios, or R values > 5, red line; Figures 3D, 3E, and S6). Treatment of THP-1 membranes with 250 nM Phe-Phe-H, the lowest concentration tested, fully blocked IA-alkyne labeling of the catalytic cysteine of cathepsin L (CTSL1; Cys138, R >20), while showing only partial (cathepsin C (CTSC) R >2.78 for catalytic cysteine Cys258) or negligible (R < 2.0; cathepsins B (CTSB), H (CTSH), S (CTSS), and Z (CTSZ)) cross-reactivity with other cathepsins (Figure 3D). Phe-Phe-H also interacted with a subset of additional cathepsin targets when tested at higher concentrations (25 μM; R > 5 for CTSC, CTSS, CTSZ) in THP-1 (Figure 3D, E) and other human cell proteomes (Ramos, H1975; Data File S2). Phe-Phe-H showed remarkable selectivity for cathepsins, exhibiting no additional targets across the more than 3500 total quantified cysteines across three different human cell proteomes (R < 2.0; Data File S2). Additional experiments at the characteristic acidic pH of the lysosome (pH 5 or 5.5), where cathepsin reside, produced similar results (Data File S2). Together, these data designate the cathepsins (specifically cathepsin L) as principal targets of the gut NRPS product Phe-Phe-H.
Discussion
We have found 32 compounds that represent a subset of the molecular output from this family of NRPSs. Gene clusters in this family are widely distributed in the human gut microbiome, and they are transcribed robustly under conditions of host colonization. The discovery approach we used – to express cloned or synthetic BGCs in E. coli or B. subtilis – revealed two unanticipated findings that may be relevant to similar discovery efforts in the future. First, bgc35 and bgc52 were functional in E. coli in their native form (driven by an E. coli promoter); this is notable, given that these clusters are from a Gram-positive host. E.
A
uthor Man
uscr
ipt
A
uthor Man
uscr
ipt
A
uthor Man
uscr
ipt
A
uthor Man
uscr
ipt
coli might therefore be an appropriate heterologous host for a broader range of gene clusters than previously imagined. Second, the E. coli strain harboring bgc34 produced a subset of the bgc35 products, but at a level so low it would not have been observed without a targeted mass ion search; likewise, bgc39 was a low-level producer of the bgc38 products.
Importantly, the amino acid sequences NRPS genes from the bgc34-bgc35 and bgc38-bgc39 pairs share 70% and 51% identity, respectively, pointing to the potential importance of subtle changes in primary sequence that alter expression level as a determinant of whether an NRPS will work in a heterologous host.
Notably, of the 4 out of 32 molecules that were previously known, three are produced by an unrelated NRPS conserved across all known skin-associated species of Staphylococcus. Thus, the gut and Staphylococcus NRPSs are an example of convergent evolution toward a common scaffold, suggesting that the same compounds might play a biological role in more than one host-associated niche (Wyatt and Magarvey, 2013; Wyatt et al., 2012; Zimmermann and Fischbach, 2010).
We presented three lines of evidence suggesting that the active small molecule products are peptide aldehydes: 1) The free amino dipeptide aldehydes have a half-life of hours, and some compounds in the family are stabilized by N-acylation; 2) peptide aldehydes have a long history in the literature as potent, cell permeable protease inhibitors; and 3) four of our compounds exhibit potent and selective protease inhibitory activity in vitro. From studies of peptide aldehydes and other C-terminally modified peptide protease inhibitors, it has become clear that the sidechains in the inhibitor help occupy the P1 and P2 pockets (Siklos et al., 2015) and a free amino terminus can form specific charge contacts in the active site (Katunuma, 2011; Laine and Busch-Petersen, 2010). Thus, side chain identity and N-terminal acylation state are key determinants of selectivity, potentially helping to explain the breadth of chemical diversity in this family. Mutational experiments with bgc35 show that both adenylation domains participate in generating sidechain chemical diversity (Figure S7). Likewise, an analysis of products from bgc86, a version of bgc33 with a truncated NRPS system, suggests that the starting condensation domain of bgc33 NRPS is responsible for N-acylation (Figure S7).
Our unbiased chemical proteomics experiments suggest that one of the dipeptide aldehydes, Phe-Phe-H, targets the catalytic cysteines of multiple cathepsins, showing the highest potency for cathepsin L. Our substrate assay data with recombinant proteases generally matched our proteomic data, with the exception of CTSC, which was more potently inhibited in proteomes by Phe-Phe-H. This result could indicate that endogenously
expressed CTSC is post-translationally regulated to create a form of the protease that is more sensitive to peptide aldehyde inhibition. Our chemical proteomic studies also revealed that Phe-Phe-H exhibits very high selectivity for cathepsins, as we did not detect any additional cysteines targeted by this peptide aldehyde in human cell lysates. Although these data do not prove a mammalian (rather than bacterial) target for the peptide aldehydes, they raise the possibility that the gut NRPS product acts in the host lysosome. Further support for this premise comes from a recently reported screen for Staphylococcus aureus genes required for survival in and escape from the phagosome (Blättner et al., 2016). Among the top hits was the Staphylococcus NRPS described above (Wyatt and Magarvey, 2013; Wyatt et al., 2012;
A
uthor Man
uscr
ipt
A
uthor Man
uscr
ipt
A
uthor Man
uscr
ipt
A
uthor Man
uscr
ipt
Zimmermann and Fischbach, 2010), which is unrelated to the gut NRPS enzymes but produces two of the same compounds. Although the authors were unaware that the active form of the NRPS product is likely a dipeptide aldehyde rather than a pyrazinone, these data provide independent evidence that the dipeptide aldehydes and the NRPS genes that encode them might play a role in an intracellular niche for bacteria in the phagolysosome.
Taken together, these two lines of evidence raise the intriguing possibility of a previously unknown interaction between the commensal gut microbiota and a cysteine protease system in the host lysosome. Since cathepsins play an important role in antigen processing and presentation in intestinal epithelial cells (Hershberg et al., 1997) and TLR9 activation in macrophages and dendritic cells (Matsumoto et al., 2008; Park et al., 2008), their inhibition by dipeptide aldehydes might block adaptive or innate immune recognition of a subset of anaerobic Firmicutes in the gut.
Another possibility is that dipeptide aldehyde-mediated cathepsin inhibition enables gut mutualists to stably occupy and emerge from a niche in the phagolysosome. Intracellular pathogens commonly inhabit the phagolysosome (Rosenberger and Finlay, 2003), and a subset of Gram-negative pathobionts including Alcaligenes are found in Peyer’s patches and other gut lymphoid tissues (Fung et al., 2014; Maslowski et al., 2009; Obata et al., 2010). Our data raise the possibility that dipeptide aldehydes enables a broad set of mutualistic Gram-positive species to reside in gut epithelial or immune cells. If borne out by subsequent studies, either possibility (cathepsin inhibition by extracellular or intracellular mutualists) would represent a previously undescribed form of immune modulation by the gut
microbiota. In addition, since the small molecules produced by this cluster family harbor a simple and general scaffold (small peptide aldehydes, some of which are N-acylated), it remains possible that some of them exert biological activities distinct from protease inhibition.
Our findings show that an approach combining bioinformatics and heterologous gene cluster expression can rapidly expand our knowledge of the metabolic potential of the microbiota while avoiding the challenges of cultivating fastidious commensals. Given the large number of biosynthetic gene clusters of unknown function in the human microbiome, such an approach holds great potential for discovering, in a scalable fashion, small molecule mediators of microbe-host and microbe-microbe interactions relevant to the biology of the microbiome.
CONTACT FOR REAGENT AND RESOURCE SHARING
Further information may be obtained from the Lead Contact Michael A. Fischbach (Email: [email protected]; address: University of California, San Francisco, San Francisco, California 94143, USA).
METHOD DETAILS
A general scheme of all the experiments and analyses performed in this study can be found in Table S1. Details of the characterized NRPSs, including their host organisms, putative
A
uthor Man
uscr
ipt
A
uthor Man
uscr
ipt
A
uthor Man
uscr
ipt
A
uthor Man
uscr
ipt
substrates, and products can be found in Table S2. Primers used in this study are listed in Tables S3.
Experimental Design
Detailed information about refactoring and synthesizing BGCs in this study—
Since the bacterial species shown in Figure 1 have not been manipulated genetically, we decided not to use a targeted gene deletion strategy. Instead, we expressed these BGCs heterologously in hosts whose genetic systems have been well developed. Each BGC contains a core biosynthetic gene encoding an NRPS. Two extra genes, which putatively encode an A domain and a T domain (e.g., bgc35) are in close proximity to their core NRPS genes. In addition, a 4′-phosphopantetheinyl transferase (PPTase) gene is located at 3′ end of some of the BGCs. PPTase enzymes, such as Sfp from B. subtilis, catalyze an essential posttranslational modification in NRP biosynthesis (Reuter et al., 1999). The targeted BGCs were reconstructed by excising regulatory genes which, we presumed, are not directly involved in the biochemical steps of the biosynthetic pathway. Other genes, including those that encode the core NRPS, the extra A and T domains, the PPTase, and some transporter genes, remain intact in our assembled BGCs.
For molecular cloning experiments, BGCs are divided into two categories. BGCs from hosts we could obtain were assembled in the pGFPuv vector and heterologously expressed in E. coli DH10β (Figure S1). BGCs from hosts that were not accessible were synthesized by GenScript. For any BGCs without a PPTase gene, we included a PPTase at the 3′ end of the assembled cluster. The synthesized clusters were codon-optimized for their expression host (either E. coli or B. subtilis) and assembled into their respective vectors for heterologous expression.
Strains and molecular genetic manipulations—BGCs expressed in E. coli (Figure 1, colored red or blue) were regulated by the lac promoter except bgc33 (T7 promoter) (Figure S1). BGCs expressed in B. subtilis 168 are regulated by the hyper-Pspac promoter. bgc34, bgc35, bgc41, bgc43, and bgc52 were assembled in the vector pGFPuv and verified by sequencing (Figure S1). Synthetic, codon-optimized versions of bgc33 and bgc86 were assembled in the vector pET28a and verified by sequencing. Synthetic, codon-optimized versions of bgc28, bgc30, bgc32, bgc37, bgc38, bgc39, and bgc45 were synthesized in pMSD and verified by sequencing. To verify that clusters integrated properly into the chromosome of B. subtilis, we performed diagnostic PCR according to a scheme detailed in Figure S1.
1. Assembling bgc34, bgc35, and bgc52 with pGFPuv vector: Due to the relatively large size of these BGCs, regulatory components in these BGCs were omitted. The genes essential for biosynthesis were PCR amplified using Q5 hot start high-fidelity DNA polymerase (See Table S3 and Figure S1). Three fragments for each BGC were synthesized and assembled with pGFPuv vector using either In-Fusion cloning kit (bgc34 and bgc35) or Gibson assembly kit (bgc52). The assembled reaction mixture was further purified using Zymo DNA Clean and Concentrator kit and transformed into commercial E. coli DH10β competent cells (Invitrogen). Upon transformation, transformants that are resistant to
A
uthor Man
uscr
ipt
A
uthor Man
uscr
ipt
A
uthor Man
uscr
ipt
A
uthor Man
uscr
ipt
carbenicillin (carb) were first streaked on LB agar supplemented with carb (100 μg/ml) followed by diagnostic PCR using primer set F5 (Bgc34_F3 for bgc34) and pGFP-Diag-R (Table S3). Positive hits (mutants carrying assembled plasmids) were then cultivated in 10 ml LB + carb at 30 °C, 225 rpm for 24 hours for plasmid extraction. The assembled plasmids were extracted using Qiagen Miniprep Kits and further verified by sequencing. 2. Heterologous expression (HE) of bgc28, bgc30, bgc32, bgc37, bgc38, bgc39, and bgc45 in B. subtilis and transformation of bgc41 and bgc43 in E. coli: These BGCs were synthesized and codon optimized for their specific expression strains by GenScript. For transformation of B. subtilis, the synthesized BGCs were assembled into the pMSD vector (see Figure S1) and around 80 ng of total DNA was added into 1 ml of protoplast solution for each individual transformation. The transformants were then further verified by diagnostic PCR using primer set BS_amyE_F and BS_amyE_R (Table S3). The transformant with correct single insertion at amyE locus should amplify a much larger fragment (~10 kb) in comparison to that of the host strain without an insertion (Figure S1). For transformation of bgc41 and bgc43, the procedures are similar to those described above. 3. Assembling bgc33 and bgc86 with pET28a vector and HE in E. coli BAP1: The coding sequence (CDS) of the bgc33 and bgc86 NRPS biosynthetic genes were synthesized with BsaI flanking sites by GeneArt (Thermo Fisher Scientific) with E. coli codon
optimization using the GeneOptimizer algorithm. The synthesized gene was cloned by Golden Gate assembly into E. coli expression vector under T7 promoter control. In brief, PCR fragment of expression vector pET28a (Novagen) was generated with Q5 High-Fidelity DNA Polymerase (New England Biolabs) following manufacturer protocol with primers pET28a-BsaI-F and pET28a-BsaI-R (Table S3). PCR fragment of pET28a was ligated to synthesized bgc33 or bgc86 construct in a 5 μl one-pot digestion/ligation reaction mix consisting of 10 fmol of bgc33 construct, 10 fmol of pET28a PCR product, 2.5 u of BsaI (New England Biolabs) and 2.5 u of T4 DNA ligase HC (Promega). Reaction conditions: 1 cycle of 37 °C for 5 hr; 10 cycles of 37 °C for 2 min, 16 °C for 5 min; 1 cycle of 50 °C for 15 min; 1 cycle of 80 °C for 15 min; 4 °C hold. The re sulting construct bgc33-pET28a was verified by complete plasmid sequencing service (Massachusetts General Hospital DNA core facility). bgc33-pET28a and bgc86-pET28a were transformed into E. coli BAP1 containing T7 DNA polymerase and sfp phosphopantetheinyl transferase.
4. Assembly bgc35 point mutation and NRPS truncation vector with pGFPuv vector: The point mutation mutants of the first adenylation domain (A1) and the second
adenylation domain (A2) of the bgc35 NRPS was generated using the Q5 Site-Directed
Mutagenesis Kit (NEB). The primers used in this experiment (Table S3) was designed using NEBaseChanger (NEB). The vectors were verified by sequencing and transformed into E. coli DH10β cells.
Detailed procedure for Fermentation, LCMS, HRMS and HRMS-MS fragmentation analyses
1. Bacterial strain fermentation and LCMS sample preparation: A single colony of each mutant strain was used to inoculate a 5 mL LB broth culture (10 g tryptone, 5 g yeast
A
uthor Man
uscr
ipt
A
uthor Man
uscr
ipt
A
uthor Man
uscr
ipt
A
uthor Man
uscr
ipt
extract, 10 g NaCl, 100 μg/mL of the corresponding antibiotic), which was incubated at 30 °C with shaking at 225 rpm. After 48 hr, the culture supernatant was extracted with 5 ml ethyl acetate (EA). The EA layer was evaporated in vacuo and re-dissolved in 200 μL of 20% DMSO/MeOH, 10 μL of which was examined by LC–MS analysis. For HR-ESI-MS analysis of bgc35, bgc38, and bgc52, the DMSO/MeOH extract was diluted to ~1 ng/μL, 10 μL of which was used for an MS-MS fragmentation analysis (Thermo Orbitrap Velos). 2. LCMS analysis using an Agilent 6120 quadrupole mass spectrometer: Solvent system: A: 100 % H2O with 0.1 % formic acid; B: MeCN with 0.1 % formic acid. For ethyl
acetate (EA) extraction of bacterial culture, as described in the manuscript, the gradient for HPLC-MS analysis is 0–5 min 100 % A, 5–35 min 100-0 % A, 35–37 min 0 % A, 37–39 min 0–100 % A, 39–41 min 100 % A at a flow rate of 0.4 ml/min. For analysis of the purified Boc-protected aldehydes and estimation of the stability of those deprotected peptidyl aldehydes, the gradient is 0–8 min 95-5 % A, 8–10 min 5 % A at a flow rate of 1.0 ml/min using a Cadenza CD-C18 column (75 × 4.6 mm, 3 μm).
3. HRMS and HRMS-MS analyses: The analysis of pathway dependent molecules from bgc33, bgc35, bgc38, bgc52, and bgc86 was performed on an Agilent 6530 Q-TOF LC/MS equipment and a C18 column. The HPLC gradient for bgc35, bgc38, and bgc52 is 0–1 min 99.9 % A, 1–7 min 99.9-50 % A, 7–11 min 50-15 % A, 11–13 min 15-0.1 % A, 13–25 min 0.1 % A, 25–25.5 min 0.1–99.9 % A, 25.5–28 min 99.9% A at a flow rate of 0.4 ml/min. The gradient for bgc33 and bgc86 is 0–1 min 90% A; 1–12 min 90-0% A; 12–14 min 100% B at a flow rate of 0.3 mL/min. The column was a Phenomenex Kinetex EVO C18 (2.6 um, 100 × 2.1 mm). (Solvent A: 100 % H2O with 0.1 % formic acid; B: MeCN with 0.1 %
formic acid)
The HRMS-MS fragmentation analysis for pathway dependent molecules was performed on a Thermo Q-exactive Orbitrap Velos MS equipped with a nanospray ESI source using the following gradient: 0–5 min 100 % A, 5–35 min 100-0 % A, 35–37 min 0 % A, 37–39 min 0–100 % A, 39–41 min 100 % A. Pathway dependent molecules were analyzed in auto MS/MS mode with a collision energy of 35 eV.
The HRMS and HRMS-MS analyses for examining the deprotection reaction of boc-protected peptidyl aldehydes were carried out on an Agilent 6530 Accurate-Mass Q-TOF LC/MS. We used the following gradient: 0–8 min 95-5 % A, 8–10 min 5 % A at a flow rate of 0.4 ml/min using a C18 column (Agilent Zorbax SB-C18 3.0 mm by 100 mm, 1.8-Micron, 600 Bar). The MS-MS analysis was performed in auto MS-MS mode with a collision energy of 20 eV.
Isolation and Characterization of Secondary Metabolites—For structure
elucidation, each mutant strain was cultivated in 4 × 1 L LB medium (with the exception of bgc33, which was cultivated on 16 L scale) containing 100 μg/mL of the corresponding antibiotic and incubated at 30 °C (25 °C for bgc33) with shaking at 225 rpm. After 48 hr (28 hr for bgc33), the culture supernatant was extracted 2x with an equal volume of EA, and the solvent was removed from the combined extracts by rotary evaporation. The dried material was dissolved in 80% MeOH/DMSO and separated by reverse-phase HPLC (Agilent 1200
A
uthor Man
uscr
ipt
A
uthor Man
uscr
ipt
A
uthor Man
uscr
ipt
A
uthor Man
uscr
ipt
series) for small molecule purification. NMR spectra were collected on either a Bruker Avance DRX500 or a Bruker AvanceIII 600-I spectrometer. Purification of EA fraction was carried on by gradient HPLC on a C18 reverse phase column (Phenomenex Luna 5 μm C18 (2), 250 × 10 mm) with a flow rate of 5.0 ml/min. The gradient system was MeCN (solvent B) and H2O (solvent A).
1. Purification of compounds 1-5 from bgc35: Compounds 1 to 5 were identified in the metabolite profiles of the E. coli mutant strains heterologously expressing bgc35. The gradient condition for semi-preparative HPLC separation of the crude of the bgc35 heterologous expressing strain was 0–5 min 100 % A, 5–29 min 100-20 % A, 29–30 min 20-0 % A, 30–31 min 0–100 % A, 31–32 min 100 % A. Compound 3 (1.68 mg/L of culture) was eluted at 20.11 min. Compounds 1 (0.45 mg/L of culture) and 2 (1.20 mg/L of culture) are in a mixed fraction which was further purified using gradient 0–2 min 100 % A, 2–3 min 100-67 % A, 3–21 min 67 % A, 21–22 min 67-0 % A, 22–23 min 0 % A, 23–24 min 100 % A. Compounds 4 and 5 were eluted at 14.0 and 15.7 min, respectively. Compounds 4 and 5 are mixed and the gradient for further purification is 0–2 min 100% A, 2–3 min 100-62.5 % A, 3–20 min 62.5 % A, 20–21 min 62.5-0 % A, 21–22 min 0–100 % A. Compounds 4 (2.05 mg/L of culture) and 5 (2.78 mg/L of culture) were eluted at 18.09 and 19.59 min,
respectively.
2. Purification of compounds 6-13 from bgc52: The gradient for purifying compounds from bgc52 was the same as that was used for bgc35. Compound 6 (1.00 mg/L of culture) was eluted at 18.71 min. Compound 7 (3.13 mg/L of culture) was eluted at 19.59 min. Compound 8 (1.64 mg/L of culture) was eluted at 20.11 min. Compound 13 was eluted at 23.60 min. Compounds 9 and 10 were eluted in the same fraction which was further purified using gradient 0–3 min 100 % A, 3–5 min 100-44 % A, 5–10 min 44–43 % A, 10–11 min 0 % A, 11–12 min 0–100 % A, 12–13 min 100 % A. The same gradient was used to purify fraction containing compounds 11 and 12. The four compounds [9 (1.13 mg/L of culture), 10 (1.19 mg/L of culture), 11 (1.12 mg/L of culture), 12 (1.25 mg/L of culture)] were eluted at 8.90, 9.12, 9.35, 9.70 min, respectively.
3. Purification of compound 14 from bgc38: The gradient purifying the crude from the mutant strains carrying bgc38 is 0–5 min 100 % A, 5–23 min 100–40 % A, 23–24 min 40-0 % A, 24–25 min 0–100 % A, 25–26 min 100 % A. Compound 14 (1.23 mg/L of culture) was eluted at 20.10 min.
4. Purification of compounds 15 and 16 from bgc33: Sixteen L of bgc33 were extracted with EA and dried by rotary evaporation. The EA extract was purified by reversed-phase preparative HPLC using a gradient of 10% acetonitrile/90% H2O containing 0.1% acetic
acid to 100% acetonitrile in 24 minutes (10 mL/min). Fractions containing 15 and 16 were purified by reversed-phase HPLC (Phenomenex Luna C18, 250 × 10 mm, 5 μm) using a gradient of 10% methanol/90 % H2O containing 0.1% acetic acid to 40%/60% in 3 minutes,
followed by a gradient to 100% methanol in 22 minutes. Fractions containing 15 and 16 were subjected to additional reversed-phase HPLC (Phenomenex Kinetex Biphenyl C18, 250 × 10 mm, 5 μm) using a gradient of 10% acetonitrile/90% H2O containing 0.1% acetic
A
uthor Man
uscr
ipt
A
uthor Man
uscr
ipt
A
uthor Man
uscr
ipt
A
uthor Man
uscr
ipt
acid to 70%/30% in 25 minutes, followed by 100% acetonitrile in 1 minute, yielding 15 (RT 18.5 min, 0.09 mg/L of culture) and 16 (RT 22.6 min, 0.31 mg/L of culture).
Detailed procedure for Biochemical Reconstitution of bgc35
1. Cloning of bgc35 NRPS into pET28a: Clostridium sp. KLE1755 was grown in an anaerobic chamber at 37 °C in Brain Heart Infusion agar with 0.1 % cysteine, 0.5 % yeast extract, and 15 mg/L hemin, pH 7.0. Genomic DNA was extracted from the bacteria using ZR bacterial DNA miniprep kit (Zymo). C.sp_KLE_NRPS1_pET28_fwd and rev primers were used to amplify the NRPS gene from genomic DNA and pET28_SalI_fwd and pET28_NdeI_rev were used to amplify the vector. (Table S3) The gene was assembled into pET28a with an N-terminus His tag using Circular Polymerase Extension Cloning (CPEC) and transformed into E. coli BL21.(Quan and Tian, 2009)
2. Purification of bgc35 NRPS: E. coli BL21 harboring bgc35 NRPS in pET28a was grown in 20 mL of LB + 50 μg/mL Kanamycin at 30 °C overnight and diluted to fresh 1L of LB + 50 μg/mL Kanamycin the next morning until early log phase (OD 600 ~0.4). The diluted culture was moved to 16 °C incubator and shaken overnight without IPTG induction. The next day, cells were pelleted at 6000 g for 10 minutes, and resuspended in Lysis Buffer (300 mM NaCl, 10 mM Imidazole, 50 mM NaH2PO4, pH 8.0) with EDTA-free Protease
Inhibitors (Roche). Cells were lysed using the EmulsiFlex (~10 minutes continuous flow, ~15,000 psi). Lysed cells were centrifuged at 16,000 rpm for 20 minutes. The supernatant was added to pre-equilibrated Ni-NTA beads (Qiagen) and rocked on the Nutator at 4°C for 1 hour. The beads were spun down at 1000 rpm for 3 minutes. 20 mL of Wash Buffer (300 mM NaCl, 20 mM Imidazole, 100 mM NaH2PO4) was added and the mixture was transferred to an equilibrated column. Three 20mL washes were performed and finally eluted in 4mL of Elution Buffer (300 mM NaCl, 250 mM Imidazole, 50 mM NaH2PO4). The eluted protein was dialyzed using a Dialysis Cassette (20K MWCO, Pierce) against a Dialysis Buffer (25 mM Tris pH 8.0, 50 mM NaCl, 1 mM DTT, 10 % (v/v) glycerol). When we performed SDS-PAGE on the eluent, we noticed that along with the expected full size band at 280 kDa, there were other lower bands present. We performed a western blot with anti-His antibody and found that these lower bands also bound to anti-His antibody, suggesting they were degradation products of the full length bgc35 NRPS. In order to verify that the full length NRPS was present in the eluent, we cut out the highest band that ran above the 212 kDa ladder in the SDS-PAGE gel and submitted it for MS analysis. The MS results showed a tryptic peptide that matched the N-terminus beginning and the C-terminus end of the amino acid sequence of the NRPS. Therefore we concluded that the full length NRPS is present in the eluent, and proceeded with the in vitro reconstitution using this full length and degraded NRPS mixture.
3. In vitro reconstitution of bgc35: The activity of bgc35 NRPS was assayed by comparing the LC-MS profiles of the reaction with and without the biosynthetic enzymes. The in vitro reconstitution reaction was set up as follows: 75 mM Tris-HCl pH 8.0, 10 mM MgCl2, 0.1
mM CoA, 1 mM Amino Acid Mixture (or 1mM aromatic amino acids only), 1 mM
NADPH, 10 μM NRPS enzyme, 0.1μM sfp and 5 mM ATP in a total volume of 200 μL. The
A
uthor Man
uscr
ipt
A
uthor Man
uscr
ipt
A
uthor Man
uscr
ipt
A
uthor Man
uscr
ipt
entire reaction excluding ATP was incubated at 37°C for 30 minutes before adding the ATP. After addition of ATP, the reaction was incubated at 37°C overnight. The next day, the reaction was quenched by addition 200 μL EA and mixing vigorously on the vortex. The mixture was spun at 10,000 × g for 5 minutes, and the top layer (EA) was collected and removed by rotary evaporation. The dried crude was resuspended in 40 μL of 20% DMSO in 80% MeOH and spun at 21,000 g for 10 minutes on the microcentrifuge. A 10 μL aliquot was examined by LC-MS using the same conditions used for analyzing the metabolite profile of the E. coli strain expressing bgc35.
Identification of compounds from the native organism harboring the gene cluster—Glycerol stocks containing Clostridium sp. KLE1755 and Ruminococcus sp. 5_1_39BFAA were streaked on pre-reduced EG blood agar plates (Recipe for 1L: 2.8 g Lab Lemco Powder, 10 g Protease Peptone No. 3, 5 g Yeast Extract, 4 g Na2HPO4, 1.5 g
D(+)-Glucose, 0.5 g Soluble Starch, 0.2 g L-cystine, 0.5 g L-cysteine•HCl•H2O, 0.5 g Tween 80,
16 g Bacto Agar, 5% Horse Blood, pH 7.6–7.8) and grown for 2 days at 37°C in an
anaerobic chamber. After 2 days, the resulting colonies were inoculated into 6 mL of twelve different pre-reduced liquid media (Anaerobic Basal Broth, BHI Broth, Casman Broth Base, Columbia Broth, Cooked Meat Medium, M17 Broth, Marine Broth, Nutrient Basal Broth, Reinforced Clostridium Media, Tryptic Soy Broth, TYG broth, Wilkins Chalgren Anaerobic Base Broth) and incubated for another 2 days at 37°C anaerobically. Media without the reducing agent L-cysteine in the ingredients were supplemented with L-cysteine for a final concentration of 0.05% (w/v). After another 2 days, some of the liquid cultures showed turbidity (not all media resulted in growth): Clostridium sp. KLE1755 grew in TYG, TSB, RCM and M17. Ruminococcus sp. 5_1_39BFAA grew in RCM, TYG, ABB, Columbia, M17, WCABB, Casman and TSB. Cultures in which the bacterial species grew were centrifuged at 3200 g for 5 minutes, and 5 ml of the supernatant was extracted with 5 ml of EA. This mixture was spun down for 10 minutes at 3200 g. The top layer was transferred to 5 ml glass vials and solvent was removed by rotary evaporation. The crude was resuspended in 100 μL 20% DMSO in MeOH. The resuspended extract was centrifuged at 21,000 g for 10 minutes on the microcentrifuge and a 10 μL portion of the supernatant was injected for LC-MS analysis.
Analysis of Metatranscriptomic Data—We recruited reads from publicly available RNA sequencing (RNA-seq) data sets from the stool samples of eight healthy subjects (Franzosa et al., 2014). Illumina reads from several runs on each sample were combined, and used to construct a BLAST database that was then searched using the 47 full-length gut NRPS BGCs as query sequences. For this search, we used BLASTn using the default parameters to identify all reads recruited to the BGCs, then used the following parameters to map them back to individual BGCs (minimum number of reads: 100, minimum overlap: 50 bp, minimum percent identity at overlap: 90%, and maximum percentage of mismatch per read: 20%), and finally displayed them using Geneious. The BGCs identified were bgc41, bgc44, bgc45/48/71, and bgc52/53/73 (the latter two sets are too similar in amino acid sequence to be differentiated in this analysis).
A
uthor Man
uscr
ipt
A
uthor Man
uscr
ipt
A
uthor Man
uscr
ipt
A
uthor Man
uscr
ipt
Synthesis, deprotection of Boc-Val-Phe-H, Boc-Leu-Phe-H, and Boc-Phe-Phe-H and stability measurement of their deprotected peptide aldehydes
1. Synthesis of Boc-Val-Phe-H, Boc-Leu-Phe-H, and Boc-Phe-Phe-H: Boc-Val-OH (286.7 mg, 1.32 mmol, 1.0 equiv.) and 2-amino-3-phenyl-1-propanol (200 mg, 1.32 mmol, 1.0 equiv.) were dissolved in DMF (10 mL) and then EtN(iPr)2 (0.5 ml, 2.9 mmol, 2.2
equiv.) and HATU (500 mg, 1.32 mmol, 1 equiv.) were added. The reaction was stirred for 2 hours at room temperature. 50 ml ddH2O was added to quench the reaction and the mixture
was extracted with equal amount of EA, twice. The EA layer was washed by brine, dried by adding anhydrous Na2SO4, followed by concentration using rotary evaporation. The crude
was purified by flash column chromatography on silica gel to give Boc-Val-Phe-OH (256.5 mg). Boc-Val-Phe-OH (99 mg, 0.28 mmol, 1.0 equiv.) was dissolved in DMF (2 ml) and Dess-Martin periodinane (360 mg, 0.85 mmol, 3.0 equiv.) was added. The reaction was stirred for 3 hours at room temperature. 50 ml water was added to quench the reaction and the mixture was extracted with equal volume of EA twice. The EA layer was washed by brine and dried by anhydrous Na2SO4. The concentrated EA crude was further purified by
HPLC using Phenomenex Luna C18 (250 × 10 mm, 5 μm). The HPLC gradient for purification is 0–3 min 80 % A, 3–10 min 80-5 % A, 10–13 min 5–80 % A at a flow rate of 5ml/min (Solvent A: H2O; Solvent B: MeCN). Fractions were collected in a time-based
manner and individual fraction was examined by LCMS. Fractions containing targeted aldehyde compounds were collected and concentrated via freeze-drying to yield Boc-Val-Phe-H (white powder, 21.0 mg). The aforementioned procedure was applied to synthesize and purify Boc-Leu-Phe-H and Boc-Phe-Phe-H. Boc-Leu-OH (305.3 mg, 1.32 mmol, 1.0 equiv.) was used as a starting material to give 267.1 mg Boc-Leu-Phe-OH. Then 100 mg of Boc-Leu-Phe-OH was oxidized to give Boc-Leu-Phe-H (white powder, 75.3 mg). For the synthesis of Boc-Phe-Phe-H, Boc-Phe-OH (350.2 mg, 1.32 mmol, 1.0 equiv.) was used as a starting material and 197.9 mg of OH was obtained. 100 mg of Boc-Phe-Phe-OH was then oxidized to give Boc-Phe-Phe-H (white powder, 66.5 mg).
2. Deprotection of Boc-protected dipeptide aldehyde compounds: All the deprotection experiments were performed in an anaerobic chamber. Trifluoroacetic acid (TFA) was reduced and added to the purified Boc-protected dipeptidyl aldehydes. 1 μL of the reaction was added to 100 μL 80% DMSO in ddH2O and a 0.5 μL portion of the solution was
examined by an Agilent 6530 qTOF LC/MS. For preparing dipeptide aldehyde solution for protease inhibition assays, the deprotection reaction was left at 30 °C for 15 mins. Then ddH2O was added to quench the reaction and give a 2.5 mM peptidyl aldehydes in 1% TFA
solution. Some side products like isobutylene and their corresponding imine and pyrazinone products have poor water solubility. The imine and pyrazinone compounds will precipitate in the solution. The reaction was centrifuged for 5 min at 16,000 g and the supernatant was given for protease assay immediately. Water containing only 1% TFA was also tested for protease inhibition activity as a negative control.
3. HRMS analyses of peptidyl aldehydes after deprotection (Figure S5)
1. Val-Phe-H (aldehyde): HRMS [M + H]+ m/z found 249.1609, calcd for C14H21N2O2 249.1603; Val-Phe-DHPZN (imine): HRMS [M + H]+ m/z found
A
uthor Man
uscr
ipt
A
uthor Man
uscr
ipt
A
uthor Man
uscr
ipt
A
uthor Man
uscr
ipt
231.1491, calcd for C14H19N2O 231.1497; Val-Phe-PZN (pyrazinone, compound
10): HRMS [M + H]+ m/z found 229.1348, calcd for C14H17N2O 229.1341.
2. Leu-Phe-H: HRMS [M + H]+ m/z found 263.1787, calcd for C15H23N2O2
263.1760; Leu-Phe-DHPZN (imine): HRMS [M + H]+ m/z found 245.1679, calcd for C15H21N2O 245.1654; Leu-Phe-PZN (compound 12): HRMS [M + H]+
m/z found 243.1518, calcd for C15H19N2O 243.1497.
3. Phe-Phe-H: HRMS [M + H]+ m/z found 297.1600, calcd for C18H21N2O2
297.1603; Phe-Phe-DHPZN (imine): HRMS [M + H]+ m/z found 279.1498, calcd for C18H19N2O 279.1497; Phe-Phe-PZN (compound 5): HRMS [M + H]+
m/z found 277.1348, calcd for C18H17N2O 277.1341.
The structures of peptide aldehydes after deprotection were verified by HRMS and HRMS-MS analyses. These compounds will fragment in a characterized manner as shown in Figure S5.
4. Estimation of the stability (half-life) of deprotected peptide aldehyde
compounds: 50% aqueous DMSO (for dissolving pyrazinone compounds with poor water solubility) in 50 mM potassium phosphate buffer (pH 7.2) was prepared. 1% of the reaction solution (in TFA) was added to the prepared buffer to yield a 1% TFA solution (pH 7.0). At different time points, 20 μL of the mixed solution was injected into LCMS using the method as aforementioned. The amount of pyrazinone type compounds was measured by EIC as shown in Figure S5.
Protease Inhibition Assays—For protease inhibition assays, all fluorescence measurements were made on a Biotek H4 instrument. Buffering reagents were purchased from Sigma-Aldrich and sterile-filtered prior to use. Compounds and substrates were diluted from DMSO stocks into water/DMSO such that final DMSO plate concentrations were below 5% during the reaction. All reactions were started by the addition of substrate to the enzyme/compound solutions.
Enzymes: cathepsin L, cathepsin B, cathepsin C and cathepsin S were purchased from R&D Systems. trypsin, chymotrypsin and calpain I were purchased from Sigma-Aldrich. Calpain I was also purchased from Abcam. Human 20s proteasome was purchased from Boston Biochem.
Substrates: z-FR-AMC, Boc-IEGR-AMC, Suc-ALPF-AMC and GR-AMC were purchased from Bachem. Suc-LLVY-AMC was purchased from Anaspec. Substrates were used without further purification.
Inhibitors: Carfilzomib was a generous gift from Onyx Pharmaceuticals and was used as a positive control in the proteasome inhibition assay. Pefabloc was purchased from Sigma-Aldrich and used as a positive control in the inhibition assays of trypsin and chymotrypsin. Leupeptin and Chymostatin were purchased from Research Products International.
Leupeptin was used as a positive control in the inhibition assays of cathepsin B, cathepsin L, cathepsin S, and human calpain I. Chymostatin, as a positive control, was used in the inhibition assay of cathepsin C.
A
uthor Man
uscr
ipt
A
uthor Man
uscr
ipt
A
uthor Man
uscr
ipt
A
uthor Man
uscr
ipt
Enzyme assays: cathepsin L (0.02 μg/ml) and cathepsin B (0.2 μg/ml) were assayed in 50 mM MES buffer (pH 5.5) containing 5 mM DTT, using z-FR-AMC at 20 μM.
Trypsin (3 μg/ml) was assayed in 40 mM Tris (pH 7.8), 0.01 M CaCl2 using
Boc-IEGR-AMC (10 μM). Chymotrypsin (30 ng/μl) was assayed in 40 mM Tris (pH 7.8), 0.1 M CaCl2
with Suc-ALPF-AMC (10 μM). Human 20S proteasome was pre-activated for 1 hr in 20 mM Tris (pH 8.0), 0.5 mM EDTA, and 0.03% SDS at 10 nM prior to dilution to 1 nM for assays with Suc-LLVY-AMC (10 μM).
Calpain I (10 μg/ml) was assayed in 20 mM Imidazole (pH 7.5), 5 mM DTT, 5 mM CaCl2
with Suc-LLVY-AMC (10 μM). Cathepsin S was pre-activated for two hours at 10 μg/ml in 50 mM MES buffer (pH 5.5), 5 mM DTT, and then diluted to 100 ng/ml for assays with z-FR-AMC (10 μM). Cathepsin C/DPPI (200 μg/ml) was incubated with cathepsin L (20 μg/ml) in 25 mM MES (pH 5.5) 5 mM DTT for 1 hour prior to dilution to 0.25 ng/μl in 25 mM MES (pH 5.5), 5 mM DTT, 50 mM NaCl for assays with GR-AMC (10 μM). Normalized enzyme activity data were fit using GraphPad Prism version 5.0 for Windows.
Target Identification by chemical proteomics—THP-1 cells (TIB-202™), Ramos cells (CRL1596™) and H1975 cells (CRL5908™), obtained from ATCC, were grown at 37 °C with 5% CO2 and maintained at a low passage number (<10 passages). THP1 and
Ramos cells were cultured in RPMI medium supplemented with 10% fetal bovine serum, penicillin, streptomycin and glutamine. THP-1 cells were further supplemented with 50 μM
βME. H1975 cells were cultured in DMEM medium supplemented with 20% fetal bovine
serum, penicillin, streptomycin and glutamine. To induce differentiation of THP-1 cells, cells were treated with phorbol 12-myristate 13-acetate (PMA, final concentration = 200 nM) for 18 hours at which point the media was replaced and cells were allowed to proliferate for 3 additional days. Cells were harvested by centrifugation (1,400 g, 3 min, 4 °C), pellets washed with cold PBS, lysed by sonication and fractionated (100,000 g, 45 min) to yield soluble and membrane fractions, which were then adjusted to a final protein concentration of 1.5 mg/mL for proteomics experiments. pH 5 and pH 5.5 samples were lysed into sodium acetate buffer adjusted to the indicated pH. Protein concentration was determined using the Bio-Rad DC™ protein assay kit. 500 μL of the indicated proteome was treated with bgc35 Phe-Phe-H (5 μL of 2.5 mM aqueous solution containing 1% TFA, final concentration = 25 μM) or with vehicle (5 μL aqueous containing 1% TFA). For 2.5 μM and 250 nM concentration treatments, samples were treated with 5 μL of 100 × compound stock solutions diluted from the parent stock solution into water. Samples were incubated for 30 min following which treated and control samples were further labeled for an additional 30 min with iodoacetamide-alkyne (IA-alkyne, 5 μL of 10 mM stock in DMSO, final
concentration = 100 μM). All labeling steps were conducted at ambient temperature. Control and treated samples were then subjected to copper-mediated azide-alkyne cycloaddition (CuAAC) conjugation to isotopically labeled, TEV-cleavable biotinylated peptide tags, control and treated samples combined, enriched on streptavidin resin (Pierce 20349) and subjected to sequential trypsin and TEV digests as has been reported previously (Backus et al., 2016). TEV digests were analyzed by multidimensional liquid chromatography tandem mass spectrometry (MudPIT), using an LTQ-Velos Orbitrap mass spectrometer (Thermo
A
uthor Man
uscr
ipt
A
uthor Man
uscr
ipt
A
uthor Man
uscr
ipt
A
uthor Man
uscr
ipt
Scientific) coupled to an Agilent 1200- series quaternary pump and searched and analyzed as has been reported previously (Backus et al., 2016).
Detailed structural characterization of purified compounds isolated in this study—Compounds identified in this study can be grouped into three classes:
dihydropyrazinones (compounds 1 and 2, for example), pyrazinones (compounds 3-15), and N-acyl peptide aldehydes (compound 16) (Figure 2). Their biosynthetic origin, from a group of NRPSs which take amino acids as substrates, facilitates the structural elucidation process. For dihyropyrazinones, compound 1 was purified as an amorphous yellowish solid and its molecular formula was determined to be C20H19N3O by its HRMS spectral data, suggesting
thirteen indices of hydrogen deficiency (IHD). This compound and compound 2 are slowly degrading upon isolation. The 1H, 13C, gHMQC, and gHMBC NMR spectroscopic data of compound 1 (Data File S1 Table a) including the six phenyl carbons [δC 138.3 (C-4), δC 128.6 (C-5 and C-9), δC 129.4 (C-6 and C-8), the five aromatic protons [H-5 and H-9, δH 7.38 (2H, d, J = 12.0 Hz); H-6 and H-8, δH 7.29 (2H, m); H-7, δH 7.28 (1H, m)], the CH2-3
methylene group [δH 3.16 (1H, d, J = 12.0 Hz), δH 3.03 (1H, d, J = 12.0 Hz), and δC 40.6] exhibit a typical phenylalanine side chain. A tryptophan side chain was also established from the 1H, 13C, gHMQC, and gHMBC NMR spectroscopic data. The 13C spectrum exhibits eight aromatic carbons (C-4′ to C-11′). The 1H spectrum shows four aromatic protons exhibiting a typical coupling pattern of an indole ring (H-7′ to H-10′). The gHMBC correlations between the indole 5′-NH [δH 10.73 (1H, s)] and four aromatic carbons (C-4′, 5′, 6′, and 11′) and the gHMBC correlations between the CH2-3′ methylene group [δH
2.88 (1H, dd, J = 12.0, 6.0 Hz), δH 2.77 (1H, d, J = 12.0 Hz), and δC 26.4] and C-4′ and 11′ further suggests that compound 1 contains a tryptophan side chain moiety. The phenylalanine and tryptophan side chains, in combined, contributed 10 IHDs. The
dihyropyrazinone core (and how these two side chains are connected to the core) was set up based on the following evidence: 1. The gHMBC correlations between the H2-3′ and C-2′
(δC 53.1) and one amide carbon C-1′ (δC 171.5); 2. The gHMBC correlations between H2-3 and C-2 (δC 58.6); 3. The gCOSY correlations between one imine proton H-1 (δH
7.44, m) and H-2 (δH 3.53, m). Thus, the structure of compound 1 was assigned as shown in Figure 2 and we named it DHPZN1.
For compounds within the pyrazinone class, the verification of amino acid side chains are comparable to that of compound 1. Taking compound 7 (Data File S1 Table g) as an example, its molecular formula was determined to be C15H18N2O2 by its HRMS spectral
data, suggesting eight indices of hydrogen deficiency (IHD). The tyrosine side chain takes up four IHDs. The pyrazinone core (and how tyrosine and leucine side chains are connected to the core) was set up based on the following evidence: 1. Comparison to the published literature (MacDonald et al., 1976; Zimmermann and Fischbach, 2010); 2. The gHMBC correlations between the H2-3′ [δH 2.60 (2H, d, J = 10.0 Hz)] and C-2′ (δC 156.6) and one
amide carbon C-1′ (δC 157.3); 3. The gHMBC correlations between H2-3 [δH 3.76 (2H, s)]
and C-2 (δC 139.3) and C-1 (δC 121.6). Thus, the structure of compound 7 was assigned as shown in Figure 2 and we named it PZN5.
A
uthor Man
uscr
ipt
A
uthor Man
uscr
ipt
A
uthor Man
uscr
ipt
A
uthor Man
uscr
ipt
Both adenylation domains participate in generating sidechain chemical diversity—Given that pyrazinones appear to be the native products of bgc35 and bgc52, we next turned to the question of how a three-module NRPS gives rise to a diverse family of dimeric nonribosomal peptides. To address this question, we individually mutagenized the first and second adenylation domains (A1 and A2) from the NRPS in bgc35, expressed the
mutagenized protein in E. coli, and profiled its culture extract by LC-MS (Figure S7). To our surprise, both individual mutants retained the production of a subset of the bgc35 products. Reasoning that the residual activity could be due to A domain mutations that did not eliminate amino acid substrate binding, we constructed and profiled an A1-A2 double
mutant. LC-MS analysis of its culture extract revealed that activity had been completely abolished, indicating that each single domain mutant had effectively eliminated substrate binding. Collectively, these data suggest that each module in the NRPS is capable of acting iteratively. Consistent with this view, a truncated form of the bgc35 NRPS consisting of only the second module (C2-A2-T2-R) is capable of synthesizing a subset of the pyrazinone and
pyrazine products observed from bgc35 (Figure S7 and Table S4). These data suggest that both modules of the bgc35 NRPS contribute to the diversity in product structure. Moreover, the observation that the product spectrum of the single A domain mutants is skewed toward pyrazines is consistent with the possibility that in iterative format, the terminal reductase favors the release of individual α-aminoaldehyde monomers rather than a dipeptide aldehyde.
Supplementary Material
Refer to Web version on PubMed Central for supplementary material.
Acknowledgments
We are deeply grateful to Piro Siuti and Horst Hemmerle at Novartis for their many constructive discussions and support of this research program; to Emma Allen-Vercoe for sending us Lachnospiraceae sp. 3_1_57FAA and Ruminococcus sp. 5_1_39BFAA; to Kim Lewis and Phil Strandwitz for providing us with Clostridium sp. KLE 1755; to Jeff Johnson and Nevan Krogan for help with MS/MS experiments; to Hiroki Shimizu and Adam Renslo for help with the chemical synthesis of peptide aldehydes; to three anonymous reviewers for constructive suggestions; and to members of the Fischbach Group for helpful comments. This work was supported by the BASF California Research Alliance (M.A.F.); NIH grants R01 DK101674 and R01 DK110174 (M.A.F.); R01 GM104659 (C.S.C.); a fellowship from the David and Lucile Packard Foundation (M.A.F.); a research award from Novartis (M.A.F., C.V., and J.C.); research awards (HR0011-12-C-0067, HR0011-13-1-001, and HR0011-15-C-0084) from U.S. Defense Advanced Research Projects Agency’s Living Foundries program (C.V. and M.A.F.); a Ruth L. Kirschstein National Research Service Award (NRSA) Individual Postdoctoral Fellowship 5F32GM111012-03 (T.M.A); and a Burroughs Welcome Fund Investigators in the Pathogenesis of Infectious Disease award (M.A.F.).
References
Adams J, Behnke M, Chen S, Cruickshank AA, Dick LR, Grenier L, Klunder JM, Ma YT, Plamondon L, Stein RL. Potent and selective inhibitors of the proteasome: Dipeptidyl boronic acids. Bioorganic & Medicinal Chemistry Letters. 1998; 8:333–338. [PubMed: 9871680]
Aoyagi T, Miyata S, Nanbo M, Kojima F, Matsuzaki M, Ishizuka M, Takeuchi T, Umezawa H. Biological activities of leupeptins. The Journal of Antibiotics. 1969a; 22:558–568. [PubMed: 4243683]
Aoyagi T, Takeuchi T, Matsuzaki A, Kawamura K, Kondo S, Hamada M, Maeda K, Umezawa H. Leupeptins, new protease inhibitors from actinomycetes. The Journal of Antibiotics. 1969b; 22:283–286. [PubMed: 5810993]