HAL Id: hal-00316959
https://hal.archives-ouvertes.fr/hal-00316959
Submitted on 1 Jan 2001
HAL is a multi-disciplinary open access
archive for the deposit and dissemination of
sci-entific research documents, whether they are
pub-lished or not. The documents may come from
teaching and research institutions in France or
abroad, or from public or private research centers.
L’archive ouverte pluridisciplinaire HAL, est
destinée au dépôt et à la diffusion de documents
scientifiques de niveau recherche, publiés ou non,
émanant des établissements d’enseignement et de
recherche français ou étrangers, des laboratoires
publics ou privés.
auroral activity in the dusk sector of the auroral oval
K. Kauristie, T. I. Pulkkinen, O. Amm, A. Viljanen, M. Syrjäsuo, P.
Janhunen, S. Massetti, S. Orsini, M. Candidi, J. Watermann, et al.
To cite this version:
K. Kauristie, T. I. Pulkkinen, O. Amm, A. Viljanen, M. Syrjäsuo, et al.. Ground-based and
satel-lite observations of high-latitude auroral activity in the dusk sector of the auroral oval. Annales
Geophysicae, European Geosciences Union, 2001, 19 (10/12), pp.1683-1696. �hal-00316959�
Annales
Geophysicae
Ground-based and satellite observations of high-latitude auroral
activity in the dusk sector of the auroral oval
K. Kauristie1, T. I. Pulkkinen1, O. Amm1, A. Viljanen1, M. Syrj¨asuo1, P. Janhunen1, S. Massetti2, S. Orsini2, M. Candidi2, J. Watermann3, E. Donovan4, P. Prikryl5, I. R. Mann6, P. Eglitis7, C. Smith8, W. F. Denig9, H. J. Opgenoorth1, 7, M. Lockwood10, M. Dunlop11, A. Vaivads7, and M. Andr´e7
1Finnish Meteorological Institute, Geophysical Research Division, P.O.Box 503, FIN-00101 Helsinki, Finland 2Consiglio Nazionale delle Ricerche, Istituto di Fisica dello Spazio Interplanetario, Rome, Italy
3Danish Meteorological Institute, Solar-Terrestrial Physics Division, Copenhagen, Denmark 4University of Calgary, Department of Physics and Astronomy, Alberta, Canada
5Communications Research Centre, Ottawa, Canada 6University of York, Department of Physics, UK
7Swedish Institute of Space Physics, Uppsala Division, Sweden 8Bartol Research Institute, Delaware, USA
9Air Force Research Laboratory, Hanscom Air Force Base, Massachusetts, USA 10Rutherford Appleton Laboratory, Didcot, UK
11Imperial College, London, UK
Received: 25 April 2001 – Revised: 21 June 2001 – Accepted: 23 June 2001
Abstract. On 7 December 2000, during 13:30–15:30 UT the MIRACLE all-sky camera at Ny ˚Alesund observed auro-ras at high-latitudes (MLAT ∼ 76) simultaneously when the Cluster spacecraft were skimming the magnetopause in the same MLT sector (at ∼ 16:00–18:00 MLT). The location of the auroras (near the ionospheric convection reversal bound-ary) and the clear correlation between their dynamics and IMF variations suggests their close relationship with R1 cur-rents. Consequently, we can assume that the Cluster space-craft were making observations in the magnetospheric region associated with the auroras, although exact magnetic conju-gacy between the ground-based and satellite observations did not exist. The solar wind variations appeared to control both the behaviour of the auroras and the magnetopause dynam-ics. Auroral structures were observed at Ny ˚Alesund espe-cially during periods of negative IMF BZ. In addition, the
Cluster spacecraft experienced periodic (T ∼ 4 − 6 min) en-counters between magnetospheric and magnetosheath plas-mas. These undulations of the boundary can be interpreted as a consequence of tailward propagating magnetopause sur-face waves. Simultaneous dusk sector ground-based observa-tions show weak, but discernible magnetic pulsaobserva-tions (Pc 5) and occasionally periodic variations (T ∼ 2 − 3 min) in the high-latitude auroras. In the dusk sector, Pc 5 activ-ity was stronger and had characteristics that were consistent with a field line resonance type of activity. When IMF BZ
stayed positive for a longer period, the auroras were dim-mer and the spacecraft stayed at the outer edge of the mag-netopause where they observed electromagnetic pulsations Correspondence to: K. Kauristie (kirsti.kauristie@fmi.fi)
with T ∼ 1 min. We find these observations interesting espe-cially from the viewpoint of previously presented studies re-lating poleward-moving high-latitude auroras with pulsation activity and MHD waves propagating at the magnetospheric boundary layers.
Key words. Ionosphere (ionosphere-magnetosphere inter-action) – Magnetospheric physics (auroral phenomena; solar wind – magnetosphere interactions)
1 Introduction
Auroral activity is frequently observed in the post-noon and dusk sectors of the auroral oval. All-sky cameras (ASC) at high-latitude stations observe multiple discrete auroral arcs with longitudinally propagating brightenings, folds, or spi-rals. These auroras can occasionally be bright but usually they are dimmer and more transient than for example, a growth phase aurora in the pre-midnight sector.
If the dusk component of the interplanetary magnetic field (IMF BY) is strongly positive, then the northern hemispheric
cusp region can shift from the noon to dusk sector as a consequence of the partial penetration of the IMF to the magnetospheric cavity (Cowley et al., 1991). Under IMF BY > 0 conditions, the region favouring reconnection of
the IMF and magnetospheric field lines at the dayside mag-netopause shifts duskwards (Luhmann et al., 1984). Con-sequently, reconnection-related auroras which typically ap-pear in the noon sector can be observed also in the afternoon and dusk sectors (Moen et al., 1999). One such example is
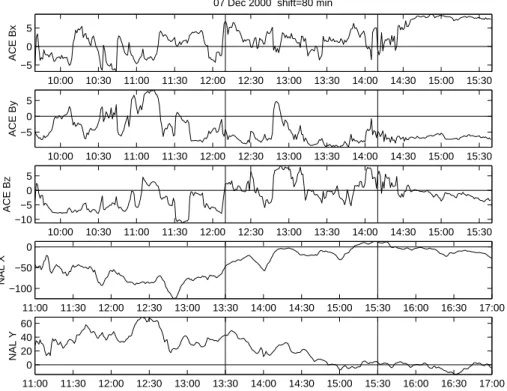
10:00 10:30 11:00 11:30 12:00 12:30 13:00 13:30 14:00 14:30 15:00 15:30 −5
0 5
ACE Bx
07 Dec 2000 shift=80 min
10:00 10:30 11:00 11:30 12:00 12:30 13:00 13:30 14:00 14:30 15:00 15:30 −5 0 5 ACE By 10:00 10:30 11:00 11:30 12:00 12:30 13:00 13:30 14:00 14:30 15:00 15:30 −10 −5 0 5 ACE Bz 11:00 11:30 12:00 12:30 13:00 13:30 14:00 14:30 15:00 15:30 16:00 16:30 17:00 −100 −50 0 NAL X 11:00 11:30 12:00 12:30 13:00 13:30 14:00 14:30 15:00 15:30 16:00 16:30 17:00 0 20 40 60 NAL Y
Fig. 1. IMF BX, BY, and BZ(GSE-coordinates) by the ACE satellite (three first panels) and magnetic field north and east components as
recorded at Ny ˚Alesund (NAL). The vertical lines show the period of auroral activity at NAL.
analysed in this issue by Opgenoorth et al. (2001). If the north component of the IMF (IMF BZ) is negative, then cusp
auroras are related to so-called flux transfer events (FTEs) with specific ground magnetic (McHenry and Clauer, 1987) and ionospheric plasma flow (Provan et al., 1998) signatures and velocity dispersed ion signatures in the low-altitude par-ticle precipitation data (Lockwood et al., 1996). The auro-ras appear typically at the poleward boundary of the auroral oval where they propagate poleward (and also westward if IMF BY > 0) into the polar cap. Auroral activity occurs
quasi-periodically with a recurrence rate of ∼ 3 − 15 min and the lifetimes of the auroral structures are of the order of 2 − 10 min (Sandholt et al., 1990).
If IMF BZ>0 and BY >0, then the most probable
merg-ing region at the dayside magnetopause is in the duskside, but at higher latitudes than in the case of IMF BZ <0 and
BY > 0 (Luhmann et al., 1984). When IMF BZ > 0, the
reconnection of the IMF and magnetospheric field lines pole-ward of the cusp may cause auroral activity in the polar cap region (Basinska et al., 1992).
Dusk sector auroral activity residing within the region of closed field lines cannot be directly related to dayside re-connection (Farrugia et al., 1994; Moen et al., 1994). At these latitudes, the plasma is convecting sunward and mul-tiple arcs or transient spirals are typically observed when the solar wind speed is high, the IMF has a relatively strong ra-dial component, and IMF BZis slightly positive. The auroras
have been associated with R1 current enhancements as they are located just equatorward of the ionospheric convection reversal boundary. Mapping with empirical magnetic field
models have shown that their source region near the mag-netic equator is 2 − 3 RE inward from the magnetopause.
Kelvin-Helmholtz waves developing at the inner edge of the low-latitude boundary layer (LLBL) is one of the most prob-able candidates to generate the auroras (Farrugia et al., 1994, 2000).
Auroral forms associated with magnetohydrodynamic wave activity can propagate polewards and anti-sunward and thus, greatly resemble FTE-type auroras (Milan et al., 1999). Nevertheless, the two-minute periodicity in the auroral emis-sion indicates instead a connection to the wave activity rather than to dayside reconnection. In the study of Milan et al. (1999), ground magnetometer observations show pulsation activity, that is consistent with field line resonance eigen-frequences and radar data shows that the wave activity also caused modulation of the ionospheric plasma drift velocity. The pulsating auroras at the open/closed field line bound-ary can be associated with modulations in the R1 current tensity. The boundary layer activity was coupled with in-ner magnetospheric processes as magnetic pulsations were recorded in an extended latitude range (MLATs 57–76).
Under suitable conditions, magnetopause surface waves triggered by solar wind pressure pulses can lead to magne-tosheath plasma penetration into the magnetosphere (Woch and Lundin, 1992). Penetration events are observed within sunward convecting plasma during similar solar wind con-ditions as dusk sector arcs. Their occurrence rate increases when IMF |BX|is large and with increasing solar wind
pres-sure. During dusk sector penetration events, IMF BY is
con-trol their occurrence significantly. Thus, these events could explain other than FTE-type auroras. However, the mag-netosheath plasma injections flow systematically tailward, while for the cases analysed in the literature, the east-west motion of the auroras has not shown any preferred direction (Farrugia et al., 1994).
The so-called travelling convection vortices (TCV) (Glass-meier et al., 1989) are preferentially observed in the dawn sector, but in some cases, they can also cause auroral activity in the postnoon and dusk sectors. TCVs can be associated with field-aligned current (FAC) systems propagating dawn-ward and duskdawn-ward away from noon. The FACs are conven-tionally assumed to have their source region at the magne-topause or in the LLBL, although recent studies (Yahnin and Moretto, 1996; Moretto and Yahnin, 1998) show that TCVs are typically observed in the region of central plasma sheet type precipitation. The current system includes both upward and downward directed currents which cause counterclock-wise and clockcounterclock-wise directed Hall-current loops at their iono-spheric footpoints (Glassmeier et al., 1989). As the current system propagates rapidly (a few km/s) anti-sunward, it is natural to assume that the related auroras also move in the same direction, although a case study by L¨uhr et al. (1996) comparing optical and magnetic observations show that au-roras appear only occasionally at the footpoint of the upward FAC.
The aim of this study is to examine, with the combination of ground-based and Cluster observations, the role of magne-topause waves in the generation of the non-FTE type of dusk sector auroras. After a brief description of the instrumen-tation (Sect. 2), we present a comparison study of ground-based, Cluster II, and ACE observations made on 7 Decem-ber 2000, during 13:30–15:30 UT (Sect. 3). Sections 4 and 5 summarize our findings with some discussion from the view-point of previous studies on dusk sector auroral activity.
2 Instrumentation
The Magnetometers – Ionospheric Radars – All-sky Cameras Large Experiment (MIRACLE) is a two-dimensional instru-ment network which consists of the IMAGE magnetometer network (L¨uhr et al., 1998), eight all-sky cameras and the STARE radar system (Syrj¨asuo et al., 1998). These instru-ments in the Scandinavian sector cover an area from subau-roral to polar cap latitudes over a longitude range of about two hours in local time. The sampling interval of the IM-AGE magnetometer recordings is 10 s. The digital all-sky cameras (ASC) have three filters at wavelengths 557.7 nm, 630.0 nm, and 427.8 nm. Auroral intensities are measured in analog-to-digital units (ADUs) varying from 0 to 255. In the standard mode the imaging interval is 20 s for 557.7 nm and 60 s for 630.0 nm and for 427.8 nm. The field-of-view (FOV) of an ASC is a circular area with a diameter of ∼ 600 km (at a 110 km altitude). The spatial resolution of an ASC im-age varies between less than a one km distance per pixel (near the zenith) to a few km per pixel (near horizon). In
13:00 14:00 15:00 16:00 −100 0 100 200 300 400 GIL GHB KIL dawn noon dusk (UT) H, auroral latitudes −100 −50 0 50 100 150 200 250 300 TAL THL NAL dawn noon dusk 07 Dec 2000: H, high-latitudes
Fig. 2. Magnetograms (magnetic north component) from stations of IMAGE (NAL and KIL), CANOPUS (TAL and GIL) and Green-land (GHB and THL) networks.
this study, we use images acquired by the ITACA camera (Orsini et al., 2000) operating in Ny ˚Alesund (78.92◦N and 11.93◦E), Svalbard.
The CUTLASS (Co-operative UK Twin Located Auroral Sounding System) radar system consists of two HF radars and it is part of the international chain of SuperDARN radars (Greenwald et al., 1995). The CUTLASS radars are located in Hankasalmi, Finland (26.61◦E, 62.32◦N) and Pykkvibaer, Iceland (20.54◦W, 63.77◦N). The system provides high time
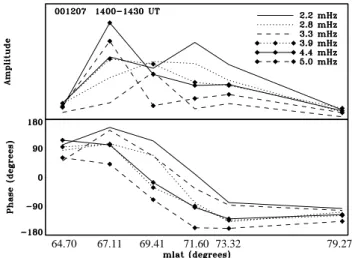
67.11
64.70 69.41 71.60 73.32 79.27
Fig. 3. Latitudinal variations of the Fourier amplitude and phases of the X-component along the CANOPUS Churchill line.
resolution measurements (120 s in routine operations) of the ionospheric flow vectors over an area of over 3 million km2, with a line-of-sight resolution of the order of 50 km. The radar FOV is above northern Scandinavia and the Arctic Sea, covering also the Svalbard archipelago.
The Defense Meteorological Satellite Program (DMSP) is a set of sun-synchronous satellites in polar circular orbits at the altitude of ∼ 835 km, and with an orbital period of ∼ 100 min. Each DMSP satellite is instrumented with a compliment of space environmental sensors. The DMSP au-roral particle sensor, SSJ/4, measures the energy distribution of precipitating electrons and ions within the loss cone over the energy range from 32 eV to 30 keV (Hardy et al., 1984). The DMSP ionospheric plasma sensor, SSIES, measures the properties of the ionosphere including the convective motion of the background ionosphere (Rich, 1994). For the period of interest here, data from the DMSP F13 spacecraft during an overflight of Ny ˚Alesund is applicable to the discussion.
The ACE/MAG instrument measures the interplanetary magnetic field (IMF) vector near the Sun-Earth line at the up-stream distance of ∼ 230 REfrom the Earth. The two
mag-netometers on ACE are wide-range tri-axial fluxgate magne-tometers with a sampling rate of 1/30 s. In this study, we use data which has been averaged over 16 s. ACE/SWEPAM monitors the electron and ion fluxes in the energy ranges of 1–1240 eV and 0.26–35 keV, respectively. Below, we use dy-namic pressure as determined from the ACE/SWEPAM pro-ton density and speed observations (64 s averaged values).
During December 2000 and January 2001, the Cluster II spacecraft were still in the commission phase but their orbital plane was in the dusk sector and thus, the instruments gath-ered interesting data from the viewpoint of this study. On 7 December 2000, tests of the possible interference effects between the different types of instruments were performed. First tests of almost all instruments in operation were made during the period of the magnetic conjuction with the Sval-bard region.
The Cluster Electric Field and Wave experiment (EFW) (Gustafsson et al., 1997) measures the electric field and the satellite potential with a high amplitude and time resolu-tion. The experiment has four probes on wire booms in the spin plane of each satellite, with a probe-to-spacecraft separation of 44 m. The experiment is well suited to study both the large-scale structures (inter-spacecraft comparisons) and micro-scale structures (inter-probe comparisons). In this study, we use data of the satellite potential sampled at 5 sam-ples/s. The satellite potential can be used to estimate the plasma density. Negative satellite potentials of −20, −10 and −5 V correspond to plasma densities of about 0.9, 2 and 10 cm−3(Pedersen et al., 2001).
The magnetic field instrument (FGM) (Balogh et al., 1997) on board each Cluster spacecraft consists of two tri-axial fluxgate magnetometers and a data processing unit. One of the magnetometers is located at the end of a 5.2 m long radial boom, and the other is at 1.5 m inboard from the end of the boom. Either of these sensors can be designed as the primary sensor which collects data with a higher time resolution than the other sensor. The instruments can measure the field with sampling rates of up to 67 vector/s. In this study, we use spin resolution (4 s) FGM measurements.
3 Observations on 7 December 2000
3.1 IMF, low-altitude satellite, and ground-based observa-tions
According to Wind observations (satellite location XGSE ∼ 40 RE, YGSE ∼ 170 RE, ZGSE ∼ 8 RE) during 5
to 8 December 2000 the solar wind density was higher than that measured, during average conditions. A front of dense plasma was followed by high-speed streams (veloci-ties around 600–700 km/s) during 8 to 12 December 2000. On 7 December, the solar wind density was 10–15 cm−3and the velocity was 420–460 km/s. Consequently, the dynamic pressure varied around 4 nPa (Fig. 8, third panel).
The IMF data (ACE/MAG data), together with IMAGE station Ny ˚Alesund (NAL) magnetograms, are shown in Fig. 1. The correlation between the ground magnetic north component (X) and IMF BZ is best (0.7) when the delay
from the ACE to dusk sector ionosphere is assumed to be 80 min. During 12:10–14:10 UT, ACE recorded primar-ily negative BY, with a short excursion to positive values
around 12:50 UT. IMF BZ and BXvaried between −5 and
8 nT. The solar wind proton density (data not shown) pulsed quasi-periodically around 13 cm−3, with amplitudes up to 2 cm−3. The dominant periods of the density pulsations are ∼ 8 − 9 min, but short- and long-period pulsations are su-perposed. At the same time, the solar wind speed fluctuated with similar periods.
Figure 2 shows six H (magnetic north component) mag-netograms of some IMAGE, Greenland network (Friis-Christensen et al., 1985) and CANOPUS (Rostoker et al., 1995) stations. The figure shows for each network data from
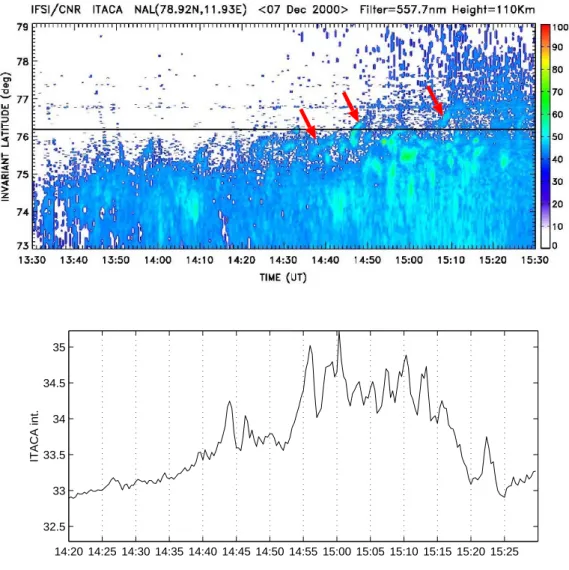
14:20 14:25 14:30 14:35 14:40 14:45 14:50 14:55 15:00 15:05 15:10 15:15 15:20 15:25 32.5 33 33.5 34 34.5 35 ITACA int.
Fig. 4. (Top panel) The ITACA keogram and (bottom panel) temporal variations of the average auroral intensity (in ADUs) along the middle magnetic meridian of the camera FOV.
one high-latitude station (MLATs 76.1–85.7, AACGM co-ordinates are used throughout this study) and one station at standard oval latitudes (MLATS 65.9–70.9). When IM-AGE was in the dusk sector, Greenland and CANOPUS magnetometers monitored the noon and dawn sectors, re-spectively. The magnetograms recorded at auroral latitudes show during the entire period pulsations in the Pc 5 range. The pulsations are evident in the noon and dawn sectors and somewhat weaker, but discernible in the dusk sector. The largest amplitudes were recorded at the CANOPUS sta-tions after 14:00 UT. The large amplitudes can be related to the IMF BZ excursion to negative values, as observed by
ACE at 12:40 UT (Fig. 1). This excursion temporarily en-hanced the ionospheric convection which can be seen as neg-ative (evening cell) and positive bays (morning cell) around ∼14:00 UT in the H magnetograms of the high-latitude stations. Similar convection enhancement took place also around ∼ 15:00 UT (IMF turning after 13:10 UT), although by then, the morning sector ionospheric convection reversal had moved to higher latitudes so that TAL was no longer monitoring the polar cap convection but rather the sunward
convection, which caused negative deviations in H .
The results of the Fourier-analysis of the X-pulsations observed during 14:00–14:30 UT by the Churchill merid-ional chain of CANOPUS stations (ISL, GIL, CHU, ESK, RAN, and TAL) are shown in Fig. 3. The plots show the Fourier amplitudes and relative phases at different frequen-cies as functions of latitude. The curves illustrate the char-acteristics typical for field line resonances (FLRs) (Chen and Hasegawa, 1974). The latitude of maximum amplitude de-creases with increasing frequency. According to CANOPUS observations, the amplitudes of 5.0 and 4.4 mHz peak at GIL (MLAT 67.11◦), that of 3.3 mHz at CHU (MLAT 69.41◦), and the amplitude of 2.2 mHz at ESK (MLAT 71.6◦). At
fre-quencies 2.8 and 3.9 mHz, the peaks in the amplitudes are less pronounced. For all frequencies, the phases decrease with ∼ 180◦at the latitudes of maximum amplitude, which also is a typical FLR feature.
Figure 4 shows the ITACA keogram (intensity versus lati-tude along the middle magnetic meridian of the camera FOV) for the period of 13:30–15:30 UT. After 13:25 UT, the all-sky camera (MLAT = 76.1, MLT ∼ UT + 3) started to observe
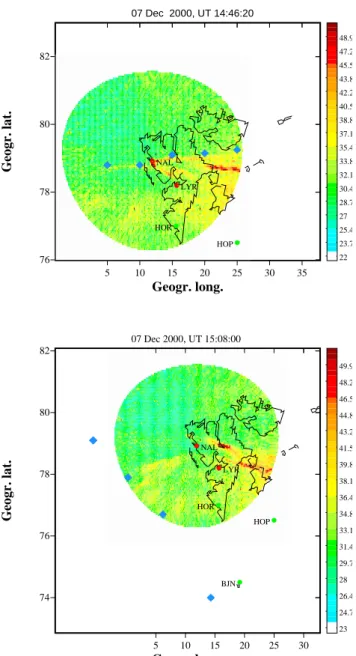
5 10 15 20 25 30 35 76 78 80 82 Geogr. long. Geogr. lat. 07 Dec 2000, UT 14:46:20 22 23.7 25.4 27 28.7 30.4 32.1 33.8 35.4 37.1 38.8 40.5 42.2 43.8 45.5 47.2 48.9 LYR NAL HOR HOP 5 10 15 20 25 30 74 76 78 80 82 Geogr. long. Geogr. lat. 07 Dec 2000, UT 15:08:00 23 24.7 26.4 28 29.7 31.4 33.1 34.8 36.4 38.1 39.8 41.5 43.2 44.8 46.5 48.2 49.9 LYR NAL HOR HOP BJN
Fig. 5. Mapped ASC images (wavelength 557.7 nm, intensity
in ADUs) recorded by ITACA at Ny ˚Alesund at 14:46:20, and
15:08:00 UT. The altitude of the auroras is assumed to be 110 km. The diamonds in the upper plot delineate the poleward edge of the auroras and in the lower plot they show the DMSP F13 footpoints during 15:06–15:08 UT (Fig. 5). In the lower plot, the second dia-mond from the top marks the poleward edge of the auroral precipi-tation observed by DMSP.
faint auroras near the southern horizon. The auroras stayed in the horizon until ∼ 13:47 UT when the auroras also appeared in the southern sky of Ny ˚Alesund. This auroral activation can be associated with the convection enhancement observed by the polar cap magnetometer stations, as both the auroras and convection ceased at ∼ 14:10 UT. After 14:26 UT, the auroras reappeared near the zenith, and folds and rayed struc-tures were observed until ∼ 15:20 when clouds started to gradually disturb the recordings. Again, these auroras can be
associated with enhanced convection and the IMF BZ
turn-ing to negative values, although the auroras brightened some-what earlier than when the IMF turning (with the 80 min de-lay) took place. Faint poleward propagating auroras (marked with the red arrows) near the zenith were observed between 14:40–15:15 UT. Sunward propagating structures are visible at least in the ITACA frames acquired at 14:45–14:47 UT and 15:21–15:22 UT. Examples of the ITACA frames (on maps) recorded during the latter period of enhanced activity are shown in Fig. 5.
The DMSP F13 satellite flew above the ITACA FOV dur-ing 15:03–15:11 UT. The track of the satellite footpoints is shown in the second frame of Fig. 5 and the particle pre-cipitation data and electric field observations (as converted to plasma flow velocities) are shown in Fig. 6. The loca-tion of the poleward edge of the auroras (marked with the vertical line in Fig. 6) coincides with the poleward edges (at 15:07 UT) of structured electron precipitation and ener-getic ion precipitation. Furthermore, at the same latitudes, the satellite observed the evening sector ionospheric convec-tion reversal, where the sunward convecconvec-tion (lower latitudes) changed to anti-sunward convection (higher latitudes). 3.2 Cluster II observations
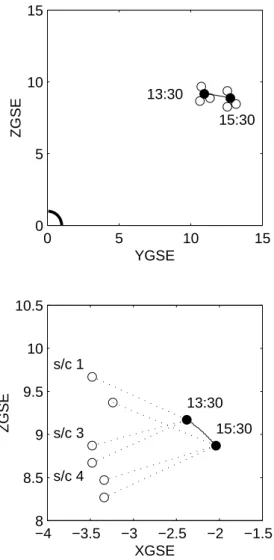
Figure 7 shows the Cluster orbit and spacecraft configura-tion during 13:30–15:30 UT (the distances between the four spacecraft have been multiplied by 10 to show the configu-ration more clearly). According to EFW observations, the magnetopause was closer to the Earth than, for example, the statistical magnetopause model by Shue et al. (1997) sug-gests. Consequently, the spacecraft were primarily in the magnetosheath just outside the high-latitude dusk flank of the magnetopause or in the magnetospheric boundary layers, either in the high-latitude boundary layer (HLBL) or in the LLBL. Spacecraft 2 (Salsa) was about 800 km sunward from the other spacecraft.
Satellite potential recordings are available only from spacecraft 3 (Samba). The negative of the potential (−φ) is shown in the second panel of Fig. 8. During the peri-ods when Samba was in the dense magnetosheath plasma, −φwas around −4 V, while during the visits into the thin-ner magnetospheric plasma, −φ dropped down to values of < −10 V. The −φ values in the range of −6 . . . − 5 V corre-spond to plasma densities around 10 cm−3which is a typical magnetosheath or solar wind density, while the −φ values between −10...−15 V correspond to magnetospheric plasma densities (1 cm−3) (Pedersen et al., 2001).
During 13:40–14:10 UT, −φ exhibits several quasi-periodic (T ∼ 4–6 min) transitions between magnetospheric and magnetosheath plasmas. During 14:10–14:25 UT, the satellite potential shows variations with shorter periods (T ∼ 1 min) and smaller amplitudes. With −φ close to −5 V, this suggests that Samba stayed at the outer edge of the magnetopause or in a magnetospheric boundary layer during this period. A couple of encounters with magnetospheric-type plasma were recorded around 14:30 UT and 14:45 UT,
102 103 104 102 103 104 108 102 103 104 Ion Ele -2000 0 2000 Sunward Antisunward HOR-C 105 107 109
ELECTRON FLUX eV/(cm 2 s sr eV) 103 105 107 ION FLUX eV/(cm 2 s sr eV)
F13
M/SEC07 Dec 2000
ENERGY (eV) Electrons Ions eV 1/(cm 2 s sr) 54180 15:03 61.2 17.6 54300 15:05 67.8 17.5 54420 15:07 74.5 17.4 54540 15:09 81.0 17.2 54660 15:11 87.3 15.8 54780 15:13 85.2 7.00 54900 15:15 78.5 6.30 55020 15:17 71.6 6.20 55140 15:19 64.5 6.10 55260 15:21 57.5 6.10 UT(SEC) HH:MM MLAT MLTPoleward edge of auroras at NAL
Fig. 6. Data recorded by DMSP F13 instruments during the track shown in Fig. 5 (from top to bottom): Ion and electron number fluxes and average energies, spectra showing differential energy fluxes, and plasma flow velocities. The vertical line marks the location of the poleward edge of the auroras shown in Fig. 5.
and after ∼ 14:50 UT, the spacecraft eventually moved fur-ther away from the magnetopause.
The top panel of Fig. 8 is a reproduction of the third panel of Fig. 1 showing the IMF BZ as recorded by ACE/MAG.
Due to the differences in the signal propagation speeds along the magnetopause and into the ionosphere, the time delay of 80 min which gives the best correlation with the ground-based observations may not directly be applicable in the com-parisons with the Cluster data. Nevertheless, it seems that the density variations with smaller amplitudes took place only during the period of IMF BZ > 0, while the larger
oscil-lations were observed when IMF BZ was primarily
nega-tive. Note also that IMF BZ had quasi-periodic variations
with a shorter period (T ∼ 1 min), especially during 14:05– 14:20 UT (delayed time) and with a longer period, for exam-ple, during 13:30–14:05 UT. The periods of the satellite po-tential variations follow surprisingly well the periods of the IMF BZoscillations. The bottom panel of Fig. 8 shows the
dynamic pressure as derived from the ACE/SWEPAM 64 s resolution data. The longer period variations are visible also in this curve, especially during ∼ 13:45–14:10 UT.
The satellite potential oscillations can be associated with
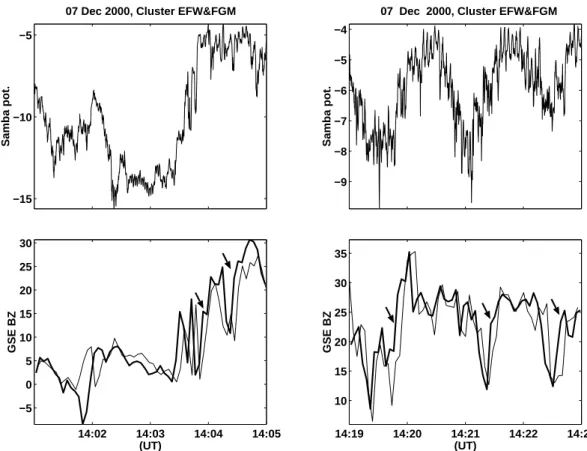
certain magnetic field variations which were observed by the FGM instruments on board all four spacecraft. The sig-natures observed at Salsa systematically precede those ob-served at the other satellites. Thus, we can associate the vari-ations with tailward propagating waves. Two examples of the magnetic variations associated with the waves, as recorded by the Salsa and Samba FGMs, are shown in Fig. 9. In or-der to resolve the real phase velocity of the waves along the magnetopause, the observed magnetic field vectors should be transformed to the LMN -coordinates (Russell and Elphic, 1979) (N normal to the boundary, M and N in the bound-ary tangetial plane). For this case, defining the appropriate LMN-coordinates is difficult because data from a clear mag-netopause crossing close enough to the time of interest are not available. Consequently, the phase velocities are esti-mated with the component along the Salsa-Samba line. The inter-spacecraft time delays are determined by visual com-parison of the curves since both temporal variations and con-vecting signatures are mixed in the data and thus, the cross correlation method would not give reliable results. During the larger oscillations (period 13:40-14:10 UT), which we in-terprete as consequences of magnetopause surface waves, the
0 5 10 15 0 5 10 15 13:30 15:30 YGSE ZGSE −4 −3.5 −3 −2.5 −2 −1.5 8 8.5 9 9.5 10 10.5 13:30 15:30 s/c 3 s/c 4 s/c 1 XGSE ZGSE
Fig. 7. Cluster orbit and configuration during 13:30–15:30 UT on 7 December 2000 in GSE Y Z and XZ planes. The solid line and black dots show the location of spacecraft 2 (Salsa). In the bottom panel, the dashed lines join Salsa with the other spacecraft. For clar-ity reasons, the real inter-spacecraft distances have been multiplied by 10.
delays between the signatures observed at Salsa and Samba at the eight clearest transition times varied between 2 and 8 s (error in the timing ±2 s), yielding estimates for the wave phase velocities in the range between 106 km/s and 385 km/s (±100 km/s, average 215 km/s). The time delays associated with the shorter and smaller density pulsations (eight transi-tion times) are significantly less scattered (6–8 s ±2 s), yield-ing velocities 121–169 km/s (±100 km/s, average 126 km/s).
4 Discussion
4.1 Solar wind MHD waves and magnetopause waves The wave activity which Cluster observed at the magne-topause has a good correlation with the upstream solar wind variations recorded by ACE at ∼ 230 RE (Fig. 8). A
com-parison of ACE/MAG and ACE/SWEPAM observations
re-−14 −12 −10 −8 −6 −4 Sat. pot. (V) −4 −2 0 2 4 6 8 IMF Bz (nT)
07 Dec 2000, ACE & EFW/Samba
13:30 13:45 14:00 14:15 14:30 14:45 15:00 15:15 15:30 3.5
4 4.5
Dyn. pressure (nPa)
(UT)
Fig. 8. (Top panel) IMF BZ as recorded by ACE (time shifted by 80 min), (middle panel) negative of the satellite potential of Samba (spacecraft 3), and (bottom panel) dynamic pressure based on ACE/SWEPAM proton density and speed data.
veals that the corresponding components of the IMF and ve-locity are correlated, while the IMF magnitude is relatively constant. For a primarily positive IMF BX, this suggests
anti-sunward propagating Alfv´en waves (Belcher and Davis, 1971) convecting at solar wind speed. However, since the solar wind proton density also pulsed quasi-periodically, the oscillations propagating in the solar wind were most likely a mixture of Alfv´en and compressional waves.
The solar wind Alfv´en waves interact with the bow shock, generating Alfv´en and compressional modes in the magne-tosheath (Lin et al., 1996; Sibeck et al., 1997). The MHD waves impinging on the magnetopause can cause pulsations in the reconnection rate and act as a source of Pc 5 pulsa-tions in the magnetosphere (Lockwood et al., 2001; Prikryl et al., 1998). The compressional waves in the magnetosheath are expected to cause magnetopause surface waves, such as those observed by Cluster during the event discussed here. In addition, the fast mode is launched into the magnetosphere where it can couple to the shear mode driving the FLRs. In our case, magnetic field oscillations with periods in the range of 3–6 min were recorded, for example, by the geosta-tionary GOES satellite in the dusk sector and by Geotail in the mid-tail (XGSE ∼ −15 RE) midnight region (data not
pulsa-14:02 14:03 14:04 14:05 −5 0 5 10 15 20 25 30 GSE BZ (UT) −15 −10 −5 Samba pot.
07 Dec 2000, Cluster EFW&FGM
14:19 14:20 14:21 14:22 14:23 10 15 20 25 30 35 GSE BZ (UT) −9 −8 −7 −6 −5 −4 Samba pot.
07 Dec 2000, Cluster EFW&FGM
Fig. 9. Negative of the satellite potential of Samba and BZ(GSE), as recorded by Salsa (thick line) and Samba (thin line) FGMs. Left (right) panel shows an example recorded during the larger (smaller) potential variations. The arrows point to the differences in the curves which have been used when estimating the phase velocities.
tions such as the magnetograms in our Fig. 2. Thus, a com-bination of Alfv´en and compressional waves propagating in the solar wind was most likely one reason for the appearance of the magnetopause surface waves and magnetospheric and ground magnetic pulsations on 7 December 2000.
4.2 On the connection between surface waves and auroras The theoretical study by Hasegawa (1976) shows that MHD surface waves can convert to kinetic Alfv´en waves with an electric field component parallel to the background magnetic field. The parallel electric field can accelerate particles, for example, at the inner edge of the plasma sheet or the LLBL. Some observational support for the latter option is presented in the case study of high-latitude dusk sector auroras by Farrugia et al. (1994), although this study does not include any magnetospheric observations. The authors associate the waves with Kelvin-Helmholz instabilities driven by the ve-locity and magnetic shears at the LLBL inner boundary. A more recent study by Farrugia et al. (2000) analysing in situ measurements from the equatorial magnetopause shows that the conditions for KHI to become unstable are more favourable at the LLBL inner boundary than at the magne-topause.
The solar wind conditions during our event are in many respects different from those events analysed by Farrugia et
al. (1994, 2000). In these events, the IMF BZstayed positive
continously and thus, energy transfer from the solar wind to the magnetosphere took place primarily via viscous interac-tions, while in our case, energy transport also took place via dayside reconnection during the periods of IMF BZ < 0.
In the case of Farrugia et al. (2000), abrupt changes in the solar wind density generated KH-type waves which propa-gated along the magnetopause from the noon to the flanks. Tailward propagating waves were also observed at the inner edge of the LLBL. In our case, the magnetopause fluctuations were at least partly driven by MHD waves in the solar wind. Despite these differences in the generation mechanisms, the waves described here and in Farrugia et al. (2000) have some similarities; in both cases, tailward propagating waves with periods in the Pc 5 range (accompanied by ground Pc 5 pul-sations) were observed. Thus, it is reasonable to assume that from the viewpoint of the theory of Hasegawa (1976), in both cases, the waves should be able to generate auroras either within the sunward convecting field lines (LLBL inner edge waves) or at the convection reversal (magnetopause waves).
The magnetic field lines associated with the auroras anal-ysed by Farrugia et al. (1994) map to the magnetospheric equatorial locations clearly inside the magnetopause, accord-ing to the model by Tsyganenko (1989). Similar mappaccord-ing results for our event are presented in Fig. 10 which shows the location of the poleward edge of the auroras observed at
−25 −20 −15 −10 −5 0 0 2 4 6 8 10 12 14 16 18 20 XGSE Z ’GSE
Fig. 10. The locations (the larger diamonds joined with the thin line) of the field lines conjugate with the poleward edge of auroras observed by ITACA at 14:46:20 UT (Fig. 5) in the plane defined by the Samba location and the X-axis of the GSE coordinate system. The dashed line shows the magnetopause location according to the model by Shue et al. (1997). The smaller diamonds show the
max-imum radial extents (R = (YGSE2 +ZGSE2 )1/2)of the traced field
lines.
the Ny ˚Alesund zenith at 14:46:20 UT (Fig. 5) mapped to the magnetic field model by Tsyganenko (1996) (hereafter re-ferred as T96) to the plane where Samba was located at that moment. The spacecraft location is marked with the black dot and the dashed line shows the magnetopause location according to the model by Shue et al. (1997). The larger diamonds show the locations of the field lines in the plane of Samba, while the smaller diamonds show the largest ra-dial extents of the field lines (achieved near the equatorial plane). Keeping in mind that in this case, the magnetopause was more contracted than the model suggests, we can con-clude that the auroras had their source region near the netopause. The Cluster satellites were monitoring the mag-netopause dynamics somewhat sunward from the conjugate region of the auroras, but not too far to make relevant com-parisons with the ground-based observations.
From the basis of the mapping result of Fig. 10, we can assume that the auroras observed near the zenith of Ny
˚
Alesund have their source region near the magnetopause sur-face waves observed by the Cluster spacecraft. These auroras can brighten either due to the magnetopause waves or due to R1 current enhancements associated with enhanced global convection driven by dayside reconnection. A nice correla-tion between variacorrela-tions in the conveccorrela-tion and auroral emis-sion in the R1 region is demonstrated in the study of Moen et al. (1995). The periods of the brightest aurora in the ITACA keogram of Fig. 4 roughly coincide with the IMF BZ < 0
periods, although not exactly. It is evident, however, that the sign of IMF BZcontrols the appearance of the auroras rather
than the existence of the magnetopause waves. Both ACE
and ground-based magnetometer observations (Fig. 2) show that the surface waves most likely persisted at the magne-topause during the whole UT afternoon.
Previously documented observations of ULF wave activ-ity in the magnetospheric boundary layers (Farrugia et al., 2000) and in the R1 region of auroral precipitation (Milan et al., 1999) suggest that these phenomena would be mutually coupled and associated with Pc 5 pulsation activity at the au-roral latitudes. Our data set supports this view, although the pulsations in the dusk sector ground-based observations are rather weak. At high-latitudes, magnetic pulsations were su-perposed with a longer period IMF BZcontrolled variations
and thus, they were not as prominent as in the case of Mi-lan et al. (1999). The intensities of the auroras were at times very low, but the time series of the average intensity along the middle magnetic meridian of the camera FOV (Fig. 4, bottom panel) has clear pulsations (T ∼ 2 − 3 min) dur-ing 14:50–15:20 UT. Durdur-ing this same period, the ITACA keogram shows poleward moving structures which resemble the structures analysed by Milan et al. (1999), although in our case, the patterns are less regular.
4.3 Dawn-dusk asymmetry in the ground magnetic pulsa-tions
Interestingly, Fig. 2 shows that there is a clear asymmetry in the pulsation characteristics observed on closed field lines on the ground between the dawn and dusk sectors. The dawn side waves (for example, at GIL) show the existance of large amplitude pulsations, while those at dusk are much less ap-parent and of a much lower amplitude. Observations from Cluster at the dusk side magnetopause show clear evidence of periodic magnetopause motion across the satellites, consis-tent with surface waves. Given that the magnetosheath flow is likely to be approximately symmetric down both flanks, one might ask why large amplitude pulsation activity is only observed on closed field lines at dawn.
One possible explanation involves the possibility that the magnetopause surface waves and pulsations on the ground are related to the development of the Kelvin-Helmholtz (KH) instability on the magnetopause or the low-latitude boundary layer. Recent work by Mann et al. (1999) has shown that in addition to the standard KH surface wave instability (Pu and Kivelson, 1983), it is also possible for the KH instabil-ity to inject energy into body modes which have a propa-gating character in the magnetosphere. Body type waves in the Pc 5 band on the flanks are usually associated with mag-netospheric waveguide modes. These waveguide modes are trapped between the magnetopause and a turning point within the magnetosphere and hence, possess discrete frequencies, and propagate and disperse down the waveguide on the mag-netospheric flanks (Walker et al., 1992; Wright, 1994).
The KH instability develops as a result of shear flow; how-ever, the undulations that develop on the magnetopause can be stabilised by magnetic tension forces. As discussed by Lee and Olson (1980), the direction of the IMF would be expected to preferentially stabilise the dusk magnetopause
17 Jan 1998
(17) normal (cw) scan mode (150)-800 -600 -400 -200 0 200 400 600 800 Velocity (ms -1 ) Ionospheric scat only 60°N 70°N 80°N 0°E 15°E Pykkvibaer 0°E 15°E 30°E 345°E 13:18 UT to 13:20 UT Pykkvibaer 1000 ms-1 Hankasalmi 0°E 15°E Hankasalmi 5 10 15 20 25 30 35 78 80 82 Geogr. long. Geogr. lat. 17 Jan 1998, UT 13:19:00 7 7.84 8.68 9.52 10.4 11.2 12 12.9 13.7 14.6 15.4 16.2 17.1 17.9 18.8 19.6 20.4 LYR NAL 5 10 15 20 25 30 35 78 80 82 Geogr. long. 17 Jan 1998, UT 13:21:00 8 9.32 10.6 12 13.3 14.6 15.9 17.2 18.6 19.9 21.2 22.5 23.8 25.2 26.5 27.8 29.1 LYR NAL 5 10 15 20 25 30 35 78 80 82 Geogr. long. 17 Jan 1998, UT 13:23:00 7 7.84 8.68 9.52 10.4 11.2 12 12.9 13.7 14.6 15.4 16.2 17.1 17.9 18.8 19.6 20.4 LYR NAL
Fig. 11. Three ASC images (557.7 nm emission in ADUs, assumed to be at 110 km altitude) acquired at LYR on 17 January 1998, at 13:19, 13:20, and 13:23 UT and ionospheric plasma flow direction as observed by the CUTLASS radar system (plots in the bottom row). In the bottom row, the left (right) side plot shows the line-of-sight velocity of the Iceland (Finnish) radar. Positive velocities are towards the radar. The middle plot shows the actual velocity vectors as derived by combining the data of the two radars.
as compared to the dawn side. Moreover, as discussed by Mann et al. (1999), there is a critical magnetosheath flow speed which must be exceeded for body type magnetospheric modes to be energised by the KH instability, and this speed is, in general, larger than the critical speed required for the development of a KH surface wave. In the observations pre-sented here (Fig. 3), the dawn side waves on closed field lines show some similarities with the amplitude and phase charac-teristics expected for waveguide mode driven field line reso-nances (Mathie et al., 1999). Moreover, as shown by Mathie and Mann (2000), the KH instability can be a very efficient driver of waveguide modes and hence, of large amplitude pulsations on closed field lines. Given that the dawn flank is likely to be more KH unstable than the dusk flank, it is possi-ble that the criteria for the KH excitation of body waveguide modes was satisfied in the dawn sector, and resulted in the excitation of large amplitude pulsations on closed field lines. At dusk, however, where the KH is likely to be less unstable, it is possible that the criteria for the excitation of body waveg-uide modes by the KH instability was not satisfied. The dusk magnetopause could have remained KH unstable for the sur-face wave, with both Cluster and ITACA observing the con-sequences of this surface wave.
4.4 Sunward propagating auroral structures
If tailward propagating waves either at the magnetopause sur-face or at the inner edge of the LLBL are assumed to cause high-latitude auroral activity, there it is difficult to understand why sunward propagating brightenings occasionally appear in the auroras. On 7 December 2000, such brightenings were observed during two short (1–2 min) periods. In order to obtain a better view of how common sunward propagating brightenings are, we collected a reference data set of ASC images recorded in Svalbard during January 1998. The data set includes eight 1.5–3 h periods during which the ASC at LYR (MLAT = 75.2, MLON = 113.3, MLT ∼ UT+3) ob-served dusk sector auroras. The set consists of 3720 ASC frames recorded with a 20 s resolution and a 557.7 nm filter.
Brightenings propagating sunward along the arcs are a rel-atively frequent and rather striking feature in the reference data set. In animations, the arcs seem to build up as “fingers” which intrude from the east horizon to the camera field-of-view. Such intrusions can appear either at the poleward edge of the auroral region or within the other arcs. One example of the former situation is shown in Fig. 11 with simultaneous plasma velocity recordings by the CUTLASS radar system. The arcs are in the region of sunward convecting plasma and
thus, the situation is similar to the studies by Moen et al. (1994) and Farrugia et al. (1994). According to Pykkvibær line-of-sight velocities, the sunward intruding arc resided close to the transition region between the sunward and anti-sunward flows. The average propagation speed of the “finger tip” of the arc is 2.6 km/sec, which is clearly higher than the surrounding plasma velocity. A similar event took place 15 min later, and according to simultaneous DMSP data, the arc in this case was just on the equatorward side of the polar cap boundary.
In summary, it seems that solar wind properties alone can-not control the appearance and dynamics of non-FTE type of dusk sector auroras. In addition, processes related to the sunward convecting return flow in the tail may modulate the dusk sector auroral precipitation. In the case of Fig. 11, how-ever, quicklook plots of both AE index and geostationary par-ticle fluxes as recorded by the Los Alamos National Labora-tory instruments show quiet conditions in the tail around the time of interest.
5 Summary and conclusions
We have analysed high-latitude auroral activity and magne-topause dynamics in the dusk sector on 7 December 2000, from the basis of simultaneous ground-based and Cluster ob-servations. A comparison of ACE upstream solar wind data and Cluster FGM and EFW data indicates a close connection between the magnetopause surface waves and quasi-periodic variations in the solar wind magnetic field, velocity and den-sity. Wave modes with periods in the Pc5 range and around 1 min are most pronounced in the data, and comparisons of magnetic field observations of two Cluster spacecraft shows that the shorter and longer period waves were propagating tailward with mean velocities of 126 km/s and 215 km/sec, respectively. The solar wind MHD waves may not have been the only driver of the magnetopause waves. The apparent dawn-dusk asymmetry in the ground magnetic pulsation am-plitudes suggests that also KHI developing at the magneto-spheric boundary layers generated wave activity with differ-ent penetration depths in the dusk and dawn flanks.
We concentrated the analysis on the relationship between the magnetopause waves and auroras at the ionospheric con-vection reversal. Previous studies have shown that during extended periods of relatively constant IMF conditions (IMF BZ>0), KH waves at the inner edge of the LLBL can cause
high-latitude auroras (Farrugia et al., 1994, 2000) within sun-ward convecting field lines. We studied whether the same mechanism would also operate during more variable IMF conditions. According to Cluster observations, the proper-ties of the waves in our case are in many respects similar to those observed by the spaceraft used in the study by Farrugia et al. (2000). It appeared, however, that the occurrence of the high-latitude auroras was controlled by the IMF BZ
direc-tion rather than by the surface wave activity. Visible auroras were observed preferentially during periods of IMF BZ<0,
when dayside reconnection enhanced the ionospheric
con-vection and R1 currents. During a short period we observed ∼ 2 min pulsations in the auroral intensities, similar to the case study by Milan et al. (1999).
A wider inspection of the images acquired by the MIRA-CLE high-latitude ASCs revealed that sunward propagating brightenings are a relatively common feature in the dusk sec-tor non-FTE type of auroras. A more detailed analysis of the magnetospheric and solar wind conditions favoring such behavior is needed in order to resolve whether the brighten-ings are associated with boundary wave dynamics, accelera-tion region phenomena, or with some magnetotail processes. Data collected during Cluster near-perigee conjuctions with the versatile ground-based instrument networks will be of great value also in such studies.
Acknowledgement. We thank the CDAWeb team, K. Ogilvie, H. Singer, and S. Kokubun for providing the possibility to check Wind, GOES and Geotail data from CDAWeb. ACE/SWEPAM data (PI D. J. McComas) was copied from the ACE Science Center web-page. Cluster spacecraft locations were defined with the help of OVT. The MIRACLE network is operated as an international collabora-tion under the leadership of the Finnish Meteorological Institute. The IMAGE magnetometer data are collected as a Finnish-German-Norwegian-Polish-Russian-Swedish project. IRF-U and CNR-IFSI participate to the data distribution and maintenance of the all-sky cameras. The CANOPUS program is a project of Canadian Space Agency and the Greenland magnetometer network is maintained by the Danish Meteorological Institute.
Topical Editor M. Lester thanks S. Milan and J. Moen for their help in evaluating this paper.
References
Balogh, A., Dunlop, M. W., Cowley, S. W. H., Southwood, D. J., Thomlinson, J. G., Glassmeier, K. H., Mussmann, G., L¨uhr, H., Buchert, S., Acu˜na, M. H., Fairfield, D. H., Slavin, J. A., Riedler, W., Schwingenschuh, K., and Kivelson, M. G.: The Cluster mag-netic field investigation, Space Sci. Rev., 79, 1/2, 65–91, 1997. Basinska, E. M., Burke, W. J., Maynard, N. C., Hughes, W. J.,
Win-ningham, J. D., and Hanson, W. B.: Small-scale electrodynamics of the cusp with northward interplanetary magnetic field, J. Geo-phys. Res., 97, 6369–6379, 1992.
Belcher, J. W. and Davis, Jr., L.: Large-amplitude Alfv´en waves in the interplanetary medium, 2, J. Geophys. Res., 76, 3534–3563, 1971.
Chen, L. and Hasegawa, A.: A theory of long-period magnetic pul-sations, 1, Steady state excitation of field line resonance, J. Geo-phys. Res., 79, 1024–1032, 1974.
Cowley, S. W. H, Morelli, J. B., and Lockwood, M.: Dependence of convective flows and particle precipitation in the high-latitude dayside ionosphere on the X and Y components of the interplan-etary magnetic field, J. Geophys. Res., 96, 5557–5564, 1991. Farrugia, C. J., Sandholt, P. E., and Burlaga, L. F.: Auroral activity
associated with Kelvin-Helmhotz instability at the inner edge of the low-latitude boundary layer, J. Geophys. Res., 99, 19 403– 19 411, 1994.
Farrugia, C. J., Gratton, F. T., Contin, J., Cocheci, C. C., Arnoldy, R. L., Ogilvie, K. W., Lepping, R. P., Zastenker, G. N., Noz-drachev, M. N., Fedorov, A., Sauvaud, J.-A., Steinberg, J. T., and Rostoker, G.: Coordinated Wind, Interball/tail, and ground
ob-servations of Kelvin-Helmholz waves at the near-tail, equatorial magnetopause at dusk: 11 January 1997, J. Geophys. Res., 105, 7639–7667, 2000.
Friis-Christensen, E., Kamide, Y., Richmond, A. D., and
Mat-shushita, S.: Interplanetary magnetic field control of
high-latitude electric fields and currents determined from Greenland magnetometer data, J. Geophys. Res., 90, 1325–1338, 1985. Glassmeier, K.-H., H¨onisch, M., and Untiedt, J.: Ground-based
and satellite observations of travelling magnetospheric convec-tion twin vortices, J. Geophys. Res., 94, 2520–2528, 1989. Greenwald, R. A., Baker, K. B., Dudeney, J. R., Pinnock, M., Jones,
T. B., Thomas, E. C., Villain, J.-P., Cerisier, J.-C., Senior, C., Hanuise, C., Hunsucker, R. D., Sofko, G., Koehler, J., Nielsen, E., Pellinen, R., Walker, A. D. M., Sato, N., and Yamagishi, H.: Darn/Superdarn: a global view of the dynamics of high-latitude convection, Space Science Reviews, 71, 761–796, 1995. Gustafsson, G., Bostr¨om, R., Holmgren, G., Lundgren, A.,
Stasiewicz, K. ˚Ahl´en, L., Mozer, F. S., Pankow, D., Harvey,
P., Berg, P., Ulrich, R., Pedersen, A., Schmidt, R., Butler, A., Fransen, A. W. C., Klinge, D., Thomsen, M., F¨althammar, C.-G., Lindqvist, P.-A., Christensson, S., Holtet, J., Lybekk, B., Sten, T. A., Tanskanen, P., Lappalainen, K., and Wygant, J.: The electric Field and Wave Experiment for the Cluster Mission, Space Sci. Rev., 79(1–2), 137–156, 1997.
Hardy, D. A., Smith, L. K., Gussenhoven, M. S., Marshall, F. J., Yeh, H. C., Shumaker, T. L., Hube, A., and Pantazis, J.: Precipi-tating electron and ion detectors (SSJ/4) for the block 5D/flights 6–10 DMSP satellites: Calibration and data presentation, Rep. AFGL-TR-84-0317, Air Force Geophys. Lab., Hanscom Air Force Base, Mass., 1984.
Hasegawa, A.: Particle acceleration by MHD surface wave and for-mation of aurora, J. Geophys. Res., 81, 5083–5090, 1976. Lee, L. C. and Olson, J. V.: Kelvin-Helmholtz instability and the
variation of geomagnetic pulsation activity, Geophys. Res. Lett., 7, 777–780, 1980.
Lin, Y., Lee, L. C., and Yan, M.: Generation of dynamic pres-sure pulses downstream of the bow shock by variations in the inteplanetary magnetic field orientation, J. Geophys. Res., 101, 479–493, 1996.
Lockwood, M., Cowley, S. W. H., and Onsager, T. G.: Ion accel-eration at both the interior and exterior Alfv´en waves associated with the magnetopause reconnection site: Signatures in cusp pre-cipitation, J. Geophys. Res., 101, 21 501–21 513, 1996. Lockwood, M., Opgenoorth, H., van Eyken, A. P., et al.:
Coor-dinated Cluster, ground-based instrumentation and low-altitude satellite observations of transient poleward-moving events in the low and high altitude mantle regions, Ann. Geophysicae, this is-sue, 2001.
Luhmann, J. G., Walker, R. J., Russell, C. T., Crooker, N. U., Spre-iter, J. R., and Stahara, S. S.: Patterns of potential magnetic field merging sites on the dayside magnetopause, J. Geophys. Res., 89, 1739–1742, 1984.
L¨uhr, H., Lockwood, M., Sandholt, P. E., Hansen, T. L., and Moretto, T.: Multi-instrument ground-based observations of a travelling convection vortices event, Ann. Geophysicae, 14, 162– 181, 1996.
L¨uhr, H., Aylward, A., Bucher, S. C., Pajunp¨a¨a, A., Pajunp¨a¨a, K., Homboe, T., and Zalewski, S. M.: Westward moving dynamic substorm features observed with the IMAGE magnetometer net-work and other ground-based instruments, Ann. Geophysicae, 16, 425–440, 1998.
Mann, I. R., Wright, A. N., Mills, K. J., and Nakariakov, V. M.:
Ex-citation of magnetospheric waveguide modes by magnetosheath flows, J. Geophys. Res., 104, 333–353, 1999.
Mathie, R. A., Mann, I. R., Menk, F. W., and Orr, D.: Pc5 ULF pulsations associated with waveguide modes observed with the IMAGE magnetometer array, J. Geophys. Res., 104, 7025–7036, 1999.
Mathie, R. A. and Mann, I. R.: Observations of harmonic Pc5 field line resonance phase speeds: A diagnostic of their excitation mechanism, J. Geophys. Res., 105, 10 713–10 728, 2000. McHenry, M. A. and Clauer, C. R.: Modeled ground magnetic
sig-natures of flux transfer events, J. Geophys. Res., 92, 11 231– 11 240, 1987.
Milan, S. E., Yeoman, T. K., Lester, M., Moen, J., and Sandholt, P. E.: Post-noon two-minute period pulsating aurora and their re-lationship to the dayside convection pattern, Ann. Geophysicae, 17, 877–891, 1999.
Moen, J., Sandholt, P. E., Lockwood, M., Egeland, A., and Fukui, K.: Multiple, discrete arcs on sunward convecting field lines in the 14–15 MLT region, J. Geophys. Res., 99, 6113–6123, 1994. Moen, J., Sandholt, P. E., Lockwood, M., Denig, W. F., Løvhaug, U.
P., Lybekk, B., Egeland, A., Opsvik, D., and Friis-Christensen, E.: Events of enhanced convection and related dayside auroral activity, J. Geophys. Res., 100, 23 917–23 934, 1995.
Moen, J., Carlson, H. C., and Sandholt, P. E.: Continuous observa-tion of cusp auroral dynamics in response to an IMF By polarity change, Geophys. Res. Lett., 26, 1243–1246, 1999.
Moretto, T. and Yahnin, A.: Mapping travelling convection vortex events with respect to energetic particle boundaries, Ann. Geo-physicae, 16, 891–899, 1998.
Newell, P. T., Feldstein, Y. I., Galperin, Y. I., and Meng, C.-I.: Morphology of nightside precipitation, J. Geophys. Res., 101, 10 737–10 748, 1996.
Newell, P. T., Burke, W. J., Meng, C.-I., Sanchez, E. R., and Greenspan, M. E.: Identification and observations of the plasma mantle at low altitudes, J. Geophys. Res., 96, 35–45, 1991. Opgenoorth, H. J., Lockwood, M., Alcayd´e, D., et al.:
Coordi-nated Ground-based and Cluster observations on global and local scales, during a transient postnoon sector excursion of the day-side magnetospheric Cusp in response to solar wind variations, Ann. Geophysicae, this issue, 2001.
Orsini, S., Kauristie, K., Massetti, S., Cerulli-Irelli, P., Candidi, M., Syrj¨asuo, M., Baldetti, P., Morbidini, A., Sparapani, R., and Tabacchioni, F.: A new all-sky camera – ITACA – is part of the MIRACLE network, Proc. 5th International Conference on Sub-storms, St. Petersburg, Russia, 16–20 May 2000, ESA SP-443, ESA Publications Division, ESTEC, Noorwijk, The Netherlands, 2000.
Pedersen, A., D´ecr´eau, P., Escoubet, C.-P., Gustafsson, G., Laakso, H., Lindqvist, P.-A., Lybekk, B., Mozer, F., and Vaivads, A.: Cluster four-point high time resolution information on electron densities, Ann. Geophysicae, this issue, 2001.
Prikryl, P., Greenwald, R. A., Sofko, G. J., Villain, J. P., Ziesolleck, C. W. S., and Friis-Christensen, E.: Solar-wind driven pulsed magnetic reconnection at the dayside magnetopause, Pc5 com-pressional oscillations, and field line resonances, J. Geophys. Res., 103, 17 307–17 322, 1998.
Provan, G., Yeoman, T. K., and Milan, S. E.: CUTLASS Finland radar observations of the ionospheric signatures of flux transfer events and resulting plasma flows, Ann. Geophysicae, 16, 1411– 1422, 1998.
Pu, Z. Y. and Kivelson, M. G.: Kelvin-Kelmholtz instability at the magnetopause: Solution for compressible plasmas, J. Geophys.
Res., 88, 841–852, 1983.
Rich, F. J.: Technical Description for the Topside Ionospheric Plasma Monitor (SSIES, SSIES-2 AND SSIES-3) on Spacecraft of the Defense Meteorological Satellite Program (DMSP), Rep. PL-TR-94-2187, Air Force Phillips Laboratory, Hanscom Air Force Base, Mass., 1994.
Rostoker, G., Samson, J. C., Creutzberg, F., Hughes, T. J., McDi-armid, D. R., McNamara, A. G., Vallance Jones, A., Wallis, D. D., and Cogger, L. L.: CANOPUS – A ground based instrument array for remote sensing the high-latitude ionosphere during the ISTP/GGS program, Space Sci. Rev., 71, 743–760, 1995. Russell, C. T. and Elphic, R. C.: ISEE observations of flux transfer
events a the dayside magnetopause, Geophys. Res. Lett., 6, 33– 36, 1979.
Sandholt, P. E., Lockwood, M., Oguti, T., Cowley, S. W. H., Free-man, K. S. C., Lybekk, B., Egeland, A., and Willis, D. M.: Mid-day auroral breakup events and related energy and momentum transfer from the magnetosheath, J. Geophys. Res., 95, 1039– 1060, 1990.
Shue, J.-H., Cao, J. K., Fu, H. C., Russell, C. T., Song, P., Khurana, K. K., and Singer, H. J.: A new functional form to study the solar wind control of the magnetopause size and shape, J. Geophys. Res., 102, 9497–9511, 1997.
Sibeck, D. G., Takahashi, K., Kokubun, S., Mukai, T. , Ogilvie, K. W., and Szabo, A.: A case study of oppositely propagating Alfv´enic fluctuations in the solar wind and magnetosheath,
Geo-phys. Res. Lett., 24, 3133–3136, 1997.
Syrj¨asuo, M. T., Pulkkinen, T. I., Janhunen, P., Viljanen, A., Pelli-nen, R. J., Kauristie, K., Opgenoorth, H. J., Wallman, S., Eglitis, P., Karlsson, P., Amm, O., Nielsen, E., and Thomas, C.: Obser-vations of substorm electrodynamics using the MIRACLE net-work, in:Substorms-4, (Eds) Kokubun, S. and Kamide, Y., Proc. International Conference on Substorms-4, Lake Hamana, Japan, Terra Scientific Publishing Company, Tokyo, 1998.
Tsyganenko, N. A.: Magnetospheric magnetic field model with a warped tail current sheet, Planet. Space Sci., 37, 5–20, 1989. Tsyganenko, N. A.: Modelling the Earth’s magnetospheric
mag-netic field confined within a realistic magnetopause, J. Geophys. Res., 100, 5599–5612, 1996.
Walker, A. D. M., Ruohoniemi, J. M., Baker, K. B., and Greenwald, R. A.: Spatial and temporal behavior of ULF pulsations observed by the Goose Bay HF radar, J. Geophys. Res., 97, 12 187–12 202, 1992.
Woch, J. and Lundin, R.: Signatures of transient boundary layer processes observed with Viking, J. Geophys. Res., 97, 1431– 1447, 1992.
Wright, A. N.: Dispersion and wave coupling in inhomogeneous MHD waveguides, J. Geophys. Res., 99, 159–167, 1994. Yahnin, A. and Moretto, T.; Travelling convection vortices in the
ionosphere map to the central plasma sheet, Ann. Geophysicae, 14, 1025–1031, 1996.