KATHLEEN FOLEY FELDSTEIN A.B., Radcliffe College
(1962)
SUBMITTED IN PARTIAL FULFILLMENT OF THE REQUIREMENTS FOR THE
DEGREE OF DOCTOR OF PHILOSOPHY at the MASSACHUSETTS INSTITUTE OF TECHNOLOGY October 1976
Signature redacted
Signature of Author. .Sige
. . . . . . .Department of Economics
i
b
Signature redacted
Certifi~ed by. - - - -
--Signature redacted
Accepted by. . . . . .. . . . ... . . . . . . . . . . . . Chairman, Departmental Committee on Graduate Students
Archives
FEB 9 1977
KATHLEEN FOLEY FELDSTEIN
Submitted to the Department of Economics
in October 1976 in partial fulfillment of the requirements for the Degree of Doctor of Philosophy
ABSTRACT
The thesis presents a model of the economics of public libraries using a national sample of public
libraries for the year 1968. The first part of the model is the collective demand for library service as reflected in locally financed expenditure on public libraries.
Individual demand for the use of library services, as distinct from collective demand for library provision, is considered in the second part of the model. A parallel
issue considered in the thesis is the estimation of cost functions for public libraries.
Chapter Two analyzes the community's demand for the provision of library services. The model assumes that decision-makers maximize some weighted function of
individual preferences. The weights reflect the local pressure groups which exercise an influence over the level of the service. When individual demands for library pro-vision are aggregated, expenditure on libraries depends on
five types of variables: price variables including the influence of intergovernmental aid, income variables, tax structure, taste variable, and expenditure on other public goods and services. In the estimation, linear equations are used for the sample as a whole and for three community
size subgroups. Both ordinary least squares (OLS) and instrumental variables (IV) estimation methods are used.
The results suggest that unconditional state aid leads to substitution of intergovernmental grants for own expenditure, particularly in small communities. The pressure
group hypothesis is compared with a simple median preference voter model. Using either model, income is the important
socio-economic determinant of expenditure on libraries. Education and age groups generally do not have significant influences.
In Chapter Three there is a discussion of the nature of library costs, followed by a section which analyzes
in detail. The main conclusion is that library systems
exhibit slightly decreasing returns to scale while individual library branches have increasing returns to scale. The
implication is that having fewer large branches is probably preferable to having more small branches. The cost functions
suggest that the current zero price policy of public libraries should be reconsidered.
Individual demand for the public library is analyzed in Chapter Four. The theory of consumer search behavior is applied to the market for books. An aggregate demand
function for library services is estimated, using a constant elasticity demand function and using both OLS and IV esti-mators. The estimation shows that the most important
quality determinant of library circulation is the relative number of staff members and that the influence of additions to stock is much greater than that of the size of stock. The most significant socio-economic determinant of library circulation is education while there is no direct relation-ship between income and library use. These results are in striking contrast to those of Chapter Two explaining library expenditure. The estimation also suggests that there is "crowding" in the consumption of public library services.
Throughout the thesis attention is drawn to the implications of results for public policy. Different
methods of introducing prices are considered. The direction for future research on public libraries depends on the
collection of better data, suggestions for which are made.
Franklin M. Fisher
Particular thanks are due to Martin Feldstein
and to my principal thesis supervisor, Professor Franklin Fisher. They have both encouraged me from my earliest interest in economics. This encouragement has extended to proddinq at times on both their parts, but I am, now at least, grateful for this too. The second member of my thesis committe, Professor Cary Brown, offered very valuable comments and saved me from more than one serious error.
Dan Frisch and Amy Taylor were very helpful when computing problems arose. Jeanne Taylor Hapgood and Maureen Kay managed to fit the typing of the thesis into already busy schedules.
Helen Austin, Mary Casey and Barbara Carroll have provided babysitting services, the proverbial sine qua non of the thesis.
To Margaret, Janet, and Marty, thanks for being
Chapter 1. Chapter 2. Chapter 3. Chapter 4. Chapter 5. References Introduction I. Background
II. The Public Library Model Appendix 1-A: The Data
Appendix 1-B: Libraries and Copyright
Local Library Expenditures
I. Models of Political Choice
II. The Library Budget Model III. The Results
IV. Conclusion
Public Library Costs
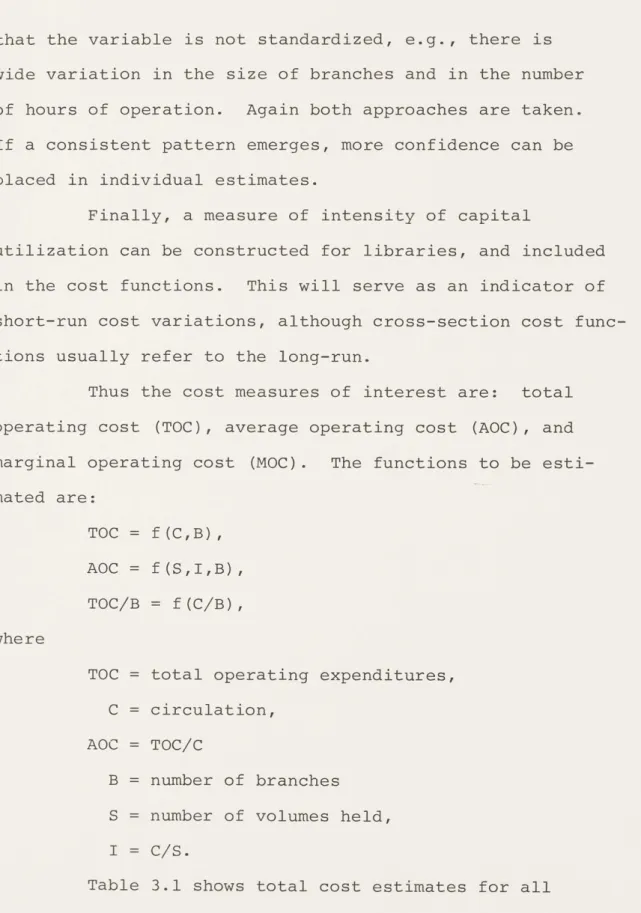
I. The Nature of Library Costs
II. Cost Functions
Individual Demand for Public Library Services
I. Consumer Search
II. The Demand Function
III. The Results
Conclusion Page 1 1 10 17 27 31 34 37 55 71 73 74 77 90 91 103 114 133 140
A-i. Variable Definitions--Library Data 20 2.1. Definitions of Variables Used in Expenditure 52
Equations
2.2. Locally Financed Expenditure on Library 56 Services: All Libraries
2.3. Locally Financed Expenditure on Library 57 Services: A Comparison of Ordinary Least
Squares and Instrumental Variables Estimates
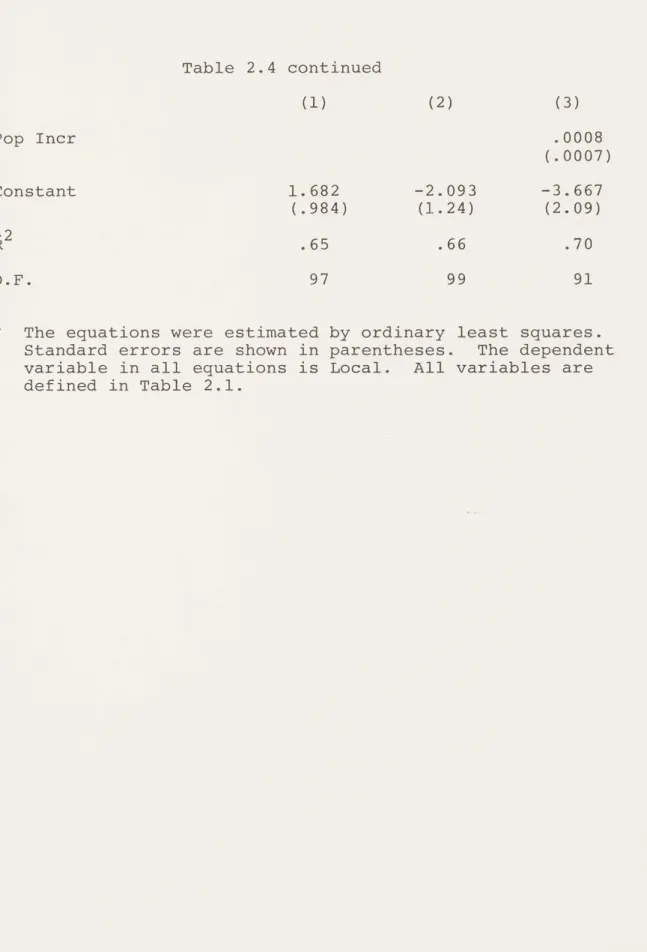
2.4. Locally Financed Expenditure on Library 58 Services: Libraries Serving Communities with
Population less than 50,000
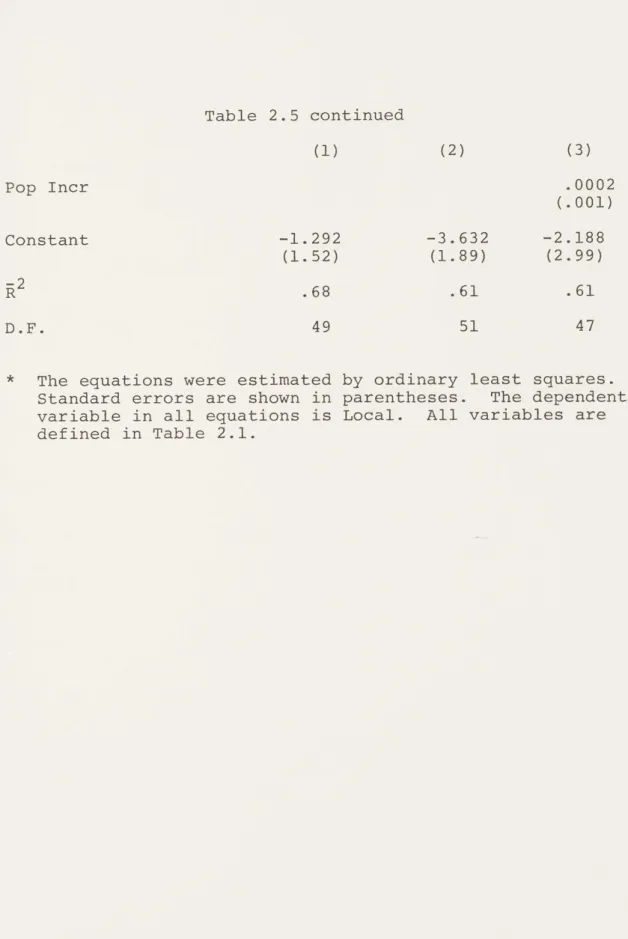
2.5. Locally Financed Expenditures on Library 60 Services: Libraries Serving Communities with
Population Between 50,000 and 100,000
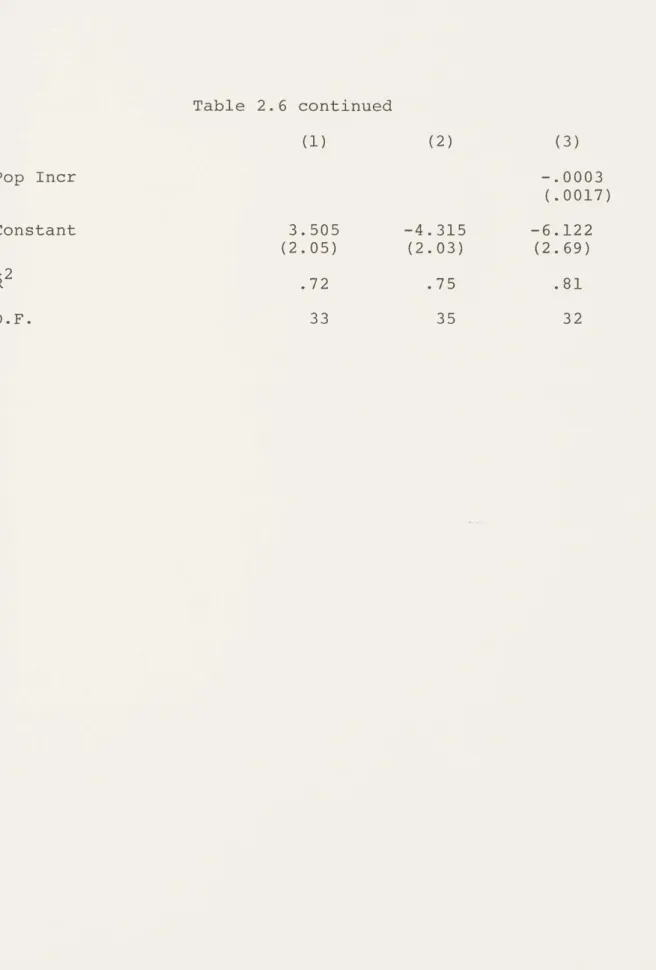
2.6. Locally Financed Expenditure on Library 62 Services: Libraries Serving Communities with
Population Between 100,000 and 500,000
2.7. Locally Financed Expenditure on Library 64 Services: Instrumental Variables Estimates
2.8. Locally Financed Expenditure on Public 69 Libraries: Effects of Related Expenditures
3.1. Cost Functions with Scale Measured by 80 Circulation
3.2. Average Cost Functions with Scale Measured by 84 Size of Stock
3.3. Average Cost as a Function of Stock Size 85 4.1. Definitions of Variables Used in Demand 111
Equations
4.2. Determinants of Public Library Circulation: 117 All Libraries
4.3. Determinants of Public Library Circulation: 119 Libraries Serving Communities with Population
less than 50,000
4.4. Determinants of Public Library Circulation: 121 Libraries Serving Communities with
Page 4.5. Determinants of Public Library Circulation: 123
Libraries Serving Communities with Population greater than 100,000
4.6. Determinants of Public Library Circulation: 131 All Libraries
Chapter 1.
INTRODUCTION I. Background
Like the little red schoolhouse, the public library is part of the romantic landscape of America. It is an in-stitution which is difficult to challenge even though the conditions which gave rise to the public library have largely ceased to exist. This thesis will undertake a reexamination of the grounds for public library provision and will develop
a model of the public library system as it exists today. The public library as a free, publicly supported, circulating service available to all citizens began around
the middle of the nineteenth century when the Boston Public Library was founded.1 Before then, private subscription
libraries were fairly common in large towns and throughout the Northeast. Mercantile libraries, often aided by business interests, existed in many communities as educational centers for workers. These may have been the origin of the librarians' article of faith that libraries are important vehicles for
self-education of the uneducated lower classes and of immi-grants. Purely commercial rental libraries were sometimes available.
A good history of public libraries in the United States is contained in Elmer Johnson (1965).
There were a few instances of true public libraries, but it was not until about 1850 that state legislatures began to allow local governments to levy taxes for public libraries. These laws and the example of the financially solid establish-ment of the Boston Public Library were the stimuli to a rapid
growth in public libraries.
The history of the public library movement is one of steady growth with a few noticeable spurts. The first of these is associated with Andrew Carnegie,,whoat the turn of the century,offered funds for the construction of libraries provided that the communities agreed to support their
continu-ation. He aided the construction of about 2,500 libraries in North America and Great Britain. Carnegie was of course a great believer in the self-education function of public
libraries.
The federal government became involved in public libraries after 1933. The Works Progress Administration was the source of both workers and new buildings, and through the WPA library services were greatly expanded and extended to cover a much wider proportion of the population. Neverthe-less, it was felt that rural areas were inadequately provided with public library services and in 1956 the Library Services Act was passed. This act provided federal aid for the develop-ment and expansion of public library services in rural areas.
The act was amended in 1964 to become the Library Services and Construction Act, and in this format aid was available to urban and rural libraries. In addition it has become national policy to support the development of regional lib-rary systems, through which access to all levels of liblib-rary services,including specialized reference materialcan be made available to all citizens.
Public libraries have constituted a very small but steady proportion of local public expenditures. In 1960 public libraries received slightly more than one percent of local expenditures. Pfister and Milliman (1970) suggest it is the very smallness of the amount allocated to libraries that has allowed them to retain a "halo" effect without any reexamination of the grounds for public provision of
libraries.
In addition to the steady expenditure on public lib-raries by local communities, it has been national policy for the last twenty years to expand public library provision. Throughout that period policy has been characterized by a "needs" approach, partly fostered by the strong lobbying ac-tivities of the American Library Association. For example, librarians have urged fixed minimum standards for book vol-umes per capita without regard to local characteristics.2
2
In the major research analysis undertaken by the National Advisory Commission on Libraries (Knight and Nourse, 1969),
there seems to be no critical evaluation of the rationale for having public libraries.
Federal aid has been maintained in the last few years despite efforts of the administration to reduce aid. Public libraries continue to be a national policy interest, as evidenced by the recent announcement of a forthcoming Presidential Conference on Libraries. Thus it would seem that this is a good time to undertake at last a critical study of public library provision.
Furthermore, the nature of library production pro-cesses may create continuing cost pressures, as suggested by Baumol and Associates (1969) in their study for the National Advisory Commission. Before rushing to the conclusion that more governmental aid is required to ensure the survival of public libraries, it is worth investigating the feasibility of and justification for user fees to support library services.
Public provision or subsidy is usually considered ap-propriate when the marginal cost of production is less than the average cost, or when there are significant externali-ties of production or consumption. Public support may be desirable in order to modify individual consumption. When this is the case, the good is considered a merit good. Re-cently a slightly different class of public good has been discussed in the literature, namely that for which an option
demand can be said to exist. This is a good whose purchase is infrequent and uncertain, and for which there are substan-tial discontinuities in production. It has been argued that
in these cases public subsidy may be required to maintain pro-duction, even if in most respects the good can be considered private.3
The marginal cost criterion for public subsidy of library services will be discussed in Chapter Three, Public Library Costs. There it will be argued that marginal costs are not very different from average costs for the major
library service, circulation. Reference services should be analyzed separately because of their different nature. Un-fortunately, no statistics are available for this purpose.
Among librarians and other social scientists concerned with libraries, the most common arguments for public provision are the merit good nature of the library (i.e., the desira-bility of substituting social preferences for private tastes) and to a lesser extent, the externalities argument. The merit aspects of the library seem to have been very important to the founders of the early American public libraries.
Throughout the history of public libraries in America it is a recurrent theme that public libraries are a part of
3
This idea was developed by Weisbrod (1964) who gives as examples national parks, hospital beds, and firefighters.
the public education system. However as public school sys-tems have developed and as school libraries have been im-proved, this function of public libraries has steadily eroded in practice if not in the views of policy makers and of
librarians. School libraries have been greatly improved under the Elementary and Secondary Education Act; libraries
in institutions of higher education have received assistance through the Higher Education Act.
The ideas of the library as a home university and as an adjunct to the public education system for the acculturiza-tion of immigrants were relevant throughout the nineteenth century and into the twentieth but are no longer significant today (Molz, 1972,
tion is still used nature of the publi user groups in the of central cities. quick to point out, the correct medium been little if any Externaliti the public library. man confers benefit that the public lib
Banf ield, 1972). This type of justifica-in advocatjustifica-ing an effort to change the
c library service in order to attract non-population, especially ghetto residents
However, as critics like Banfield are it is unclear that the public library is for this function; in addition there has evidence of success in this type of effort. es in consumption are often claimed for
It is a common argument that an educated s to the entire community. To the extent rary serves as a source of self education,
the library provides educational benefits to the community at large. The use of the education analogy can lead to ar-guing that library services ought to be equally available and of equal quality to all.
The public library is a good example of an option de-mand good. The library can serve an archival function for
all members of the community, with a small likelihood of ex-cess demand developing at any time for a particular book. The reference resources which are always available
particu-larly satisfy this function; circulating services do to a lesser degree. In addition, the library can be seen as an example of a cooperative in which the members can take advan-tage of possible economies of scale in the use of staff, for example. Surveys often show that non-users support the public provision of library service (Mendelsohn, 1969; Pfister and Milliman, 1970). This can be taken as support for both the externalities argument and for the option demand nature of libraries.
Economic studies of libraries were nonexistent until the late 1960's. At that time several cost studies and some attempts at demand studies were made. These include the study by Baumol (1969) in which a cost analysis similar to his earlier study of the performing arts (Baumol and Bowen, 1966) was outlined. Unfortunately, the data were extremely
inadequate and the results are inconclusive.4 This analysis also seems to assume that the rationale for public libraries need not seriously be questioned.
Others have examined the grounds for public provision and found them wanting.5 Pfister and Milliman (1970) took
this position in their exploratory cost-benefit study of public libraries. Their study has good summaries of previous surveys on library users, and a good discussion of the library profession's position on library provision. Their data are
limited to Indiana libraries and their analysis is essen-tially descriptive.
Haynes Goddard (1973) has made a cost-benefit analysis of the same Indiana libraries. He concludes,as do Pfister and Milliman, that there are economies of scale in the produc-tion of library circulaproduc-tion. This conclusion applies to
Indiana libraries, most of which are very small (only eight percent serve populations of 50,000 or more). These studies will be considered again in Chapter Three.
Finally, Newhouse and Alexander (1972) developed a book-selection model in their analysis of the Beverly Hills, California public library. They too consider the rationale
for public libraries, but maintain a neutral stance.
4
See Appendix A of this chapter in which Baumol's data are discussed.
5
Herbert (1962) is a strong opponent of free public libraries in the United Kingdom.
The present study used a national sample of public libraries supplemented by socio-demographic data on local communities (See Appendix A for a description of the data) and considers both demand and supply sides of the library system.
II. The Public Library Model
This section presents a simplifed exposition of the model of public libraries developed in the thesis. The object of this presentation is to show the causal structure of the model and the relationships among the parts of the model.
The model consists of a local government expendi-ture function, an individual demand function, a quality production function, and input equations. The unit of observation for the model is the local community. There are five endogenous variables:
y = local expenditure on public libraries, per capita (pc)
y2 = circulation pc
y3 = "quality" of library
y4 = additions pc y5 = staff pc
The "quality" of a public library is an unobservable variable. However, it is a function of other variables which can be measured. When quality appears as an explanatory vari-able in the simplified model below and in the actual estimation, the observable variables upon which quality depends will be sub-stituted for it.
The exogenous or predetermined variables are:
x = average family income
x3 = federal government aid for public libraries pc x4 = state government aid for public libraries pc x5 = wage rate for library staff
x6 = stock of books pc.
There are other exogenous variables used in the actual esti-mated equations, but no additional endogenous variables. An equation explaining stock could be included in the model. The analysis which follows could be expanded to include more variables without changing any of the conclusions.
The structural equations of the model are: Local Government Expenditure Function:
(1) y1 + 12X1 + 13X2 +
1 4X3 + 15X4 = U Individual Demand Function:
(2) y2 + 22X1 + 23X2 + 24Y3 = U2 Quality Production Function:
(3) y3 + 3 1y4 + 33 2y5 + 33X6 = U3
Input Demand Functions: (4) y4 + 41X5 + 4 2y1 = U4 (5) y5 + 51X5 + 5 2y1 = U5
Equation (1) shows that local per capita expenditure for public libraries (yl) depends on individual characteristics such as income (x 1) and education (x2) and external factors such as government aid (x3 and x4). The particular specifica-tion of the relaspecifica-tionship depends on the voting model chosen. In Chapter Two alternative models are discussed. Empirical analysis using equations similar to (1) above allows testing
the median preference model against a more general pressure group hypothesis (See Chapter Two for an explanation of these models.)
Individual use of the library can be analyzed using per capita circulation. This individual demand is to be distinguished from voter demand for provision of library services (equation (1) ). As equation (2) shows, such individual demand for public library services depends on characteristics of the individual and on the local level of library quality (y3). This sensitivity to quality is
a characteristic of any good for which there are differences in quality. For all such goods, and at any price, individual demand would vary depending on that quality. It is not
possible to measure library quality ( (y3) in the model)
directly. However, equation (3) shows that library quality is a function of measurable inputs. Substituting equation
(3) for y3 in equation (2), an estimable demand function is
derived which uses input measures as a method for measuring quality:
(2') y2 + 22X1 + 23X2 + 24 ( 3 1y 4 - 32Y5 - 3 3X6) = U2 - 24U3'
These input measures are not to be thought of as
producing circulation." They are rather a method of measur-ing sensitivity of circulation to quality. Their coefficients in equation (2') are composites of the effect of quality on
demand ( 24) and of the contributions of the inputs to quality (f3 1 and f3 2). The coefficients of the other
explanatory variables in the final equation (2') can be estimated directly. Their coefficients are pure demand effects and not composites.
Staff and new book inputs are endogenous variables. Equations (4) and (5) show that input demands depend on the library budget (yl) and on the wage rate (x5). The
existing stock of books could be included as well. The price of books does not vary because the book market is a national one. Although equations (4) and (5) have not been estimated, this does not affect the estimation of equations
(1) and (2') which are the interesting parts of the model. There are four equations in the final model: (1), (2'), (4) and (5). The discussion above has shown why pro-duction variables can enter the demand equation. Both
equations (1) and (2') can be estimated and correspond to the actual equations estimated in Chapters 2 and 4 of the thesis. 6
Chapter 2 analyzes the local government expenditure function represented in this simplified model by equation (1).
6
Equations (1) and (2') satisfy the necessary and sufficient rank condition for identifiability. Although x5 was not actually used in the estimation, in equation (1) and in the actual estimation there are other exogenous variables (such as x3 and x4) which act as instruments for the endogenous variables. Estimation with instrumental variables using such instruments will be consistent although not as efficient as TSLS which would use all the excluded exogenous variables including
This equation represents a simplified attempt to model a community's decision to provide for a public library
service. This can be interpreted as the voters' demand for provision of a library service. In Chapter Two, which
elaborates the theory of equation (1), different models are considered. The simplest model for explaining voter support of a public library service is the median preference model and the simplest expression of that model is to use the
median income voter. The median voter model works best when the local budget allocation is viewed as a single decision. For a particular service and for a small service, like
libraries, used by a minority of the population, it seems desirable to go beyond the simple model and to include other
socio-economic variables that a priori should be important. Chapter Two also looks particularly at the influence of intergovernmental aid on locally financed expenditure. While state and federal aid is a small part of the library budget (less than 10 percent), it is an important potential policy variable. It is important to know how sensitive local
communities are to such incentives.
Chapter Three digresses from the analysis of public library demand. This chapter is concerned with library costs. Cost functions using both circulation and size of stock as scale measures are estimated. An important question with policy implications, the existence of economies of scale, is examined in detail.
The model returns to individual demand for public library services in Chapter Four. The theory of this
chapter is based on equation (2') of the simplified model. Equation (2') is concerned with demand for use of the public library service as distinct from provision.
While there are a priori reasons to expect the two relation-ships to have similarities, there is no reason to expect them to be the same. The ability to analyze these two aspects of demand for libraries is a significant improve-ment over most studies of public services which are limited to the first analysis, expenditure on that service, and on production processes.
In this chapter particular interest is focused on the socio-economic profile of users and a comparison of socio-economic characteristics which are important in
expenditure for services with those which are important for use of services. This chapter also includes a discussion
of consumer search behavior as it applies to public libraries. In addition to the estimation of empirical functions, the thesis considers several questions of policy interest. The most important of these is the examination of the
principle of free access to public library services. The possibility of user charges is suggested, and different
methods of imposing charges are considered. The influence of intergovernmental aid on the level of expenditure is examined. Other potentially important developments are the introduction
of technical improvements in library technology and the move toward more centralization with the development of regional library systems. Whenever results bear on these questions, the implications are sketched out.
Appendix 1-A THE DATA
The data on libraries that are used in this study are based on a survey conducted by the United States Office of Education of public libraries serving areas with at
least 25,000 inhabitants for the year 1968.7 Ninety-three percent, or 1057 libraries responded to the questionnaire. These libraries include both local, i.e., community, and county libraries. Although in some respects, such as in-ternal resource allocation, the two types of library might behave in a similar manner, in other respects, such as
lib-rary budget determination, their economic models should differ. Therefore it is important to study them sepa-rately. The analysis in this thesis is directed only to the local public libraries.
From the total of 1057 reporting libraries, those libraries serving individual communities were identified.
Since the library survey did not include any data on the com-munities served by the libraries, socio-economic information
on the localities, as well as revenue and expenditure data, were drawn from the 1967 County and City Data Book. It was
possible to collate the public library data and the community A summary of this survey is contained in Office of Education (1970). I am grateful to the Office of Education for making available a computer tape of the data.
I am grateful to the Harvard Institute of Economic Research
data in 371 cases, which comprise the final sample used throughout the thesis. This was done by verifying that the public library data and the city data referred to the same population. The reporting libraries had been asked to use
the 1960 Census of Population figure in reporting the popula-tion served. Since this is the same figure used in the 1967 County and City Data book, there was little ambiguity in de-termining the sample.
The sample which resulted from this procedure in-cludes 36 states. Georgia did not respond to the original sample; other states are missing from the final sample be-cause the libraries all seemed to be county libraries. Finally some states are not included because libraries in those states apparently serve more than one community.9
There was a tendency for omitted states to be from the South. However the final sample does include 6 Southern states.
Very large metropolitan libraries are underrepre-sented in the final sample, probably because they continued to report their data according to library systems. For the United States as a whole 285 or 25 percent of the libraries
served communities with population between 25,000 and 34,999;
9
Previous Office of Education surveys had used library sys-tems rather than the independent, locally autonomous library as the reporting unit. The survey report noted that some data continued to be reported for library systems.
271 or 24 percent served populations between 35,000 and 49,999; 335 or 30 percent served populations between 50,000 and 99,999; 206 or 18 percent served populations between 100,000 and 499,999; and 38 served populations of 500,000 or more. The corresponding proportions for the sample used in
the thesis are: 98 or 26 percent (25,000-34,999); 95 or 25 percent (35,000-49,999); 103 or 28 percent (50,000-99,999); 58 or 16 percent (100,000-499,999); and 13 or 4 percent
(500,000 or more). Frequently separate regressions were es-timated for population subgroups.
Table A-1 defines the variables used in the model and gives the sample means, variances, maximum values and minimum values. When a variable definition is followed by NR, this means that not all libraries provided this
informa-tion. This does not mean that the variables were not included in the statistical analysis but that when such variables were used the sample had to be limited to those libraries which did respond.
The variable for the number of branches is known to contain errors. This occurred because the survey question-naire did not distinguish between main library and branch libraries. The count for "Central Library and Branches" was made by adding one to the number of branches reported. This was the procedure used by the Office of Education and was
Variable Definitions Library Data Variable Name Population Branches* Additions Stock Circulation Staff Budget Definition Population of area served, based on 1960 census.
Central library and branch libraries. Number of volumes added during fiscal year, 1968.
Total number of volumes held at end of fiscal year.
Total number of loan transactions of all printed and audio-visual materials during year.
Total library staff, in full-time
equivalents.
Operating receipts during the fiscal year. Sample Mean 124070 4.39 17939 222190 588540 6.16 454300 Standard Deviation 322830 7.86 41286 460000 1037200 14.44 992240 Minimum 25000 1.0 1143 16079 34634 .40 24350 Maximum 3550400 63.0 393210 3949600 9708800 133.40 9746600
Variable Name Local State* LSCA* Total Expenditure Book Expenditure Definition Operating receipts from the local government.
Operating receipts from the state government.
Operating receipts from federal govern-ment, under Library Services and
Con-struction Act. Operating expendi-ture during the fiscal year. Expenditure on
books during fiscal year. Mean 459400 34439 15982 464100 70530 Deviation 1080800 158650 46318 1060800 173420
Data on Local Community** Land area, square
miles, 1960. Increase* Nonwhite* Percentage popula-tion increase 1950-1960 89.60 Percentage nonwhite 1960. 7.44 646.70 -33.3 12176 .1 57.5 Minimum 15000 0 Maximum 8762400 1605100 366600 0 Area 9736300 23355 1460 K) 1700500 24.493 44.46 1 455 9.99
Variable Name Median Age Youth Old Median Education Low Education High Education School Median Income Low Income Definition Median age of population. Percentage of popu-lation under 18 years. Percentage of popu-lation 65 years and over.
Median years of edu-cation completed for persons 25 years and over.
Percentage of adults with less than 5 years of education.
Percentage of adults with 12 or more years or education
Persons 5 to 35 years old enrolled in school. Median family income in 1959.
Percentage of fami-lies with income under $3,000. Sample Mean 30.98 34.00 9.68 Standard Deviation 4.63 4.91 3.57 11.18 6.08 46.57 28261 6471.2 14.40 1.18 4.08 11.8 69722 1351.6 6.65 Minimum 20.1 13.4 2.0 8.4 Maximum 54 48.4 28.2 15.8 N) K)j .3 19.4 5539 3755 3.30 30.0 89.0 754650 13933 40.50
Variable Name High Income Revenue* Tax* Property Tax* Total Expenditure Educational Expenditure* Public Welfare Expenditure* Parks Expenditure* Definition Percentage of fami-lies with income $10,000 and over. Total city govern-ment revenue, in thousands.
Total tax revenue, in thousands,
Property tax revenue, in thousands.
Total city govern-ment expenditure, in thousands. Local expenditure on education, in thousands. Local expenditure on public welfare, in thousands. Local expenditure on parks and recreation, in thousands. Mean 18.92 16709 10194 7786 16741 2434 1061 935 Deviation 10.00 43664 27322 18970 41697 6726 5044 2540
* Data for variables marked with an asterisk have some missing observations. The mean and other sample characteristics for each such variable refer to the full sample of respondents for that variable.
Minimum 4.8 788 218 96 774 Maximum 68.4 415220 298190 189370 401030 0 0 0 K) UJ 84921 56630 26026
followed in this analysis. To the extent that the libraries had already counted the main library among their branches, the number of library outlets is overstated. The data do not include any information on the number of hours during which the library is open, and thus equal weight is given to all branches, although branches frequently have limited hours of service.1 0
The variable which is used for library circulation is very broad and includes all printed and audiovisual
materials. The photo-charging systems used by many libraries do not allow fine distinctions between different types of material circulated. This is a serious gap in the data, but
it is not clear how libraries can be motivated to introduce a method of making such distinctions. Photo-charging systems also make it very difficult to record the frequency of circu-lation of individual books.
The other variables seem to be free of serious errors or inadequacies. Some libraries did not adequately break
down their expenditure data. Thus it was not possible to study factor costs in great detail, although in principle the survey collected detailed wage and material costs. Some variables have a large number of missing observations. This did not
1 0
Southern library systems were segregated until the middle of the twentieth century. Location patterns inherited from this period may have effects on current use patterns.
pose any problems except that the number of degrees of freedom was sometimes considerably reduced in going from one specification of an equation to another.
There is a separate question of the data one would wish to have for a study of this sort. The most obvious deficiency in the data which are being collected now is that distinctions are not made between different library services. No separate data are being collected for adult and juvenile services, although it is possible for modern photocharging systems to be coded for such obvious dis-tinctions. Previous Office of Education surveys did separate adult and juvenile circulation. The data would be improved greatly by a return to that classification system. Similarly no distinctions are made among books, magazines, records and other audiovisual materials. There is no national data collection on reference services, either in the provision or use of these services. There is no
information on the organizational structure of libraries, such as number of division heads or budget allocation among divisions.
Despite such omissions in the Office of Education Survey, it does seem to provide the best available data on public libraries. Previous surveys were made by the Office of Education but the reporting units and information
collected did not appear to be sufficiently comparable to warrant using these surveys.
Other studies have used state data and data on individual libraries. The only previous use of the Office of Education Survey material was used in a study by
Mathematica for the National Advisory Commission on Li-braries (Baumol et al., 1969). It used aggregate national data from the annual reports of public library statistics by the Office of Education (along with other data sources for other types of library), but the authors note: "Many of our time series were completely discredited when we were informed ... that the statistics were averages in which any cost figures that had not been reported were taken to be zero!" (Baumol et al., 1969, p.169).
It was hoped that the demand statistics could be supplemented by the data from a national poll conducted by the Gallup organization for the National Advisory Commission on Libraries. However, the data had been destroyed after a few years and were unavailable at the time of this analysis.
Appendix 1-B
LIBRARIES AND COPYRIGHT
An important welfare consideration is the relation between public libraries and copyright provisions. There
are two separate questions. First, should copyright pro-tection extend to the public library's lending service? Second, how will technological changes in library storage and retrieval systems be consistent with copyright pro-tection?
The grounds for having a copyright system are analogous to those for a patent system, although since copyrighted works are not a productive resource so much as a final output, certain arguments are weakened and others are inapplicable.1 1
The argument is basically that without copyright legislation there will be underinvestment in creative pro-duction. With appropriate copyright protection, the supply
of creative effort will increase. In the context of patents Arrow (1962) has argued that underproduction continues to be a problem even with legal protection of property rights because of the inherent risk in invention, the imperfect
1 1There is a large economic literature on patents.
See es-pecially Arrow (1962), Hirshleifer (1973), and Machlup
appropriability of the patent system, and the inability of royalty schemes to capture all the benefits. These argu-ments all apply with equal strength to copyrights. Indeed
the actual copyright protection is less strong than patent protection, so the degree of underproduction may be greater.
The conclusion to be drawn from these arguments is that in order to stimulate creative effort, some kind of a monopoly rent structure must be devised. However such copyright systems lead to inefficiency in the use of the resulting product. By its very nature, information, once produced, has zero marginal cost. Optimum utiliza-tion of informautiliza-tion requires zero charge.
Another problem inherent in the copyright system is that of determining the supply of creative effort under any particular scheme. This is important for setting both the degree of protection and the length of life of the copy-right. Some of the resulting supply would have been pro-duced without the protection, the remainder would not have been. The inefficiency resulting from the copyright pro-tection in the use of the first type of supply must be
balanced against the gain from the production of the second type of supply.
Libraries affect this basic copyright issue in three ways. The existence of lending libraries makes the
appropriability of the benefits from the books even less perfect because of multiple lending. Thus they contribute toward underproduction. Secondly, they cause redistribu-tion toward borrowers from buyers. The existing copyright protection does provide some remuneration to authors and thus does stimulate some of the existing production. This cost is borne almost wholly by book purchasers. The cost of books could be lower if authors' royalties were borne by all readers. Libraries can also stimulate production; without library sales many books would not be profitable to produce. This is especially true for scientific books.
The system might be changed in various ways. Direct fees for particular books could be collected and contributed toward a national royalty pool, which itself could have various methods of distributing royalties to
individual authors.12 Alternatively, a charge could be
made for being a registered borrower. This would be simpler administratively but would introduce distortions. New bor-rowers, uncertain of their potential gains from the use of the library, might be discouraged from joining. The method chosen would depend on whether the library had user fees
in general.
Automatic storage and retrieval systems and elec-tronic reproduction raise further copyright problems. The
12This is the system used in Sweden and advocated by Herbert (1962).
existence of such systems would allow libraries to consoli-date their holdings, particularly of books which circulate infrequently, and thus to improve library efficiency. How-ever, when copies are made there is a clear possibility of copyright infringement. It is difficult to establish when copying falls under "fair use" provisions which have ap-plied to occasional copying in the past and when it is a violation. Until now the courts have ruled in favor of
libraries but the potential magnitude of the problem is only beginning to be apparent. Journals particularly are arguing for the necessity of protection against reproduc-tion in order to ensure their own survival. Specific
regu-lations need to be developed so that determination of in-fringements need not be arbitrary.
Chapter 2.
LOCAL LIBRARY EXPENDITURES
There are two aspects of the demand for local
public services: the demand for the provision of services and the demand for the use of services. In general,
pub-lic expenditure studies have examined only the first of these aspects. The model of public libraries developed in this thesis includes both types of demand. The demand for provision of public library services is analyzed in this chapter. More specifically, this chapter estimates the determination of library budgets. The use of public library services will be studied in Chapter 4, "The Demand for Public Library Services."
The determination of the library budget is one part of a general local budget allocation process. Al-though the approach here will be to view library budgets as a collective community decision, the model will be re-lated to recent studies which evaluate local expenditures
The public library is generally supported by the local community, although library districts and intercommunity libraries are not uncommon. County libraries, which should follow a different budgetary pattern, are excluded from the sample.
in the theoretical framework of individual demand. Section I describes alternative models of local political choice and discusses previous local expenditure studies, with emphasis on recent studies of "shared goods." Section-II develops the model used in this chapter. A major objec-tive in local expenditure studies has been the estimation of the influence of intergovernmental aid. Public libra-ries receive aid from both state and federal levels. The estimation will include an examination of the influence of this aid. Section III presents the results of esti-mating the demand for provision of public libraries.
Average per capita expenditure on the public
libraries in this study in 1968 was about $4.30, 90 percent of which is locally financed. This represents only about
1 percent of the local budget. Although public libraries serving populations of 25,000 or more constitute a small proportion of all libraries in the United States,2 they
receive the bulk of the expenditure on libraries and serve the great majority of the population. Total public library income in 1968 was $698 million (Ennis, 1972). Total
2
In 1960 there were 8,190 public libraries, more than half of which served populations less than 5,000, and only
three percent of which served populations greater than 100,000 (Winger, 1963).
operating income for public libraries serving populations of 25,000 or more was $432 million. Capital income for these libraries was $66.8 million. Furthermore the clear direction of public policy is toward developing systems which will serve larger populations. The influence of
in-tergovernmental aid may be of particular interest as higher government levels encourage local communities to combine into systems.
I. Models of Political Choice
The theoretical literature on public goods is well known. The central concept in the demand for public goods is the problem of revealing individual preferences in the context of voting for public provision of goods and services. Perhaps because of the difficulty of resolving this problem, the empirical literature on local expendi-tures until recently did not attempt to incorporate in-dividual demand theory explicitly. Instead, the emphasis has been on determining the influence of intergovernmental aid on local expenditures. However, individual demand theory has implicitly determined the choice of explanatory variables. Income variables have always been included, as well as measures of the influence of intergovernmental aid.3
Recent studies, particularly those of Bergstrom and Goodman, (1973) and Borcherding and Deacon, (1972) have tried to be more explicit in their use of individual demand theory and have drawn on the median preference model de-veloped by Bowen (1943) and associated with later works by Downs (1957) and others. This model shows that under
majority rule the quantity of public services supplied
3
These studies are critically summarized in Inman (1974) and Oates (1972).
will be equal to the median of the quantities demanded. Bergstrom, Goodman, Borcherding and Deacon also assume that median voter preferences can be approximated by the preferences of the citizen with median income.
Using this approximation, they attempt to esti-mate the demand function for this median income individual. Both studies use a measure of tax share as a price proxy and both omit any measure of the price influence of inter-governmental aid. Although both studies criticize the ad hoc nature of the choice of variables in previous expendi-ture studies, both find it useful to include in the esti-mation variables which are not properly part of an in-dividual demand function. Borcherding and Deacon
acknowl-edge that their price variable is probably not a good
approximation because of the omission of intergovernmental aid.
An alternative to the median preference model concentrates on the preferences of local decision-makers.
Inman (1974) calls his version of this the entrepreneurial model and assumes that budgets are determined by the inter-action of political leaders' preferences and bureaucrats' preferences. Inman also emphasizes the importance of es-timating the relation between expenditure and use of public services.
A final model is the incremental budget model used by Davis, Dempster and Wildavsky (1966). In a study of federal budgets, they found that each year's budget
(Bt) is determined mainly by a linear function of the budget of the previous year (Bt-l ). The function is of the form: Bt = 1 + c Bt-,, where c is a bureau-specific mark-up.
Pressure groups have been studied in the norma-tive theory of public choice (Steiner, 1974) but empirical models have not used this approach. The hypothesis that
local decision-makers respond to varying pressures from different groups and that these pressures vary with the public service under consideration is appealing because it combines the median voter and the entrepreneurial models without the restrictions of the median income hypothesis.
The analysis in this thesis will compare the median voter model and a combination of the pressure group concept and
II. The Library Budget Model
The median preference model applies best when determination of the local budget level is viewed as a single decision. When the budget is divided into several subcategories, the possibility of coalitions among groups of interested voters weakens the applicability of the median preference hypothesis. Even if decision-makers do respond to median preferences, the identification of
median preferences with median income is unlikely to be correct for any given public service, and particularly for a service like libraries, which are used by a minority of the population.
The model to be developed here assumes merely that decision-makers maximize some weighted function of individual preferences. The weights on individuals or groups of individuals reflect the influential pressure groups in the community. The actual estimates which are derived later in the chapter can be used to develop a pat-tern of the pressure groups to which the decision-makers respond and to compare the pressure group hypothesis with the median voter model. The model also incorporates the incremental budget assumption. The model can be referred to as the pressure-group-incremental-budget model.
The decision-makers wish to maximize
W = W(u., .... , u ) (2.1)
Q
B.Q.
* B. qi q Figure laQ
1~q Figure lbwhere W is the social welfare and the u. refer to the in-dividual utility functions. The individual's desired level of library expenditure depends on his expected use of the library, as well as on the usual price, income, and taste variables. Unlike some public services such as sanitation and like others such as police protection, there may be con-siderable variation in individual use of the library service. Expected use is not simply a matter of tastes but depends on the production process. Greater expenditure does not neces-sarily imply greater potential use but rather use depends on how the expenditure is translated into services.4
In the production of the service there is a trade-off between quantity and quality. Figure 1 shows a simpli-fication of this trade-off by assuming that there is a single dimension for both quantity (Q) and quality (q). For any budget level, B., the library will choose a particular quan-tity/quality package. An expansion curve can be derived showing the relationship between the library budget and the service package. Figure la shows an indifference curve be-tween quality and quantity (Qq) and a production possibility curve (B.B.). The point of tangency between the two curves
S1
B is one point on the expansion curve relating the library's budget to quantity and quality.
4
Individual use will be related to library inputs directly in Chapter 4.
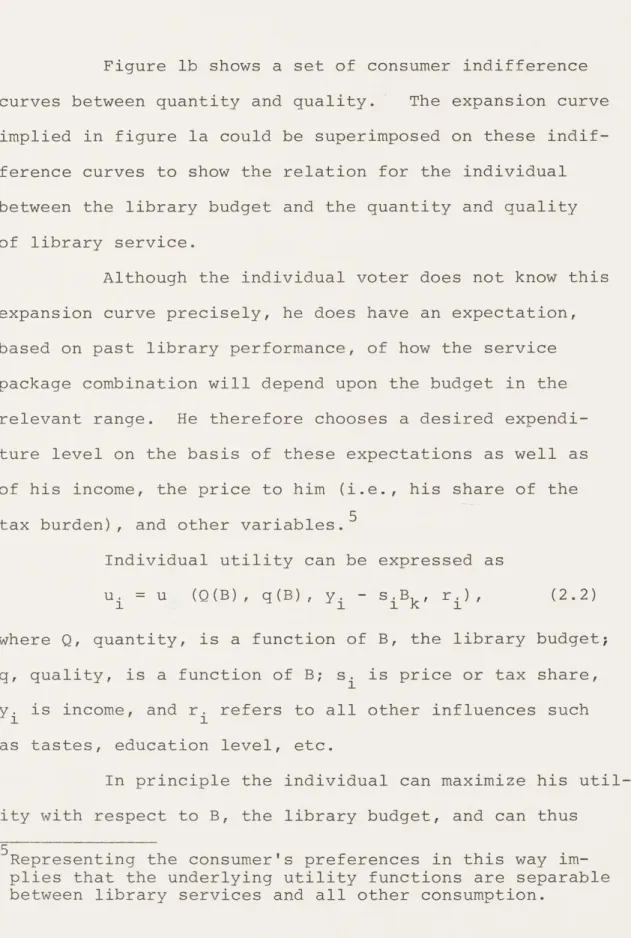
Figure lb shows a set of consumer indifference curves between quantity and quality. The expansion curve implied in figure la could be superimposed on these indif-ference curves to show the relation for the individual between the library budget and the quantity and quality of library service.
Although the individual voter does not know this expansion curve precisely, he does have an expectation, based on past library performance, of how the service package combination will depend upon the budget in the relevant range. He therefore chooses a desired expendi-ture level on the basis of these expectations as well as of his income, the price to him (i.e., his share of the tax burden), and other variables.5
Individual utility can be expressed as
u. = u (Q(B), q(B), y, - s .B , r), (2.2) Si k 1
where Q, quantity, is a function of B, the library budget; q, quality, is a function of B; s. is price or tax share, y. is income, and r. refers to all other influences such
as tastes, education level, etc.
In principle the individual can maximize his util-ity with respect to B, the library budget, and can thus
5Representing the consumer's preferences in this way im-plies that the underlying utility functions are separable between library services and all other consumption.
choose a unique level of expenditure for which to vote or
exert his influence.
When individual demands are aggregated, the pressure-group-incremental-budget model would represent local own expenditure per capita as a function of price variables, income variables, tastes, and related expendi-tures:
L = L (p, Go, t, y, Ed, Exp), (2.3) where p is the price implied by matching aid, G0 is per
capita exogenous aid, t is some measure of the tax struc-ture, y may be median family income or proportions in various income groups, Ed may be median education or pro-portions in different education groups, and Exp refers to related expenditures (which are endogenous themselves).
One further point about the local population should be noted. The model employed here assumes that only large budget items, such as schools, influence the individual decision process for choosing a local community. Since the population is not mobile with respect to minor expenditures, the determination of the library budget will not involve simultaneity with the determination of the rele-vant local population. Thus the Tiebout hypothesis that the local population is itself endogenous is not relevant
however, will be interdependent. Indeed, in principle the amount of the local budget allocated to the public library depends on the prices of all other community expenditure items, as well as on the price of library service, com-munity income and comcom-munity tastes.
Before describing the actual estimation of the equation, the nature and measurement of specific variables will be discussed.
The cost to the local community of any public service is influenced by intergovernmental aid.6 A careful specification of this influence is important for analyzing how state and local governments can affect library service. Intergovernmental payments for libraries to governments may be block grants or matching grants. Block grants are usually based on population or per capita income. They are exogenous to the individual community and thus may have an income effect on local spending but no price effect. With matching grants the higher government level pays a certain
share of each dollar of expenditure, usually beyond some
6
Resource prices are assumed to be constant across libraries. The market for books is clearly national. Professional
librarians are probably mobile; if nonprofessional labor is also mobile, then it will be true that labor and capital costs are approximately constant. The estimation assumes
that labor is sufficiently mobile to justify ignoring inter-community differences in factor prices.
minimum level. If there is a maximum amount to the grant, it is called a closed-end matching grant; otherwise it is open-end. Open-end matching grants always reduce the net purchase price (to 1-m where m is the matching rate) and thus there is always a price effect. Closed-end matching may or may not have a price effect. If the local community expenditure exceeds the maximum of the grant, it is clear that the price effect is not operational at the margin. If the community spends less than the maximum there is a net reduction in the price of additional units of the service.
Libraries receive aid from both state and federal levels. Although many states have matching arrangements, examination of the actual data strongly suggests that the grants are closed-end and that most libraries are receiving the maximum amount of aid.7 Because of the small number of observations for which a price variable seems important, all state aid was assumed to be unconditional for the estimation.8
7
This conclusion is based on the information contained in State Payments to Local Government, 1967, Census of Governments
(U.S. Bureau of the Census, 1968) and in the basic library data.
If there is some element of matching, the state aid coefficient
is biased as a measure of the importance of nonmatched funds but does allow some interpretation of the possible price effects. To see how the coefficient can be interpreted if there are some state matching grants, assume that all inter-governmental aid is from the state government to local govern-ments. Then total local expenditure (E) is equal to the sum of local own expenditure (L), and state aid (S = S0 + m5 E):
(a) Ei = L + S., for community i.
To know the true influence of state aid both block (S0) and
matching (changes in the value of mn), the relation which should be estimated is:
8 (continued)
n
(b) L. = a0 + a S + a2 (1-m) + Z a. X. + e,
1 1 Oi 2j=B '
where the X's refer to other variables. Instead, because it is impossible to derive the net price of state aid, the estimated equation is:
n
(c) L. = B + B S. + Z B.. X..
1 0 1 i 2 1 1]
If state aid for libraries is all in the form of block
grants, the two equations are equivalent. If aid is purely on a matching basis and the estimated effect of total aid on local own expenditure (L) is negative (as will be shown to be the case in the next section) then the price elasticity must be less than one.
This can be shown most easily for the case where expenditure depends only on price and not on any X's as in Equation b. The price of library services to the community implied by the matching rate is the ratio of local
expenditure of own funds (L) to the total amount of library expenditure (E = L + S): p = L/E. With a constant price elasticity demand funtion,
-a
(d) E = k p-, where a > 0. This implies that
(e) pE = k pl a
or, since p = L/E that
1-a
(f) L = k p
It is clear from this equation that if p and L vary in the same direction, a must be less than one. Thus, if a higher matching rate (that is, a lower price) implies less local
own expenditure, the price elasticity must be less than one. If the estimated equation is misspecified and uses S instead of m5 as an explanatory variable, the sign of the true
coefficient depends on the regression of the omitted vari-able on the included varivari-ables. Since S =( mS L, a higher
value of S must imply either a higher L or a higher m5 or both. A higher value of S due to a higher L must imply a
In 1968 federal funds (F) based on the Library Services and Construction Act (LSCA) were determined ac-cording to a formula based on state population and income, and with certain minimum expenditure requirements. Federal funds for those states which qualified varied between a 33 percent minimum matching rate and a maximum of 66 per-cent. Without detailed information on state formulas and pass-through arrangements to the local communities, it is impossible to derive a price variable for federal payments. Although these funds may be endogenous to the states, it
is likely that they are considered exogenous by individual communities. Thus the dollar amount of federal funds is used in the budget equation.9
8 (continued)
positive coefficient on S in the regression of L on S. Thus a negative coefficient on S must be due to an inverse relation between m5 and L. A negative coefficient of S therefore implies that a higher value of m5 is associated with a lower value of L, or equivalently, that a lower price is associated with less local expenditure and thus an absolute price elasticity less than one. In this example expenditure was assumed to depend only on prices and all aid was assumed to be conditional. In fact aid is often mixed and other variables do enter.
9The estimates in the next section show a positive effect of federal aid on local expenditure. It is therefore not possible to establish a bound on the magnitude of the price elasticity as it was for the state aid.