HAL Id: hal-01402794
https://hal.archives-ouvertes.fr/hal-01402794
Submitted on 25 Nov 2016
HAL is a multi-disciplinary open access
archive for the deposit and dissemination of
sci-entific research documents, whether they are
pub-lished or not. The documents may come from
teaching and research institutions in France or
abroad, or from public or private research centers.
L’archive ouverte pluridisciplinaire HAL, est
destinée au dépôt et à la diffusion de documents
scientifiques de niveau recherche, publiés ou non,
émanant des établissements d’enseignement et de
recherche français ou étrangers, des laboratoires
publics ou privés.
Saugat Bhattacharyya, Maureen Clerc, Mitsuhiro Hayashibe
To cite this version:
Saugat Bhattacharyya, Maureen Clerc, Mitsuhiro Hayashibe. A Study on the Effect of Electrical
Stimulation During Motor Imagery Learning in Brain-Computer Interfacing. SMC: Systems, Man,
and Cybernetics, Oct 2016, Budapest, Hungary. pp.2840-2845, �10.1109/SMC.2016.7844670�.
�hal-01402794�
A Study on the Effect of Electrical Stimulation
During Motor Imagery Learning in Brain-Computer
Interfacing
Saugat Bhattacharyya, Maureen Clerc and Mitsuhiro Hayashibe
Abstract—Functional Electrical Stimulation (FES) stimulates the affected region of the human body thus providing a neu-roprosthetic interface to non-recovered muscle groups. FES in combination with Brain-computer interfacing (BCI) has a wide scope in rehabilitation because this system can directly link the cerebral motor intention of the users with its corresponding peripheral mucle activations. Such a rehabilitative system would contribute to improve the cortical and peripheral learning and thus, improve the recovery time of the patients. In this paper, we examine the effect of electrical stimulation by FES on the electroencephalography (EEG) during learning of a motor imagery task. The subjects are asked to perform four motor imagery tasks over six sessions and the features from the EEG are extracted using common spatial algorithm and decoded using linear discriminant analysis classifier. Feedback is provided in form of a visual medium and electrical stimulation representing the distance of the features from the hyperplane. Results suggest a significant improvement in the classification accuracy when the subject was induced with electrical stimulation along with visual feedback as compared to the standard visual one.
Index Terms—Neuro-feedback, Functional Electrical Stimu-lation, Brain-Computer Interfacing, Common Spatial Patterns, Electroencephalography.
I. INTRODUCTION
The advent of Brain-computer interfacing (BCI) has opened a direct communication pathway between the brain and a peripheral device in form of robots, prosthesis, wheelchair or a computer without any muscle intervention. BCI has immense potential in facilitating rehabilitation for patients suffering from stroke, amyotrophic lateral sclerosis, spinal injury and physical disability [1]. A BCI system would drive a neuropros-thetic device to bridge the gap between the central nerveous system and peripheric muscles, and in some instances even a separate prosthesis. Electroencephalography (EEG) is the most commonly used BCI recording device and signals related to limb movement (known as motor imagery signals) are elicited as Event Related Desynchonization/Synchronization (ERD/ERS) response [2],[3]. The BCI system decodes the ERD/ERS signals to determine the movement as intended by the user.
Functional Electrical Stimulation (FES) [4],[5] aims at directly stimulating the muscles which the patient is no longer
Saugat Bhattacharyya and Mitsuhiro Hayashibe are with BCI-LIFT project, CAMIN team, INRIA-LIRMM, University of Montpellier, Montpellier, France. e-mail: [email protected], e-mail: [email protected]
Maureen Clerc is with Universit´e Cˆote d’Azur, Inria, France (BCI-LIFT project, Athena team, Inria Sophia Antipolis-M´editerran´ee, 06902 Sophia Antipolis).
able to use and it is reported that FES is capable of recon-structing certain daily life skills [6]. Studies in [6],[7],[8],[9] have shown that FES is capable of eliciting the recovery of skills such as standing up, grasping, cycling and walking. Most FES based rehabilitative system do not employ the cortical activity of the patient and only use peripheral learning to re-train the subject on his/her daily skills. A hypothesis on augmented movement therapy by FES exists which assumes that recovery occurs mostly due to cortical plasticity and partly due to peripheral mechanism [10] and it has been confirmed on motor learning tasks involving transcranial magnetic stim-ulation [11],[12] and functional magnetic resonance imaging [13].
Improvement in functional recovery through cortical plas-ticity can be attained if a coherence between the efferent neural activity (intentional efforts) and afferent neural activity (peripheral efforts) is developed. In this regard the FES acti-vates the sensory channel which provides a maximal afferent inflow to the brain and the BCI would provide an efferent outflow of motor commands to close the motor loop [14], [15]. Thus, the rehabilitative system would work to improve the cortical and peripheral learning of the subject. Recently certain groups have explored this potential in implementing BCI in functional recovery using FES [16],[17],[18] to directly link the mental intention of the user with the muscular response. In such system, the BCI detects the motor intentions of the user which in turn activates the FES device. Pfurtscheller et al. were the first to restore hand grasp in a single case study by combining BCI with FES transmitted via surface electrode in [19] and an implanted stimulation system in [20]. Muller et al.in [21] studied the affects of FES on ERD/ERS patterns during reconstruction of the motor activity. Some EEG/MEG studies in [18],[22] have shown the presence of ERD/ERS patterns during an FES induced hand or leg movement tasks. A few studies also exist on the effect of FES learning in the performance of the BCI system. Gollee et al. in [17] found no major influence of FES on Steady-State Visually Evoked Potential (SSVEP) signal. Takahashi et al. in [18] also found no effect of FES on leg stimulation. Pistohl et al. in [23] reported the improvement of angular accuracy of movements when the participants were provided with additional artificial proprioceptive feedback rather than using visual feedback but did not increase the overall accuracy determined from the average distance between the cursor and the target.
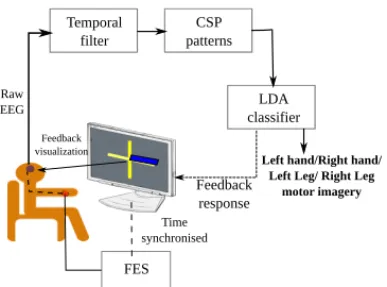
Temporal filter CSP patterns LDA classifier FES
Left hand/Right hand/ Left Leg/ Right Leg
motor imagery Time synchronised Feedback response Raw EEG Feedback visualization
Fig. 1. Block diagram of our experimental setup during motor imagery sessions where user stimuli is provided with conventional visual stimuli and electrical stimulation, respectively.
to the subject by means of a visual medium [24], [25]. On observing the feedback, the subject would attempt to perform his task. It is an interesting notion if one includes electrical stimulation to help in augmenting the performance of the motor task at hand. Thus, in this paper, we report the preliminary results of the effect of electrical stimulation on the learning of the subject during a motor imagery training task on healthy subjects. Through this study, we aim at employing FES as a proprioceptive feedback to the subject [26] to improve the learning of the subject both in terms of accuracy and time. If successful, this system can accelerate the motor recovery process of the patient by enhancing the motor learning in the brain.
The rest of the paper is organized as follows: Section II describes the details of the experiments performed and the analysis of the data. Section III presents the results of the experiments and the concluding remarks are provided in Section IV.
II. EXPERIMENTDESIGN
In this experiment the participants performed four motor tasks: left hand movement, right hand movement, left foot movement and right foot movement across 6 separate sessions. A session provides instructions to the participant through a sequence of visual cues to execute one of the four motor tasks and each visual cue is termed as ‘trial’. Further, for data analysis, each trial are separated into time windows, termed as epochs. Each session consists of a feedback session provided visually to the participant at each trial, quantified by the hyperplane distance of the decoder. Before the start of the experiment, the participants undergo a training session for decoder training and to acclimatize to the tasks. The training session is made of 160 trials (40 trials for each task). The first online experimental session consists of 40 trials (10 for each task) and the last two sessions consist of 160 trials (40 trials for each task). The decoder designed in this work is a 2-level hierarchy. The first 2-level classifies between left and right motor imagery and the second level discriminates between hand and foot motor imagery. In 3 of the 6 sessions, surface electrical stimulation (ES) is transmitted to the subject during
the feedback period to aid the participant in performing the task. Thus, in this paper, we named the ES induced sessions as FES sessions and the sessions with only visual feedback as VIS sessions. In this paper, we want to study the effect of ES on the learning of the participants while performing a motor task and compare it with the standard visual motor task. A simplified block diagram of the our experiment is illustrated in Fig. 1.
Three healthy male subjects (2 right handed and one left handed), participated in this experiment. In this experiment, we abide by the norms of Helsinki Declaration of 1975, revised in 2000. Prior to the experiments, the subjects are informed about the purpose of the experiment and the tasks they have to perform.
A. Materials used
The EEG signals are recorded using a 14 channel Emotiv Epoc neuro-headset with a sampling rate of 128Hz and an in-built band-pass filter of 0.2-45Hz. The electrodes: AF3, F7, F3, FC5, T7, P7, O1, O2, P8, T8, FC6, F4, F8 and AF4, are arranged on the basis of the standard 10-20 system [27].
Surface electrical stimulation is relayed to induce wrist flexion and foot plantar flexion by applying the stimulation to the anterior compartment of the forearm for hand tasks and the triceps surae muscle group for the foot tasks. It is applied to each side of the hand and the foot, corresponding to the mental task to perform. The stimulus is delivered by a computer-controlled stimulator (ProStim, MXM, France) with pulse width (PW) modulation [28](PW max = 400 us) at a constant amplitude and frequency (20 Hz). Each stimulation sequence consists of a trapezoidal envelope train of PW (0.4 s ramp-up, 1.2 s plateau, 0.4 s ramp-down).
B. Design of the visual cue
The design of the visual cue for both FES and VIS sessions are the same. Each session starts with a baseline period of 20 seconds, during which the subject is asked to relax, followed by a repetition of trials. Each trial has the following cues: First, a fixation ‘+’ is displayed on screen for 1 second which is an indicator for the subject to get ready for the task ahead. Next, instructions of the motor task to be performed are provided to the participant for 1 second in form of arrows, in two separate cues of 0.5 seconds duration each. First, a left or right arrow is displayed on screen to indicate left or right motor imagery, respectively followed by up and down arrow which correponds to hand and foot imagery, respectively. Following the instructions, the feedback is displayed on-screen, in the form of a blue bar, for 3 seconds. The subject starts performing the task on the start of this cue while simultaneously observing its feedback. For FES sessions, the ES is provided to the subjects at the onset of the feedback cue. For the training period, the feedback period of each trial is followed by a ‘+’ instead of the feedback bar. Lastly, a blank screen is displayed for 1.5s-3.5s for the participants to relax and avoid overlapping of the remnant EEG from the previous trial. A schematic time representation of the visual cue is illustrated in Fig. 2.
B
+
Time+
B 20s 1s 0.5s 0.5s 3s 1.5-3.5s Right imagery Left imagery Hand imagery Leg imageryFig. 2. A schematic time representation of the experimental task displayed to the participants.
C. Feature Extraction
Previous studies [1], [3], [29] on motor imagery suggests the presence of ERD/ERS in the µ-rhythm (8-12 Hz) and central β band (16-24 Hz). Thus, after acquisition, the raw EEG signal is band-pass filtered at 8-30 Hz using an IIR butterworth filter of order 5 and bandwidth of [8,30]Hz. This step removes the unwanted EEG information from the signal along with noise. Prior to feature extraction, the training data of the partic-ipants is used to train the common spatial patterns (CSP). CSP [30] decomposes the raw EEG signal into spatial patterns extracted from two classes of single trial EEG. The patterns maximize the variation between the two classes. CSP was first applied for detection of abnormalities in EEG, followed by discrimination of EEG movement patterns by Ramoser in [30]. The design of the CSP is based on the simultaneous diagonalization of two covariance matrices which creates new time series signals optimal for classification. For N channels of EEG for two classes, say, left and right imagery trials, the CSP algorithm creates an N × N projection matrix W [30]. W represents specific cortical activity during the motor tasks and with W , a trial X is decomposed by
Z = WX. (1) The variances for the two populations are largest in the first and last rows of Z and thus, in this work, we select the first and last 2 rows (4 spatial filters) of W. Thus, the EEG data X is filtered using the 4 spatial filters. Then, we calculate the variance of the 4 new time series for an epoch T
VARp=
Z t+T
t
(Zp(t))2dt. (2)
Lastly, the variances are normalized and log-transformed to generate 4 feature vectors.
fp= log VARp P4 p=1VARp ! . (3) In this work, two CSP trainers are implemented: one for left-right imagery and the other for hand-leg imagery and the size of the epoch T is 0.125 second.
D. Classification of the motor task
After feature extraction, the feature vectors are used as inputs to a linear discriminant analysis (LDA) classifier [31]. LDA aims at separating the data representing the different
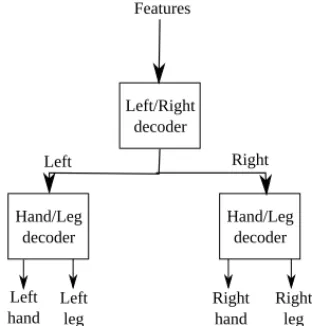
Left/Right decoder Hand/Leg decoder Hand/Leg decoder Features Left Right Left hand Left leg Right hand Right leg
Fig. 3. The 2-level hierarchical classifier designed for this experiment. The classifier first discriminates between left and right motor imagery followed by hand and foot imagery.
(a) (b)
(c) (d)
Fig. 4. An example of the feedback as visualized by the subjects. (a) shows an example of the right hand imagery which was classified correctly, while (b) shows an example of right hand imagery misclassified as right leg. (c) (a) shows an example of the left leg imagery which was classified correctly, while (d) shows an example of left leg imagery misclassified as left hand.
classes by constructing a hyperplane. Here, the class of an observation depends on which side of the hyperplane the feature vector lies. It assumes normal distribution of a data with equal covariance matrix for all classes. The separating hyperplane is a projection that maximizes the distance between two class means and minimizes the inter-class variance [31]. This technique is suitable for an online BCI system because it has a low computational requirement and is simple to use. In this work, a hierarchical classifier is designed to perform multi-class multi-classification among the four motor tasks. As shown in Fig. 3, the classifier first discriminates between left and right motor imagery followed by hand and foot motor imagery. E. Neuro-feedback training
The classifiers produces two types of output after decoding: i) the output labels, and ii) the distance of the feature vectors from the hyperplane (hyperplane distance) as neuro-feedback to the participant. The neuro-feedback is displayed to the subject in form of a blue bar during VIS sessions and a combination of blue bar and electrical stimulation during
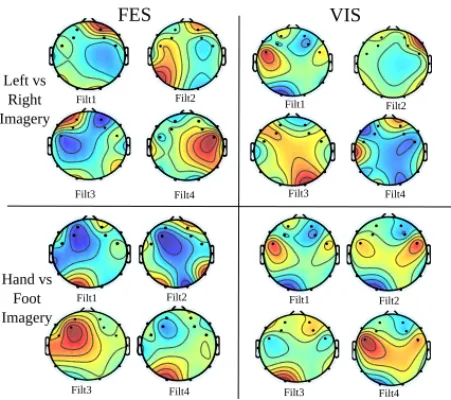
Filt1 Filt3 Filt2 Filt4 Filt1 Filt2 Filt3 Filt4 FES VIS Left vs Right Imagery Hand vs Foot Imagery Filt1 Filt3 Filt2 Filt4 Filt1 Filt3 Filt2 Filt4
Fig. 5. Topographical map of 4 sets of common spatial patterns for subject 1 for left-vs-right motor imagery and hand-vs-leg motor imagery.
FES sessions. In the feedback cue, the hyperplane distance is averaged between the two classifiers: the left-right motor imagery classifier and the hand-foot motor imagery classifier. The output labels control the direction of the bar and the hy-perplane distance controls the length of the bar. The direction of the feedback for this work is only displayed in the left and right direction. Therefore, if the output of the classifier is left hand or foot then the ideal direction of the feedback bar would be on the left direction and it would be on the right direction during right hand or foot output.
If the distance is large the blue bar will be longer which suggests an increased confidence in classifying the right task. Also, a smaller blue bar indicates smaller distance which further motivates the participant to focus more on the task. During the task it may occur that the classifier misclassifies between two limbs in the same direction. For example, instead of left leg the classifier produces a left hand output. An ideal correct and misclassified representation of the feedback during the tasks in illustrated in Fig.4. In such cases, the feedback bar is again to be of smaller length and the subject makes the necessary correction. The neuro-feedback is updated every 0.125 seconds during the feedback session of the trial and the learning across the whole feedback session is a point of interest in this paper.
III. RESULTS ANDDISCUSSION
In this paper, we aim to study the effect of electrical stimulation during motor imagery learning sessions. For this purpose, three subjects participated in a 4-class motor imagery task: left hand imagery, right hand imagery, left foot imagery and right foot imagery over six experimental sessions. In three sessions, we have provided electrical stimulation to the subjects along with visual feedback to aid him. The other three sessions only comprised of visual feedback.
An example of the CSP patterns during FES and VIS sessions for subject 1 is illustrated in Fig. 5. The topographical
TABLE I PERFORMANCE ANALYSIS
Subject Sessions Acc Sen Spec ITR
ID in % in % in % in bpt 01 FES 67.92 79.24 62.13 6.48 VIS 57.18 70.30 37.31 1.49 02 FES 66.87 83.02 67.50 8.38 VIS 64.37 74.69 54.42 6.04 03 FES 65.00 61.54 71.43 6.59 VIS 70.00 64.29 83.33 11.87
map is prepared from the interpolation of the vector present in the columns of W−1 of equation (1). From the left vs right imagery section, Filt1 of FES and VIS shows low activity in the FC6 region while Filt2 of FES has high activity in left hemisphere which is also shown in the VIS plot but in a lower scale. Filt1 and Filt3 show lower activity in the FC6 and FC5 region, respectively, which may indicate the presence of ERD in the contralateral region of left and right motor imagery, respectively. The same behaviour is also exhibited in the VIS sessions but less prominent than the FES ones. For hand vs leg imagery section, Filt3 of FES and Filt4 of VIS are mostly similar but the rest of the filters are distinctly separate from each other. It is noted in the figure that the VIS plots show higher activity than FES plots. Most patterns in FES and VIS show a common region of activity but FES plots show more specific regions of activation than VIS.
The extracted features are then fed to a trained LDA classi-fier to get the desired output, in our case, one of the four motor tasks. Table I provides the average results over the 3 FES and VIS sessions in terms of accuracy(acc), sensitivity(sen), specificity(spec) and information transfer rate (ITR) [31], [32]. Accuracy is a measure of how correctly a classifier can predict a class. Sometimes, the accuracy may provide a skewed result by detecting one class very well but the other class very poorly. Thus, the sensitivity and specificity provides a more reliable result in this context. Sensitivity suggests how good the decoder is to detect a positive class, while Sensitivity suggests how good it detects the negative result. ITR represents the amount of information reliably sent to the BCI system [32] and it is usually given by bits per trial (bpt). As noted from Table I Subject 1 shows a high increase in accuracy, sensitivity, specificity and ITR by 10.74%, 8.94%, 24.82% and 4.99 bpt, respectively while Subject 2 shows a mild increase by 2.5%, 8.33%, 12.98% and 2.34 bpt, respectively. On the other hand, subject 3 had a better performance during VIS sessions than FES sessions.
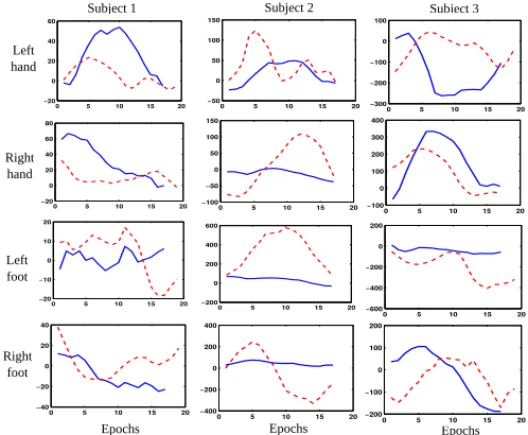
Next, we report the learning during FES and VIS session feedback for each trial. For this purpose, we measure the dis-tance of the feature vector from the hyperlane for each epoch updated at every 0.125 seconds. We took this parameter to study the feedback effect because the larger the distance from the hyperplane, the higher is the confidence of the classifier to detect the right output. The average feedback curve for all the correctly classified trials of both FES (in blue) and VIS (in red) are shown in Fig. 6. From the curves we assume that greater
0 5 10 15 20 −300 −200 −100 0 100 0 5 10 15 20 −50 0 50 0 5 10 15 20 −300 −200 −100 0 100 0 5 10 15 20 −300 −200 −100 0 100 Subject 1
Subject 1 Subject 2 Subject 3 Left hand Right hand Left foot
Epochs Epochs Epochs Right foot 0 5 10 15 20 −200 −100 0 100 200 0 5 10 15 20 −50 0 50 100 150 0 5 10 15 20 −100 −50 0 50 100 0 5 10 15 20 −50 0 50 100 0 5 10 15 20 −600 −400 −200 0 200 0 5 10 15 20 −100 −50 0 50 50 100 0 5 10 15 20 −50 0 50 100 0 5 10 15 20 −100 −50 0 50 0 5 10 15 20 −100 −50 0 50 100
Fig. 6. The learning curve of the 3 subjects for the motor imagery correctly classified tasks during FES sessions (in blue –) and VIS sessions (in red --) based on the average hyperplane distance.
the slope of the curve, faster is the learning demonstrated by the subject. Subject 1 demonstrates an increasing learning effect (greater slope) for FES feedback for all the limbs, except Right foot as compared to the VIS feedback. The figures for Subject 2 illustrates a more prominent learning effect during FES feedback and it is clearly differentiable for VIS feedback even though Subject 1 showcased a higher increase in accuracy across trials than Subject 2. It is also noted from the figures of both the subjects that VIS feedback has a frequent increasing and decreasing trend of the curve. Subject 3 had a decrease in accuracy during FES feedback as compared to the VIS feedback which can be validated from the figure that the discriminability between the FES and VIS feedback are not as prominent in comparison to the other subjects. We can infer from these results that the electrical stimulation had a positive influence during motor task learning and with an increase in sessions one can assume ES to provide a faster learning. The steady increase of learning during FES sessions can be attributed to the fact that the subjects reported to be more motivated to perform the tasks when an ES was provided and they felt the inclusion of ES helped in their imagination. On the other hand, during VIS sessions the subjects reported to lose motivation in-between the tasks. We also report the learning of trials which were incorrectly classified in Fig. 7. As observed, most figures for the three subjects show an increase in learning followed by a steady decrease for both FES and VIS sessions, which may lead for the misclassification to occur in the first place. This behaviour is completely different from the one seen for the correctly classified trials.
IV. CONCLUSION ANDFUTUREDIRECTION
In this paper, we aimed at studying the effect of electrical stimulation on motor learning during BCI classification. Fig. 5 shows the spatial patterns during FES and VIS sessions
Subject 1 Subject 2 Subject 3
Left hand Right hand Left foot
Epochs Epochs Epochs
0 5 10 15 20 −20 0 20 40 60 0 5 10 15 20 −20 0 20 40 60 80 0 5 10 15 20 −20 −10 0 10 20 0 5 10 15 20 −40 −20 0 20 40 0 5 10 15 20 −50 0 50 100 150 0 5 10 15 20 −100 −50 0 50 100 150 0 5 10 15 20 −200 0 200 400 600 0 5 10 15 20 −400 −200 0 200 400 0 5 10 15 20 −300 −200 −100 0 100 0 5 10 15 20 −600 −400 −200 0 200 0 5 10 15 20 −100 0 100 200 300 400 0 5 10 15 20 −200 −100 0 100 200 Right foot
Fig. 7. The learning curve of the 3 subjects for the motor imagery incorrectly classified tasks during FES sessions (in blue –) and VIS sessions (in red --) based on the average hyperplane distance.
and it is observed that most maps have a common region of activation. But more experimental sessions are required to reach a conclusive result to show a significant difference in the CSP patterns. Results on Table I also shows a significant rise in accuracy for Subject 1 and a mild increase of performance for Subject 2. The tabulated results suggests a positive influence of FES during motor learning of the subjects. The effective increase of learning during FES sessions are further validated from the results shown in Fig. 6. The FES sessions show a steady increase in learning as compared to the VIS session.
Visual feedback is the widely accepted form of feedback for such motor imagery tasks but the subject requires constant motivation to reach an optimal result. On incorporating electri-cal stimulation along with visual feedback the subjects in this experiment were reported to be more focussed in performing the tasks, especially for the longer sessions. Based on the results in this study, we can infer that electrical stimulation can also be used to improve the motor training of subjects and it can potentially provide better performance as it provides natural proprioceptive feedback related to motor performance than visual stimuli which requires user’s attention to visual feedback. Further studies on a larger group of subjects are required to validate this claim. Future studies in this research will include changing the intensity of FES during proprio-ceptive neurofeedback training to BCI based on the learning level of the subject. For example if a subject identifies left hand well and right leg imagery poorly, then the system will increase the intensity of FES during right leg imagery and decrease it during left hand imagery. This will lead to an improvement in motor imagery classification which would aid in neuroprosthetic or robot control [33].
REFERENCES
[1] G. Dornhege, Toward Brain-computer Interfacing, ser. A Bradford book. MIT Press, 2007.
[2] E. Thomas, M. Dyson, and M. Clerc, “An analysis of performance evaluation for motor-imagery based bci,” Journal of Neural Engineering, vol. 10, no. 3, p. 031001, 2013. [Online]. Available: http://stacks.iop.org/1741-2552/10/i=3/a=031001
[3] S. Bhattacharyya, A. Konar, and D. Tibarewala, “Motor imagery, p300 and error-related eeg-based robot arm movement control for rehabil-itation purpose,” Medical and biological engineering and computing, vol. 52, no. 12, pp. 1007–1017, Dec 2014.
[4] D. B. Popovic, “Advances in functional electrical stimulation (fes),” Journal of Electromyography and Kinesiology, vol. 24, no. 6, pp. 795 – 802, 2014.
[5] Q. Zhang, M. Hayashibe, and C. Azevedo-Coste, “Evoked
electromyography-based closed-loop torque control in functional electrical stimulation,” IEEE Transactions on Biomedical Engineering, vol. 60, no. 8, pp. 2299–2307, Aug 2013.
[6] R. Riener, M. Ferrarin, E. E. Pavan, and C. A. Frigo, “Patient-driven control of fes-supported standing up and sitting down: experimental results,” IEEE Transactions on Rehabilitation Engineering, vol. 8, no. 4, pp. 523–529, Dec 2000.
[7] J. Cauraugh, K. Light, S. Kim, M. Thigpen, and A. Behrman, “Chronic motor dysfunction after stroke: Recovering wrist and finger extension by electromyography-triggered neuromuscular stimulation,” Stroke, vol. 31, no. 6, pp. 1360–1364, 2000.
[8] J. J. Chen, N.-Y. Yu, D.-G. Huang, B.-T. Ann, and G.-C. Chang, “Ap-plying fuzzy logic to control cycling movement induced by functional electrical stimulation,” IEEE Transactions on Rehabilitation Engineer-ing, vol. 5, no. 2, pp. 158–169, Jun 1997.
[9] J. Kojovic, M. Djuric-Jovicic, S. Dosen, M. B. Popovic, and D. B. Popovic, “Sensor-driven four-channel stimulation of paretic leg: Functional electrical walking therapy,” Journal of Neuroscience Methods, vol. 181, no. 1, pp. 100 – 105, 2009. [Online]. Available: http://www.sciencedirect.com/science/article/pii/S0165027009001988 [10] D. B. Popovic and M. B. Popovic, “Hybrid assistive systems for
rehabilitation: Lessons learned from functional electrical therapy in hemiplegics,” in Engineering in Medicine and Biology Society, 2006. EMBS ’06. 28th Annual International Conference of the IEEE, Aug 2006, pp. 2146–2149.
[11] K. Kamibayashi, T. Nakajima, M. Takahashi, M. Akai, and
K. Nakazawa, “Facilitation of corticospinal excitability in the tibialis anterior muscle during robot-assisted passive stepping in humans,” European Journal of Neuroscience, vol. 30, no. 1, pp. 100–109, 2009. [Online]. Available: http://dx.doi.org/10.1111/j.1460-9568.2009.06795.x [12] F. Ty and A. Boyadjian, “Plasticity of motor cortex induced by coordination and training,” Clinical Neurophysiology, vol.
122, no. 1, pp. 153 – 162, 2011. [Online]. Available:
http://www.sciencedirect.com/science/article/pii/S1388245710004864 [13] J. Liepert, “Evidence-based methods in motor rehabilitation after stroke,”
Fortschr Neurol Psychiatr, vol. 11, no. 1, pp. 5–10, 2010.
[14] A. Jackson, J. Mavoori, and E. Fetz, “Long-term motor cortex plasticity induced by an electronic neural implant,” Nature, vol. 444, no. 7115, pp. 56–60, November 2006.
[15] W. Cho, C. Vidaurre, U. Hoffmann, N. Birbaumer, and A. Ramos-Murguialday, “Afferent and efferent activity control in the design of brain computer interfaces for motor rehabilitation,” in 2011 Annual International Conference of the IEEE Engineering in Medicine and Biology Society, Aug 2011, pp. 7310–7315.
[16] L. Yao, D. Zhang, G. Huang, and X. Zhu, “Using ssvep based brain-computer interface to control functional electrical stimulation training system,” in Cybernetics and Intelligent Systems (CIS), 2011 IEEE 5th International Conference on, Sept 2011, pp. 323–328.
[17] H. Gollee, I. Volosyak, A. J. McLachlan, K. J. Hunt, and A. Grser, “An ssvep-based brain-computer interface for the control of functional electrical stimulation,” IEEE Transactions on Biomedical Engineering, vol. 57, no. 8, pp. 1847–1855, Aug 2010.
[18] M. Takahashi, M. Gouko, and K. Ito, “Electroencephalogram (eeg) and functional electrical stimulation (fes) system for rehabilitation of stroke patients,” in Computer-Based Medical Systems, 2008. CBMS ’08. 21st IEEE International Symposium on, June 2008, pp. 53–58.
[19] G. Pfurtscheller, G. R. Mller, J. Pfurtscheller, H. J. Gerner, and R. Rupp, “’thought’ control of functional electrical stimulation
to restore hand grasp in a patient with tetraplegia,” Neuroscience Letters, vol. 351, no. 1, pp. 33 – 36, 2003. [Online]. Available: http://www.sciencedirect.com/science/article/pii/S0304394003009479 [20] G. R. Muller-Putz, R. Scherer, G. Pfurtscheller, and R. Rupp, “Eeg-based
neuroprosthesis control: A step towards clinical practice,” Neuroscience Letters, vol. 382, no. 12, pp. 169 – 174, 2005. [Online]. Available: http://www.sciencedirect.com/science/article/pii/S0304394005003009
[21] G. Muller, C. Neuper, R. Rupp, C. Keinrath, H. Gerner,
and G. Pfurtscheller, “Event-related beta eeg changes during wrist movements induced by functional electrical stimulation
of forearm muscles in man,” Neuroscience Letters, vol.
340, no. 2, pp. 143 – 147, 2003. [Online]. Available:
http://www.sciencedirect.com/science/article/pii/S0304394003000193
[22] S. Salenius, A. Schnitzler, R. Salmelin, V. Jousmki, and
R. Hari, “Modulation of human cortical rolandic rhythms
during natural sensorimotor tasks,” NeuroImage, vol. 5,
no. 3, pp. 221 – 228, 1997. [Online]. Available:
http://www.sciencedirect.com/science/article/pii/S1053811997902615 [23] T. Pistohl, D. Joshi, G. Ganesh, A. Jackson, and K. Nazarpour, “Artificial
proprioceptive feedback for myoelectric control,” IEEE Transactions on Neural Systems and Rehabilitation Engineering, vol. 23, no. 3, pp. 498– 507, May 2015.
[24] M. Gonzlez-Franco, P. Yuan, D. Zhang, B. Hong, and S. Gao, “Motor imagery based brain-computer interface: A study of the effect of positive and negative feedback,” in 2011 Annual International Conference of the IEEE Engineering in Medicine and Biology Society, Aug 2011, pp. 6323–6326.
[25] E. Tidoni, P. Gergondet, A. Kheddar, and S. M. Aglioti, “Audio-visual feedback improves the bci performance in the navigational control of a humanoid robot,” Frontiers in Neurorobotics, vol. 8, p. 20, 2014. [26] C. Jeunet, C. Vi, D. Spelmezan, B. N’Kaoua, F. Lotte, and
S. Subramanian, “Continuous Tactile Feedback for Motor-Imagery based Brain-Computer Interaction in a Multitasking Context,” in INTERACT, Bamberg, Germany, Sep. 2015. [Online]. Available: https://hal.inria.fr/hal-01159146
[27] S. Sanei and J. Chambers, EEG signal processing. Wiley-Interscience, 2007.
[28] T. Kesar, L.-W. Chou, and S. Binder-Macleod, “Effects of stimulation frequency versus pulse duration modulation on muscle fatigue,” Journal of Electromyography and Kinesiology: Official Journal of the Interna-tional Society of Electrophysiological Kinesiology, vol. 18, no. 4, p. 662671, 2008.
[29] G. Pfurtscheller and C. Neuper, “Motor imagery and direct brain-computer communication,” Proceedings of the IEEE, vol. 89, no. 7, pp. 1123–1134, Jul 2001.
[30] H. Ramoser, J. Muller-Gerking, and G. Pfurtscheller, “Optimal spatial filtering of single trial eeg during imagined hand movement,” IEEE Transactions on Rehabilitation Engineering, vol. 8, no. 4, pp. 441–446, Dec 2000.
[31] E. Alpaydin, Introduction to Machine Learning (Adaptive Computation and Machine Learning). The MIT Press, 2004.
[32] B. Obermaier, C. Neuper, C. Guger, and G. Pfurtscheller, “Information transfer rate in a five-classes brain-computer interface,” IEEE Transac-tions on Neural Systems and Rehabilitation Engineering, vol. 9, no. 3, pp. 283–288, Sept 2001.
[33] S. Bhattacharyya, S. Shimoda, and M. Hayashibe, “A synergetic brain-machine interfacing paradigm for multi-dof robot control,” IEEE Trans-actions on Systems, Man, and Cybernetics: Systems, Accepted for Publication.