HAL Id: inserm-00584378
https://www.hal.inserm.fr/inserm-00584378
Submitted on 8 Oct 2011HAL is a multi-disciplinary open access archive for the deposit and dissemination of sci-entific research documents, whether they are pub-lished or not. The documents may come from teaching and research institutions in France or abroad, or from public or private research centers.
L’archive ouverte pluridisciplinaire HAL, est destinée au dépôt et à la diffusion de documents scientifiques de niveau recherche, publiés ou non, émanant des établissements d’enseignement et de recherche français ou étrangers, des laboratoires publics ou privés.
Arterial stiffness, physical function, and functional
limitation: the Whitehall II Study.
Eric Brunner, Martin Shipley, Daniel Witte, Archana Singh-Manoux, Annie
Britton, Adam Tabak, Carmel Mceniery, Ian Wilkinson, Mika Kivimaki
To cite this version:
Eric Brunner, Martin Shipley, Daniel Witte, Archana Singh-Manoux, Annie Britton, et al.. Arterial stiffness, physical function, and functional limitation: the Whitehall II Study.: Arterial Stiffness and Functioning. Hypertension, American Heart Association, 2011, 57 (5), pp.1003-9. �10.1161/HYPER-TENSIONAHA.110.168864�. �inserm-00584378�
Arterial stiffness, physical function and functional limitation: the Whitehall II study
Eric J Brunner, Martin J Shipley, Daniel R Witte, Archana Singh-Manoux, Annie R Britton, Adam G Tabak, Carmel M McEniery, Ian B Wilkinson, Mika Kivimaki
Short title: Arterial stiffness and functioning
4 tables, 1 figure Online supplement
Corresponding author Eric Brunner
Department of Epidemiology and Public Health University College London, London, U.K. Tel: +44(0) 20 7679 1689
Fax: +44(0) 20 7419 6732 Email: [email protected]
25-Feb-11
Abstract
Arterial stiffness has been proposed as an indicator of vascular aging. We aimed to examine this
concept by analyzing associations of arterial stiffness with age, subjective and objective
measures of physical functioning, and self-reported functional limitation. We measured aortic
pulse wave velocity by applanation tonometry among 5392 men and women aged 55-78 years.
Arterial stiffness was strongly associated with age (mean difference (SE) per decade: men 1.37
(0.06) m/s, women 1.39 (0.10)). This association was robust to individual and combined
adjustment for pulse pressure, mean arterial pressure, anti-hypertensive treatment and chronic
disease. Participants took an 8 ft (2.44 m) walking speed test, a spirometry lung function test, and
completed health functioning and (instrumental) activities of daily living questionnaires.
Associations of stiffness and blood pressure with physical function scores scaled to SD=10 were
compared. One SD higher stiffness was associated with lower walking speed (coefficient
(95%CI) 0.79 (1.11 to 0.47)) m/s) and physical component summary score (0.74 (1.06 to
-0.42)), and poorer lung function (-1.17 (-1.49 to -0.86)) adjusted for age, sex and ethnic group.
Pulse pressure and mean arterial pressure were linked inversely only with lung function.
Associations of stiffness with functional limitation were robust to multiple adjustment including
pulse pressure and chronic disease. In conclusion, the concept of vascular aging is reinforced by
the observation that arterial stiffness is a robust correlate of physical functioning and functional
limitation in early old age. The nature of the link between arterial stiffness and quality of life in
older people merits attention.
Keywords
Introduction
Aortic pulse wave velocity (PWV) predicts cardiovascular disease (CVD) events and all-cause
mortality.1 Clinical CVD and death are clearly important outcomes, and variation in arterial
stiffness, a measure of arteriosclerosis, is likely to be associated with other important morbidity
such as reduced physical functional capacity.2, 3 Variation in arterial stiffening potentially has a
causal role in the heterogeneity of age-related declines in health functioning and emergence of
functional limitation. However the associations of PVW with functional outcomes remains
poorly described.
Arterial stiffness has been proposed as an indicator of vascular aging because it reflects both
target organ damage and the underlying pathological process, and potentially integrates the
long-lasting effects of known and unknown vascular risk factors.4 Chronological age is important.
Age is a surrogate for the number of heart beats, and the number of expansion-relaxation cycles
influences the rate of fatigue fracture of elastic elements within the aortic media.5 In addition,
cumulative exposure to multiple vascular risk factors compared to no risk factors is linked, even
in younger adults, with PWV difference of the order of 1 m/s.6 Aortic stiffening leads to a rise in
systolic pressure and a fall in diastolic pressure such that pulse pressure widens. This has a
number of detrimental consequences including an increase in left ventricular afterload, increased
pulsality of pressure in fragile capillaries, and a fall in myocardial perfusion. Pathophysiological
changes less directly connected to aortic function may follow, including adverse skeletal muscle
There is some evidence to suggest that variation in aortic stiffness is related to several aspects of
physical function.2, 3 To extend this line of research, we present findings in 5392 men and
women aged 55-78 years for the relations of PWV, measured by applanation tonometry, with
objective and subjective measures of physical functioning: walking speed, lung function and the
Short Form-36 physical component summary (SF-36 PCS) score, and with self-reported
functional limitation. Pulse pressure, mean arterial pressure (MAP), heart rate, chronic disease
and anti-hypertensive treatment are taken into account to examine the association of vascular
Methods
Study sample
The Whitehall II study is a longitudinal study of 10,308 male and female civil servants (initially
aged 35 – 55 years) based in London and set up in 1985. The response rate was 73%.9 The cohort
has been followed with clinical examinations every 5 years and with questionnaires every 2-3
years up to the end of 2009 (Phase 9). Approvals from the local Research Ethics Committee and
written informed consent from each participant have been obtained at each study phase.
The present study sample included those who attended the Phase 9 clinical examination
(N=5392) which was the target sample for PWV measurement, excluding by design 833
participants who were examined by nurses at home. Missing measurements of PWV and other
covariates were imputed (see Statistical Analysis). Sensitivity analysis was conducted in two
samples: the „observed PWV clinic sample‟ (N=4347) based on those who attended and the
clinical examination and provided a PWV measurement, and the „imputed PWV clinic and home
sample‟ (N=6225) based on those who were screened in the clinic or at the participant‟s home,
using imputed values for those with missing PWV data.
Aortic pulse wave velocity and blood pressure
At Phase 9, with the participant in a supine position, blood pressure was measured twice after 10
minutes of rest. From the supine systolic blood pressure (SBP) and diastolic blood pressure
(DBP), mean blood pressure in mm Hg was calculated as: DBP + 0.33(SBP-DBP). PWV was
then assessed between the carotid and femoral sites using applanation tonometry (SphygmoCor,
Atcor Medical, Australia).10 Path length was determined with a tape measure by subtracting the
was measured twice and if the difference in velocity between the two measurements was larger
than 0.5 m/s, a third measurement was taken. The average of all the measurements was used in
the analysis. PWV measurements were repeated in 137 study participants within 60 days to
assess the short-term reproducibility. The median intra-individual difference in PWV was 0.87
m/s (interquartile range 0.41-1.38).
Physical function
At Phase 9, walking speed was measured by a trained nurse over a clearly marked eight foot
walking course using a standardized protocol.11, 12 Participants wore either low-heeled
close-fitting footwear or walked barefoot. Prior to the test, participants were shown the walking course
and asked to “walk to the other end of the course at your usual walking pace, just as if you were
walking down the street to go the shops. Walk all the way past the other end of the tape before you stop”. The starting position was standing with both feet together at the start of the course. Participants were asked to begin walking when properly positioned. The stopwatch was started
as the participant's foot hit the floor across the starting line. Nurses walked behind and to the side
of the participant and stopped timing when the participant's foot hit the floor after the end of the
walking course. Three tests were conducted and the fastest walk was used in the analysis.
Pairwise correlations between measurements were between 0.92 and 0.95. Lung function was
measured by portable flow spirometry. The highest of up to five measurements was used to
define forced expiratory volume in 1 second (FEV). The UK version of the SF-36 questionnaire
was administered by self-completion questionnaire. The physical component summary (PCS)
score combines four of the eight scales: physical function, role limitations due to physical
problems, pain and general health perceptions.13, 14 The PCS score is scaled 0 to 100 with 100
Functional limitation
Functional limitation was measured at Phases 8 (2006) and/or 9 using the Activities of Daily
Living (ADL) and Instrumental Activities of Daily Living (IADL) scales (Online supplement,
please see http://hyper.ahajournals.org). The ADL scale consists of six self-completed questions
on the participant‟s ability to carry out everyday tasks, such as dressing, walking, washing, using
the toilet. The IADL questions capture ability to live independently and involve cognitive and
physical competences, including preparing a hot meal, taking medication, doing work around the
house and shopping for groceries. For both ADL and IADL, reporting one or more difficulty
from the list of six items was taken as a functional limitation. Ninety-four percent of individuals
in the clinic and home sample completed the ADL questionnaire at both Phases 8 and 9. For
these individuals, functional limitation was indicated if they reported one or more difficulty at
either phase.
Vascular disease, diabetes and anti-hypertensive medication
Prevalent vascular disease status (myocardial infarction and/or stroke) was determined using
self-report of doctor diagnosis, hospitalization with verification from medical records where
available. Prevalent diabetes was determined by self-report of doctor diagnosis and/or
medication, or oral glucose tolerance test.15
Statistical analysis
The baseline sample for the analyses was the 5392 participants attending the Phase 9 clinic. We
used multiple imputation to assign values for variables with missing data. The purpose was to
maximise the number of participants in the analyses and to check for potential selection bias due
to exclusion of those with missing values by comparing analyses performed with and without
home (see Study sample above). The multiple imputation creates a number of copies of the data
(10 copies in this case) each of which has values imputed for the missing data with an
appropriate level of randomness. The variables used for the imputation include all the analysis
variables together with other variables thought to predict missingness. We used the improved
strategy of multiple imputation, then deletion which re-sets the imputed values for outcome
variables (e.g. walking speed) back to missing.16
The associations of pulse wave velocity, blood pressure measures and chronic disease with age
and physical function score outcomes were estimated using linear least squares regression while
logistic regression was used for the self-reported limitations outcomes. In the latter analyses, we
additionally adjusted for the possible difference in detection of limited functioning by including
a variable to indicate whether individuals responded to the ADL questionnaire at one or both of
Phases 8 and 9. In order to compare the associations between pulse wave velocity and the other
blood pressure predictors we standardised these measures, separately in men and women, to have
a mean of zero and standard deviation of one. In addition, to allow comparison across the
different physical function score outcomes we standardised these scores, separately in men and
women, to have a standard deviation of 10. The estimates from these regressions in the 10 imputed datasets were averaged using Rubin‟s rules which take into account the uncertainty in the imputation as well as the uncertainty due to random variation, as in all multivariable
analyses. 17
Two sets of sensitivity analyses were conducted in order to examine the stability of the aortic
repeated the analyses in the sample of 4347 participants in whom pulse wave velocity was
measured (the observed PWV clinic sample) and the second repeated the analyses in the sample
of all 6225 participants in the clinic or home samples (the imputed PWV clinic and home
sample).
Results
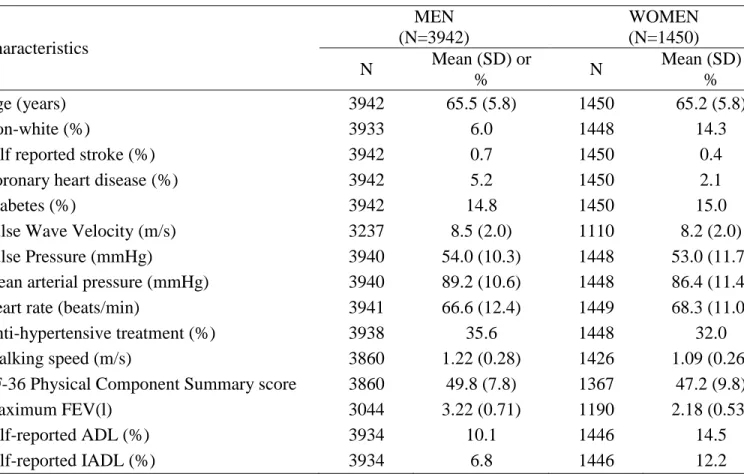
Characteristics of the Phase 9 clinic sample are shown in table 1. The proportion of missing
values was non-trivial for PWV (men 17.9%, women 23.4%) and maximum FEV (men 22.8%,
women 17.9%). The proportions with prevalent cardiovascular disease and diabetes were
respectively about one in 30 and one in seven. Around one third of participants reported they
were taking antihypertensive medication. Mean SF-36 PCS score was close to the mid-point of
the scale. One or more functional limitations were reported by about 12% on the ADL
questionnaire and 9% on the IADL questionnaire.
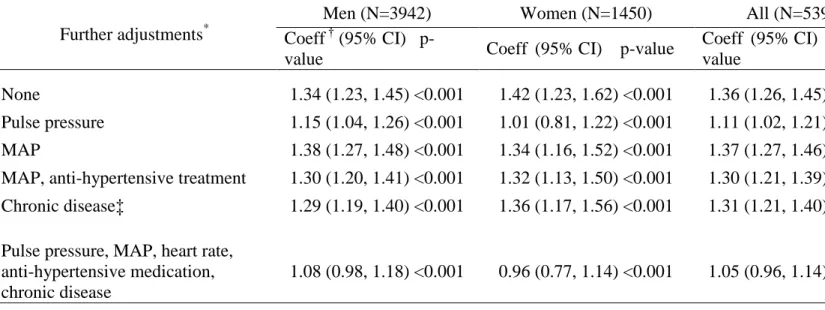
Figure 1 shows a marked age-trend in mean PWV in men and women by 5-year age group. Table
2 shows the association between PWV and age per decade, controlling separately for pulse
pressure, MAP, MAP and antihypertensive medication, and chronic disease and then for all of
these covariates. The association was similar in size in men and women. The age-PWV
association was weakened after adjustment for pulse pressure (attenuation: men 14%, women
29%), but robust to adjustment for other covariates. Further analyses were conducted on men and
Higher PWV was associated with lower physical functioning after adjustment for age, sex and
ethnic group (table 3). Pulse pressure and MAP were associated with lung function but not with
walking speed or PCS score. The association of lung function with PWV was stronger than with
MAP. Current use of antihypertensive medication and prevalent chronic disease were linked with
lower physical functioning. The PWV-physical functioning associations were largely robust to
adjustment for blood pressure measures and chronic disease (attenuation: 1-22%). Higher PWV
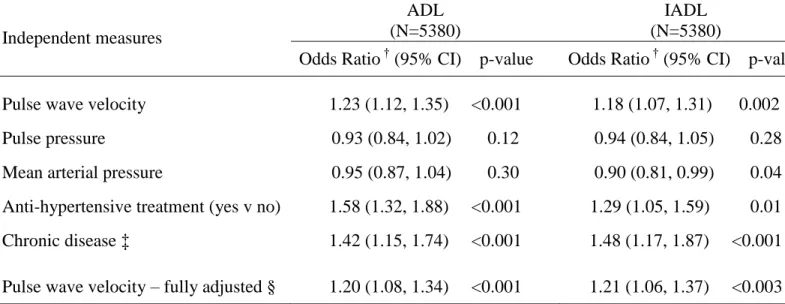
was associated with ADL and IADL functional limitations (table 4), as was current use of
antihypertensive medication and prevalent chronic disease. Pulse pressure and MAP were not
associated with functional limitations in the expected direction. The PWV-functional limitation
associations were robust to adjustment for blood pressure measures, heart rate and chronic
disease.
Sensitivity analysis
The main analyses were repeated in two samples: those in whom PWV was measured, not using
imputation (observed PWV clinic sample, maximum N=4347), and those who were screened in
the clinic or at home, using imputation for unmeasured PWV (imputed PWV clinic and home
sample, maximum N=6225). In the observed PWV clinic sample, the regression coefficients for
functioning were similar in relative size according to PWV, blood pressure measures and chronic
disease (Table S1, please see http://hyper.ahajournals.org). For lung function the coefficients
were similar, while for walking speed and PCS score coefficients tended to be smaller compared
to the full imputed clinic sample (table 3). In the imputed PWV clinic and home sample,
coefficients for functioning tended to be larger. The odds ratios for ADL and IADL functional
S2, please see http://hyper.ahajournals.org) were similar to those in the full imputed clinic
sample (table 4).
Discussion
Arterial stiffness exhibited a strong and robust association with poorer physical functioning and
functional limitation in this relatively healthy sample around age 65 years. These findings
contrast with the weak or absent links of measures based on blood pressure with the same set of
functioning indices. The age-adjusted PWV-functioning associations were weakened no more
than modestly when adjusted for the combination of pulse pressure, mean arterial pressure,
anti-hypertensive treatment and presence of chronic disease. Thus, the study demonstrates
simultaneous links between aortic stiffness and several aspects of physical functioning: first,
objective performance measures of lower limb function and lung function, second, a subjective
reported composite measure of general physical health, and third, limitations in conduct of
everyday activities, such as washing and dressing, and in competences needed for independent
living, such as shopping for groceries.
Our findings expand the evidence supporting the concept of vascular aging in relation to arterial
stiffness.1884 As expected, there was a clear age trend in aortic stiffness, here assessed by means
of applanation tonometry PWV. In addition, aortic stiffness was associated with all indices of
functioning after adjusting for chronological age. This observation is consistent with perspectives
on heterogeneity in effective biological age involving multiple molecular and environmental
mechanisms.19-21 Importantly, the vascular aging effect captured by PWV was not attributable to
of these conditions is, as yet, low in our cohort, and second, there was little attenuation of the
aortic stiffness-functioning associations on adjustment chronic disease status.
The vascular aging concept is emerging both in basic science and clinical applications. In
biomedical science, vascular aging as distinct from subclinical vascular disease describes
age-related changes in structure and physiological functioning of the vasculature, including conduit
arteries.22. Mechanisms leading to increased stiffness of the abdominal aorta may include
progressive collagen cross-linkage induced by dietary and endogenous production of advanced
glycation end products, reduced elastic fibre content, calcification, and increased muscle tone
due to endothelial cell senescence induced by oxidative stress.18, 23-26 In clinical applications, the
aim has been to develop „vascular age‟ as an intuitive risk communication message to convey an individual‟s absolute risk of a cardiovascular event, estimated from a multivariable risk
prediction function.27 Vascular age is in this context defined as the chronological age of a person
of the same sex with the same predicted risk but all risk factors absent or at achievably low
levels. More recently, Nilsson and colleagues proposed PWV measurement as a means to
identify, and monitor interventions to slow early vascular aging.4 A similar concept has been applied in a commercial setting to calculate „heart health‟ on open access web pages
(https://www.heartagecalculator.com/HeartHealth/HeartAgeCalculator.aspx). Our findings
suggest that vascular age, indexed by PWV, is relevant to age-related quality of life as well as to
risks of vascular morbidity and mortality.
Previous studies
There are few previous studies of arterial stiffness and physical functioning, and to our
Based on a 20 m timed test, the Health ABC study found a similar relation to that observed here
between walking speed and PWV and at mean age 74 years, and also did not observe an
association with pulse pressure.3 Among Welsh men at mean age 74 years, PWV and lung
function were associated, using the same methods of measurement as in our study.2 Notably, this
association did not appear to be accounted for by past or present smoking habit. A link between
augmentation index and functional limitations, based on Stanford Health Assessment
Questionnaire disability, was observed among rheumatoid arthritis patients free of overt arterial
disease. 28
The effect of aging on elasticity of the large arteries has been known and measured for many
decades and it is clear that the chronological age effect is not invariant. Blood pressure is a key
risk factor implicated in the variation of the age effect. An early study comparing a rural and an
urban community in China showed that the age-related rate of increase in aortic PWV was faster
in the urban community with higher sodium excretion, higher mean blood pressure and greater
hypertension prevalence. 29 The strong association between PWV and hypertension 30 is likely to
be bidirectional, the product of a vicious cycle of arterial changes and blood pressure
disturbances.18 While the influence of other vascular risk factors on the speed of arterial
stiffening may be relatively small, it was the case that the rate of stiffening differed markedly
within strata of mean arterial pressure in the Chinese study. 29 Recent prospective analyses,
including one in the present cohort (data not shown), suggest that central obesity, raised serum
triglycerides and low-grade inflammation may be among the important non-blood pressure risk
factors responsible for variation in age-related heterogeneity in arterial stiffening. 31
While not community-based, the study has been carried out in the largest healthy
population-scale sample to date with a gold-standard PWV measurement. Crucially, we used multiple
imputation to verify that missing PWV values, among some 20% of the clinic sample and, by
design, among all of those examined at home, did not distort the associations of interest. Multiple
imputation is designed to reduce the effect of selection bias on analytic findings, but imputed
results may mislead if applied inappropriately. 32 A key assumption is that the imputed variable
is missing completely at random in the model. Here we have imputed missing PWV values using
a range of variables that predict these missing values, including demographic variables, BMI and
vascular risk factors shown to predict PWV in the study sample. All functioning measures of
interest were included in the imputation model and imputed values subsequently set to missing in
the computation of the effects reported.16 Sensitivity analyses with the pulse pressure variable
suggested the missing at random assumption was reasonable. Pulse pressure measurements were
set to missing among participants without a PWV measurement who attended the clinic.
PWV-functioning associations in the full clinic sample based on imputed pulse pressure values among
those without a PWV measurement were close to the effects obtained when all observed pulse
pressure values were used (data not shown).
We restricted the analytic sample to participants who attended our clinic, since this was the
group targeted for the PWV measurement. The main analyses were additionally carried out with
imputation of PWV values for all participants in the study phase, including those seen by a nurse
at home, and for comparison, a complete cases analysis without imputation (Tables S1 and S2).
These analyses show considerable stability of effects in absolute and relative terms across the
This baseline cross-sectional study cannot address the nature of associations between aortic
stiffness and physical function. One causal interpretation leads from declining cardiovascular
function, indexed by aortic stiffness, to declining physical functioning. It is also plausible that
poor physical functioning may be the factor driving the association. For example, poor lung
function may be a precursor of aortic stiffness 2 and in the present study lung function is
associated with pulse pressure as well as PWV, whereas other functional measures are associated
only with PWV. A third possibility is that long-term influences, behavioral and genetic, may
generate the observed associations by accelerating or delaying aging processes.33 A further
possibility is that the associations are bidirectional in nature. With respect to cardiac function,
stroke volume was not assessed in the study and so any impact of this parameter on the observed
associations could not be quantified. Stroke volume may influence PWV indirectly via mean
arterial pressure, which we have adjusted for in the models. Resting heart rate was measured and
included among the variables in the fully adjusted models.
Implications
Our analysis suggests that aortic stiffness is a useful marker of poor present and future physical
function, and as functional limitation is a precursor of disability, aortic stiffness in the young old
may be a risk factor for incident disability. Against the set of functioning measures analyzed
here, measurement of PWV by applanation tonometry is more precise and powerful method for
evaluating aortic stiffness than measurement of pulse pressure, which was associated only with
lung function. Further follow-up of the cohort with a second measurement of PWV will be
have in the heterogeneity of aging processes, and in establishing whether arterial stiffness may
be a useful target for clinical strategies designed to promote healthy aging.
We add to the scant evidence that aortic stiffness is associated with aging outcomes, and for the
first time demonstrate a relation with functional limitation in a healthy sample. Our observations
reinforce the concept of vascular aging, in showing that aortic stiffness remained robustly
associated to several ageing outcomes after taking account of chronological age, MAP, pulse
pressure, heart rate and chronic disease status.
Perspectives
Arterial stiffness based on pulse wave velocity has been proposed as an indicator of vascular
aging. We found associations of stiffness with walking speed, lung function, SF-36 physical
component summary score and ADL/IADL functional limitation to be largely unchanged after
multiple adjustment including pulse pressure and chronic disease. Our results reinforce the
concept of vascular aging. Carotid-femoral pulse wave velocity based on applanation tonometry
may be a sensitive tool for assessing the rate of progression of vascular stiffness in early old age
Acknowledgments
We thank all participating civil service departments and their welfare personnel, and
establishment officers; the Occupational Health and Safety Agency; the Council of Civil Service
Unions; all participating civil servants in the Whitehall II study; all members of the Whitehall II
study team. The Whitehall II Study team comprises research scientists, statisticians, study
coordinators, nurses, data managers, administrative assistants and data entry staff, who make the
study possible.
Sources of Funding
The Whitehall II study has been supported by grants from the British Medical Research Council;
British Economic and Social Research Council; British Heart Foundation; Stroke Association;
UK Health and Safety Executive; UK Department of Health; National Heart Lung and Blood
Institute (HL36310), US, National Institutes of Health: National Institute on Aging
(R01AG013196; R01AG034454, US, National Institutes of Health; Agency for Health Care
Policy Research (HS06516); and the John D and Catherine T MacArthur Foundation Research
Networks on Successful Midlife Development and Socio-economic Status and Health. ARB,
EJB, MK, CMM (Intermediate Research Fellowship), MJS and IBW (Senior Clinical
Fellowship) are supported by the British Heart Foundation. MK is supported by BUPA and the
Academy of Finland. EJB and ARB are supported by the Stroke Association. IBW and CMM are
supported by the Cambridge Biomedical Research Centre (NIHR).
Conflict(s) of Interest/Disclosure(s)
Reference List
(1) Vlachopoulos C, Aznaouridis K, Stefanadis C. Prediction of cardiovascular events and all-cause mortality with arterial stiffness: a systematic review and meta-analysis. J Am Coll Cardiol 2010;55:1318-1327.
(2) Bolton CE, Cockcroft JR, Sabit R, Munnery M, McEniery CM, Wilkinson IB, Ebrahim S, Gallacher JE, Shale DJ, Ben-Shlomo Y. Lung function in mid-life compared with later life is a stronger predictor of arterial stiffness in men: the Caerphilly Prospective Study. Int J Epidemiol 2009;38:867-876.
(3) Watson NL, Sutton-Tyrrell K, Youk AO, Boudreau RM, Mackey RH, Simonsick EM, Rosano C, Hardy SE, Windham BG, Harris TB, Najjar SS, Lakatta EG, Atkinson HH, Johnson KC, Bauer DC, Nemwan AB. Arterial Stiffness and Gait Speed in Older Adults With and Without Peripheral Arterial Disease. Am J Hypertens 2011;24:90-95.
(4) Nilsson PM, Boutouyrie P, Laurent S. Vascular aging: A tale of EVA and ADAM in cardiovascular risk assessment and prevention. Hypertension 2009;54:3-10.
(5) O'Rourke MF, Nichols WW. Aortic diameter, aortic stiffness, and wave reflection increase with age and isolated systolic hypertension. Hypertension 2005;45:652-658.
(6) Aatola H, Hutri-Kahonen N, Juonala M, Viikari JS, Hulkkonen J, Laitinen T, Taittonen L, Lehtimaki T, Raitakari OT, Kahonen M. Lifetime risk factors and arterial pulse wave velocity in adulthood: the cardiovascular risk in young Finns study. Hypertension 2010;55:806-811.
(7) Bearden SE. Effect of aging on the structure and function of skeletal muscle microvascular networks. Microcirculation 2006;13:279-288.
(8) Najjar SS, Scuteri A, Lakatta EG. Arterial aging: is it an immutable cardiovascular risk factor? Hypertension 2005;46:454-462.
(9) Marmot MG, Brunner EJ. Cohort Profile: The Whitehall II study. Int J Epidemiol 2005;34:251-256.
(10) Wilkinson IB, Fuchs SA, Jansen IM, Spratt JC, Murray GD, Cockcroft JR, Webb DJ.
Reproducibility of pulse wave velocity and augmentation index measured by pulse wave analysis. J Hypertens 1998;16:2079-2084.
(11) Guralnik JM, Winograd CH. Physical performance measures in the assessment of older persons. Aging Clin Exp Res 1994;6:303-305.
(12) Brunner E, Shipley M, Spencer V, Kivimaki M, Chandola T, Gimeno D, Singh-Manoux A, Guralnik J, Marmot M. Social inequality in walking speed in early old age in the Whitehall II study. J Gerontol A Biol Sci Med Sci 2009;64:1082-1089.
(13) Ware JE, Kosinski M, Keller SD. SF-36 physical and mental summary scales: A user's manual. The Health Institute 1994.
(14) Stafford M, Gimeno D, Marmot MG. Neighbourhood characteristics and trajectories of health functioning: a multilevel prospective analysis. Eur J Public Health 2008;18:604-610.
(15) Brunner EJ, Shipley MJ, Marmot MG, Kivimaki M, Witte DR. Do the Joint British Society (JBS2) guidelines on prevention of cardiovascular disease with respect to plasma glucose improve risk stratification in the general population? Prospective cohort study. Diabet Med 2010;27:550-555.
(16) von Hippel PT. Regression with missing YS: An improved strategy for analyzing multiply imputed data. Sociological Methodology 2007;37:83-117.
(17) Rubin DB. Multiple imputation for nonresponse in surveys. New York: John Wiley & Sons, Inc.; 1987.
(18) Lakatta EG, Levy D. Arterial and cardiac aging: major shareholders in cardiovascular disease enterprises: Part I: aging arteries: a "set up" for vascular disease. Circulation 2003;107:139-146.
(19) Kirkwood TB. Systems biology of ageing and longevity. Philos Trans R Soc Lond B Biol Sci 2011;366:64-70.
(20) Partridge L. The new biology of ageing. Philos Trans R Soc Lond B Biol Sci 2010;365:147-154.
(21) Ferrucci L, Giallauria F, Guralnik JM. Epidemiology of aging. Radiol Clin North Am 2008;46:643-652.
(22) Ungvari Z, Kaley G, de CR, Sonntag WE, Csiszar A. Mechanisms of vascular aging: new perspectives. J Gerontol A Biol Sci Med Sci 2010;65:1028-1041.
(23) Semba RD, Najjar SS, Sun K, Lakatta EG, Ferrucci L. Serum carboxymethyl-lysine, an advanced glycation end product, is associated with increased aortic pulse wave velocity in adults. Am J Hypertens 2009;22:74-79.
(24) Erusalimsky JD, Skene C. Mechanisms of endothelial senescence. Exp Physiol 2009;94:299-304.
(25) Bellien J, Favre J, Iacob M, Gao J, Thuillez C, Richard V, Joannides R. Arterial stiffness is regulated by nitric oxide and endothelium-derived hyperpolarizing factor during changes in blood flow in humans. Hypertension 2010;55:674-680.
(26) McEniery CM, McDonnell BJ, So A, Aitken S, Bolton CE, Munnery M, Hickson SS, Yasmin, Maki-Petaja KM, Cockcroft JR, Dixon AK, Wilkinson IB. Aortic calcification is associated with
aortic stiffness and isolated systolic hypertension in healthy individuals. Hypertension 2009;53:524-531.
(27) Marma AK, Lloyd-Jones DM. Systematic examination of the updated Framingham heart study general cardiovascular risk profile. Circulation 2009;120:384-390.
(28) Crilly MA, Clark HJ, Kumar V, Scott NW, Macdonald AG, Williams DJ. Relationship between arterial stiffness and Stanford Health Assessment Questionnaire disability in rheumatoid arthritis patients without overt arterial disease. J Rheumatol 2010;37:946-952.
(29) Avolio AP, Deng FQ, Li WQ, Luo YF, Huang ZD, Xing LF, O'Rourke MF. Effects of aging on arterial distensibility in populations with high and low prevalence of hypertension: comparison between urban and rural communities in China. Circulation 1985;71:202-210.
(30) Cecelja M, Chowienczyk P. Dissociation of aortic pulse wave velocity with risk factors for cardiovascular disease other than hypertension: a systematic review. Hypertension 2009;54:1328-1336.
(31) McEniery CM, Spratt M, Munnery M, Yarnell J, Lowe GD, Rumley A, Gallacher J, Ben-Shlomo Y, Cockcroft JR, Wilkinson IB. An analysis of prospective risk factors for aortic stiffness in men: 20-year follow-up from the Caerphilly prospective study. Hypertension 2010;56:36-43.
(32) Sterne JA, White IR, Carlin JB, Spratt M, Royston P, Kenward MG, Wood AM, Carpenter JR. Multiple imputation for missing data in epidemiological and clinical research: potential and pitfalls. Br Med J 2009;338:b2393.
(33) Selman C, Lingard S, Choudhury AI, Batterham RL, Claret M, Clements M, Ramadani F, Okkenhaug K, Schuster E, Blanc E, Piper MD, Al-Qassab H, Speakman JR, Carmignac D, Robinson IC, Thornton JM, Gems D, Partridge L, Withers DJ. Evidence for lifespan extension
and delayed age-related biomarkers in insulin receptor substrate 1 null mice. FASEB J 2008;22:807-818.
Table 1. Characteristics of the 5392 participants seen at the clinical examination. Characteristics MEN (N=3942) WOMEN (N=1450) N Mean (SD) or % N Mean (SD) or % Age (years) 3942 65.5 (5.8) 1450 65.2 (5.8) Non-white (%) 3933 6.0 1448 14.3
Self reported stroke (%) 3942 0.7 1450 0.4
Coronary heart disease (%) 3942 5.2 1450 2.1
Diabetes (%) 3942 14.8 1450 15.0
Pulse Wave Velocity (m/s) 3237 8.5 (2.0) 1110 8.2 (2.0) Pulse Pressure (mmHg) 3940 54.0 (10.3) 1448 53.0 (11.7) Mean arterial pressure (mmHg) 3940 89.2 (10.6) 1448 86.4 (11.4) Heart rate (beats/min) 3941 66.6 (12.4) 1449 68.3 (11.0) Anti-hypertensive treatment (%) 3938 35.6 1448 32.0 Walking speed (m/s) 3860 1.22 (0.28) 1426 1.09 (0.26) SF-36 Physical Component Summary score 3860 49.8 (7.8) 1367 47.2 (9.8) Maximum FEV(l) 3044 3.22 (0.71) 1190 2.18 (0.53)
Self-reported ADL (%) 3934 10.1 1446 14.5
Self-reported IADL (%) 3934 6.8 1446 12.2
SD: Standard Deviation; ADL: Activities of Daily Living; IADL: Instrumental Activities of Daily Living
Table 2. Association of pulse wave velocity with age in those seen at the clinical examination.
Further adjustments*
Men (N=3942) Women (N=1450) All (N=5392) Coeff † (95% CI)
p-value Coeff (95% CI) p-value
Coeff (95% CI) p-value
None 1.34 (1.23, 1.45) <0.001 1.42 (1.23, 1.62) <0.001 1.36 (1.26, 1.45) <0.001 Pulse pressure 1.15 (1.04, 1.26) <0.001 1.01 (0.81, 1.22) <0.001 1.11 (1.02, 1.21) <0.001 MAP 1.38 (1.27, 1.48) <0.001 1.34 (1.16, 1.52) <0.001 1.37 (1.27, 1.46) <0.001 MAP, anti-hypertensive treatment 1.30 (1.20, 1.41) <0.001 1.32 (1.13, 1.50) <0.001 1.30 (1.21, 1.39) <0.001 Chronic disease‡ 1.29 (1.19, 1.40) <0.001 1.36 (1.17, 1.56) <0.001 1.31 (1.21, 1.40) <0.001
Pulse pressure, MAP, heart rate, anti-hypertensive medication, chronic disease
1.08 (0.98, 1.18) <0.001 0.96 (0.77, 1.14) <0.001 1.05 (0.96, 1.14) <0.001
MAP: Mean arterial pressure
*
All coefficients are adjusted for ethnic group. The combined group of men and women is also adjusted for sex. Multiple imputation was used to fill missing values for all
covariates other than age and sex
†
Coefficients show the change in pulse wave velocity per 10 years of age. ‡Chronic disease defined as prevalent stroke, MI or diabetes
Table 3: Association of pulse wave velocity, blood pressure measures and chronic disease* with standardized physical function scores in those seen at the clinical examination. Independent measures Walking speed (N=5286) SF-36 Physical Component Summary score (N=5227) Lung function (N=4234) Coeff † (95% CI) p-value Coeff † (95% CI) p-value Coeff † (95% CI) p-value
Pulse wave velocity -0.96 (-1.29, -0.64) <0.001 -0.91 (-1.21, -0.60) <0.001 -1.23 (-1.53, -0.92) <0.001 Pulse pressure -0.08 (-0.37, 0.21) 0.58 0.25 (-0.05, 0.55) 0.11 -0.80 (-1.11, -0.50) <0.001 Mean arterial pressure -0.20 (-0.47, 0.08) 0.16 0.26 (-0.02, 0.55) 0.07 -0.47 (-0.76, -0.17) 0.002 Anti-hypertensive treatment (yes v no) -1.96 (-2.53, -1.39) <0.001 -3.27 (-3.85, -2.68) <0.001 -1.60 (-2.18, -1.03) <0.001 Chronic disease‡ -1.80 (-2.50, -1.10) <0.001 -3.10 (-3.83, -2.37) <0.001 -2.06 (-2.78, -1.33) <0.001 Pulse wave velocity – fully adjusted§ -0.67 (-1.06, -0.24) <0.001 -0.70 (-1.09, -0.31) <0.001 -0.72 (-1.11, -0.33) <0.001
*
All models are adjusted for age, sex and ethnic group. Analytic samples were restricted
to those with observed physical function outcomes.
†
Regression coefficients of functioning scores scaled to SD = 10, per 1SD change in
pulse wave velocity, pulse pressure, mean arterial pressure. ‡ Chronic disease defined as prevalent stroke, MI or diabetes
§ Fully adjusted model is adjusted for age, sex, ethnic group, pulse pressure, mean
Table 4. Association of pulse wave velocity, blood pressure measures and chronic disease* with self-reported functional limitation in those seen at the clinical examination.
Independent measures
ADL (N=5380)
IADL (N=5380)
Odds Ratio † (95% CI) p-value Odds Ratio † (95% CI) p-value
Pulse wave velocity 1.23 (1.12, 1.35) <0.001 1.18 (1.07, 1.31) 0.002 Pulse pressure 0.93 (0.84, 1.02) 0.12 0.94 (0.84, 1.05) 0.28 Mean arterial pressure 0.95 (0.87, 1.04) 0.30 0.90 (0.81, 0.99) 0.04 Anti-hypertensive treatment (yes v no) 1.58 (1.32, 1.88) <0.001 1.29 (1.05, 1.59) 0.01 Chronic disease ‡ 1.42 (1.15, 1.74) <0.001 1.48 (1.17, 1.87) <0.001
Pulse wave velocity – fully adjusted § 1.20 (1.08, 1.34) <0.001 1.21 (1.06, 1.37) <0.003
*
All models are adjusted for age, sex and ethnic group. Analytic samples were restricted to those with observed physical function outcomes.
†
Odds ratios of having one or more ADL or IADL disability per 1SD change in pulse wave velocity, pulse pressure and mean arterial pressure.
‡ Chronic disease defined as prevalent stroke, MI or diabetes
§ Fully adjusted model is adjusted for age, sex, ethnic group, pulse pressure, mean arterial pressure, heart rate, anti-hypertensive treatment and chronic disease
Figure 1 Pulse wave velocity (mean and 95%CI) by sex and age group
Arterial stiffness, physical function and functional limitation: the Whitehall II study Online supplement
1. Functional limitation questionnaire
Activities of Daily Living (ADL) and Instrumental Activities of Daily Living (IADL)
scales administered at Whitehall II Phase 8 (2006) and Phase 9 (2008-09).
2. Main tables based on alternate definitions of the study sample
Tables S1 and S2 are based on two alternate definitions of the study sample. The first is
the Observed Pulse Wave Velocity (PWV) Clinic Sample, based on 4347 participants in
whom pulse wave velocity was measured at the clinical examination. Imputation was not
used in this complete cases analysis. The second is the Imputed PWV Clinic and Home
Sample based on all 6225 participants who were examined in the clinic (n=5392) or at
home (n=833). See Methods Study Sample and Statistical Analysis for details of the
Functional limitation questionnaire
The Activities of Daily Living (ADL) and Instrumental Activities of Daily Living
(IADL) scales were worded as follows.
“Here are a few everyday activities. Please tell us if you have any difficulties
(Yes/No) with these because of a physical, mental, emotional or memory problem. Exclude any difficulties you expect to last less than three months.”
ADL
(a) Dressing, including putting on shoes and socks
(b) Walking across a room
(c) Bathing of showering
(d) Eating, such as cutting up your food
(e) Getting in or out of bed
(f) Using the toilet, including getting up or down
IADL
(a) Preparing a hot meal
(b) Shopping for groceries
(c) Making telephone calls
(d) Taking medication
(e) Doing work around the house or garden
Table S1. Association of pulse wave velocity, blood pressure measures and chronic disease* with standardized physical function scores
Independent measures Walking speed Physical Component Score (SF-36) Lung function Coeff † (95% CI) p-value Coeff † (95% CI) p-value Coeff † (95% CI) p-value
Among 4347 participants in whom pulse wave velocity was measured at the clinical examination
No. of participants in analysis 4264 4220 3463
Pulse wave velocity -0.79 (-1.11, -0.48) <0.001 -0.73 (-1.06, -0.41) <0.001 -1.18 (-1.50, -0.87) <0.001 Pulse pressure -0.01 (-0.33, 0.31) 0.95 0.35 (0.03, 0.68) 0.03 -0.76 (-1.09, -0.42) <0.001 Mean arterial pressure -0.16 (-0.46, 0.14) 0.29 0.27 (-0.03, 0.58) 0.08 -0.41 (-0.73, -0.09) 0.01 Anti-hypertensive treatment (yes v no) -1.96 (-2.60, -1.33) <0.001 -2.67 (-3.31, -2.03) <0.001 -1.53 (-2.17, -0.89) <0.001 Chronic disease ‡ -1.55 (-2.34, -0.76) <0.001 -2.34 (-3.14, -1.53) <0.001 -2.03 (-2.84, -1.22) <0.001 Pulse wave velocity – fully adjusted § -0.65 (-1.01, -0.29) <0.001 -0.59 (-0.94, -0.23) 0.001 -0.78 (-1.14, -0.43) <0.001
Among 6225 participants who were screened in the clinic or at home
No. of participants in analysis 6052 5999 4845
Pulse wave velocity -1.01 (-1.33, -0.69) <0.001 -1.10 (-1.47, -0.73) <0.001 -1.25 (-1.56, -0.93) <0.001 Pulse pressure -0.06 (-0.32, 0.21) 0.68 0.25 (-0.03, 0.54) 0.08 -0.74 (-1.02, -0.46) <0.001 Mean arterial pressure -0.14 (-0.39, 0.12) 0.30 0.28 (0.00, 0.55) 0.05 -0.42 (-0.69, -0.14) 0.003 Anti-hypertensive treatment (yes v no) -1.96 (-2.50, -1.42) <0.001 -3.61 (-4.18, -3.04) <0.001 -1.66 (-2.20, -1.11) <0.001 Chronic disease ‡ -2.13 (-2.78, -1.48) <0.001 -3.57 (-4.27, -2.87) <0.001 -2.15 (-2.82, -1.48) <0.001 Pulse wave velocity – fully adjusted § -0.76 (-1.20, -0.32) <0.001 -0.72 (-1.17, -0.28) 0.002 -0.82 (-1.19, -0.45) <0.001
*All models are adjusted for age, sex and ethnic group
†
Regression coefficients of functioning scores scaled to SD = 10, per 1SD change in pulse wave velocity, pulse pressure and mean arterial pressure.
Table S2. Association of pulse wave velocity, blood pressure measures and chronic disease* with self-reported functional limitation
Independent measures ADL IADL
Odds Ratio † (95% CI) p-value Odds Ratio † (95% CI) p-value
Participants in whom pulse wave velocity was measured at the clinical examination
No. of participants in analysis 4339 4339
Pulse wave velocity 1.16 (1.05, 1.28) 0.004 1.15 (1.03, 1.29) 0.01 Pulse pressure 0.89 (0.80, 1.00) 0.05 0.93 (0.82, 1.06) 0.30 Mean arterial pressure 0.93 (0.83, 1.03) 0.14 0.93 (0.82, 1.05) 0.22 Anti-hypertensive treatment (yes v no) 1.57 (1.28, 1.94) <0.001 1.30 (1.02, 1.65) 0.04 Chronic disease ‡ 1.26 (0.98, 1.62) 0.08 1.38 (1.04, 1.84) 0.03 Pulse wave velocity – fully adjusted§ 1.18 (1.06, 1.32) 0.004 1.17 (1.03, 1.33) 0.016
Participants who were screened in the clinic or at home
No. of participants in analysis 6198 6198
Pulse wave velocity 1.23 (1.13, 1.34) <0.001 1.22 (1.07, 1.39) 0.004 Pulse pressure 0.93 (0.87, 1.01) 0.08 0.93 (0.86, 1.02) 0.14 Mean arterial pressure 0.96 (0.89, 1.03) 0.27 0.89 (0.82, 0.98) 0.01 Anti-hypertensive treatment (yes v no) 1.53 (1.31, 1.78) <0.001 1.22 (1.02, 1.46) 0.03 Chronic disease ‡ 1.40 (1.17, 1.67) <0.001 1.43 (1.17, 1.75) <0.001 Pulse wave velocity – fully adjusted § 1.19 (1.08, 1.31) <0.001 1.20 (1.06, 1.37) 0.004
*All models are adjusted for age, sex and ethnic group
†
Odds ratios of having one or more ADL or IADL disability per 1SD change in pulse wave velocity, pulse pressure and mean arterial pressure. ‡ Chronic disease defined as prevalent stroke, MI or diabetes