HAL Id: halshs-01658795
https://halshs.archives-ouvertes.fr/halshs-01658795
Submitted on 7 Dec 2017
HAL is a multi-disciplinary open access archive for the deposit and dissemination of sci-entific research documents, whether they are
pub-L’archive ouverte pluridisciplinaire HAL, est destinée au dépôt et à la diffusion de documents scientifiques de niveau recherche, publiés ou non,
Human Capital, Labor Market Outcomes and Horizontal
Inequality in Guatemala
Carla Canelas, Rachel Gisselquist
To cite this version:
Carla Canelas, Rachel Gisselquist. Human Capital, Labor Market Outcomes and Horizontal Inequality in Guatemala. 2017. �halshs-01658795�
Documents de Travail du
Centre d’Economie de la Sorbonne
Human Capital, Labour Market Outcomes and Horizontal Inequality in Guatemala
Carla CANELAS, Rachel GISSELQUIST
Human Capital, Labour Market Outcomes, and
Horizontal Inequality in Guatemala
Carla Canelas
∗Rachel Gisselquist
†Abstract
With the second largest indigenous population by percentage in Latin America, Guatemala is an important case for understanding horizontal inequality and indige-nous politics. This paper presents new analysis of survey data, allowing for considera-tion both of indigenous and ladino populaconsidera-tions, as well as of ethno-linguistic diversity within the indigenous population. Overall, our analysis illustrates both the depth and persistence of horizontal inequalities in educational and labour market outcomes, and a broad trend towards greater equality. Earnings gaps have been reduced by, among other factors, improved educational outcomes. Ethnic groups also show distinct pat-terns of wages and wage gaps, and there is evidence of a ‘sticky floor’ effect at the lower ends of the income spectrum affecting some groups more than others. Our find-ings suggest that the focus on the indigenous/non-indigenous divide found in much of the economic literature on Latin America obscures meaningful diversity within the indigenous population. We posit that further consideration of such within-group diversity has implications for broader theories of ethnic politics, and in particular for understanding the comparative weakness of indigenous political mobilisation in Guatemala at the national level.1
Keywords: Inequality; ethnicity; schooling; earnings; Guatemala JEL Classification: J22; J31; J71
∗Centre d’Economie de la Sorbonne, Paris, France. e-mail address: carla.canelas@univ-paris1.fr †UNU-WIDER, Helsinki, Finland. e-mail address: rachel@wider.unu.edu
1This study has been prepared within the UNU-WIDER project on ‘The politics of group-based inequality-measurement, implications, and possibilities for change’, which is part of a larger research project on ‘Disadvantaged groups and social mobility’. The study is reproduced by permission of UNU-WIDER, Helsinki, which commissioned the original research and holds copyright thereon.
1
Introduction
Guatemala has the second largest indigenous population by percentage in Latin America and a clear history of horizontal inequality and violent state-sponsored oppression. Despite a wealth of literature on Guatemala’s indigenous population, however, there are a number of gaps in our knowledge about horizontal inequality. This paper draws on new analysis of individual-level data from the 2000 and 2011 rounds of the Guatamalan National Living Standards Survey (Encuesta Nacional de Condiciones de Vida - ENCOVI) to speak to these gaps. ENCOVI has helped to address major gaps in poverty data more generally
for Guatemala, which historically has had a weak tradition of compiling such data (World
Bank(2004)).
Our analysis documents a number of empirical patterns in the decades following the end of the civil war in 1996, including consideration of inequalities both between ladino and indigenous populations and between the ladino population and diverse indigenous eth-nic groups defined by language, culture, and region (e.g., Quich´e, Kekch´ı, Kakchiquel). It shows overall both the depth and persistence of horizontal inequalities in educational and labour market outcomes, and a general trend towards greater equality. Reductions in earn-ings gaps have been supported by, among other factors, improved educational outcomes. Ethnic groups also show distinct patterns of wages and wage gaps, and there is evidence
of a ‘sticky floor’ effect at the lower ends of the income spectrum affecting some groups
more than others.
Quantitative work on these topics to-date has focused heavily on the dichotomy be-tween indigenous and non-indigenous populations. In considering ‘within-group’ ethnic divisions in the indigenous population, our empirical analysis is informed by the more qualitative literature on identity and ethnicity in Guatemala, which documents the strength and salience of diverse indigenous identities.
As we explore at the end of this article, our findings lend support to the persistent rele-vance of both between- and within-ethnic group inequalities in Guatemala. More broadly, we posit that our findings may have implications for broader theories of ethnic politics, and in particular may help to explain the puzzling weakness of indigenous mobilisation in Guatemala at the national level as compared to other countries in the region with
siz-able indigenous populations (Madrid(2012),Yashar(1999)). While the indigenous Maya
movement played a notable role in post-war politics, Guatemala subsequently has had for instance no major indigenous political parties or leading presidential candidates unlike other countries. Our analysis speaks to the possible impact of socioeconomic inequalities between indigenous groups in explaining enduring divisions within Guatemala’s indige-nous movement. This discussion in turn has implications for future research on ethnic and indigenous politics.
Finally, in methodological terms, our analysis does several things with the ENCOVI data that are not standard in other analyses of horizontal inequalities. In addition to
disag-gregating beyond the major political cleavage (indigenous/non-indigenous) by indigenous
ethnic group, we also consider and compare different indicators of horizontal inequality,
looking both at educational outcomes and wages, and we analyse outcomes for children separately from adults. Further analysis along these lines would be useful in other coun-tries as well. It is also clear that data remain a major constraint on such analysis in many countries, underscoring the value of the ENCOVI surveys used here.
This paper begins with discussion of ethnicity and inequality in Guatemala, followed by an outline of key findings and gaps in the related literature. Next, it presents the empir-ical specification used in this analysis and then turns to data and descriptive analysis. This is followed by results, discussion, and a conclusion.
2
Ethnicity and inequality in Guatemala
Guatemala, home to some 15 million people, is among the poorest and most unequal countries in Latin America. Its GDP per capita is approximately 7,700 USD per year (2015), roughly half of the regional average, and its incidence of poverty is high with an
increasing trend (56,2 per cent in 2000, 53.7 per cent in 2011, and 59,3 per cent in 2014)2
Guatemala’s indigenous population is second only to Bolivia in the region in terms of
population share. Standard sources present somewhat varying numbers: Gonzalez(1994)
estimates the indigenous population in the 1970s as between 44 and 66 per cent, and in the 1980s as 42-44 per cent – compared with 65-71 and 54-57 per cent in Bolivia. The Guatemalan census records 65 per cent indigenous in 1921, 56 per cent in 1940, 54 per
cent in 1950, 44 per cent in 1973, and 42 per cent in 1981.3 Estimates drawn from the
ENCOVI surveys and based on self-identification are broadly on par with these figures: 41.6 per cent self-identify as indigenous in the 2000 survey, 37.4 in 2006, and 39.8 in 2011.
The indigenous population is disbursed throughout Guatemala, with the majority in the central and western highlands. Most of the indigenous population is of Maya descent, and
classified into some 21 language groups (Lewis et al.(2016)).4 The largest of these groups
are Quich´e (8-13 per cent by self-identification in the 2000-2011 ENCOVI), Kakchiquel (8-9 per cent), Kekch´ı (6-7 per cent), and Mam (4-6 per cent).
A long history of socioeconomic inequality between indigenous and ladino populations
2Official numbers, Guatemalan National Institute of Statistics (INE). 3Gonzalez(1994), p. 29;Steele(1994), p. 98.
is well-documented. Simple statistics are illustrative: poverty incidence among the indige-nous population is recorded as twice as high as among the non-indigeindige-nous population for
2000 and 2011 and 1.7 higher in 2014 (INE). Striking differences also exist between urban
and rural (disproportionately indigenous) populations, as shown in Tables A.1- A.4. In
1989, 92.6 and 81.3 per cent of the indigenous were identified as poor and extremely poor,
compared with 65.8 and 45.2 per cent for the non-indigenous population.5 Indigenous
people are overrepresented in the agricultural sector and in elementary occupations. Historical expropriation of indigenous communal land, forced labour, exclusionary ed-ucational policies, and political disenfranchisement have all contributed to horizontal
in-equality in Guatemala, particularly between the indigenous and ladino populations (World
Bank(2004), pp. 59-63; see alsoThorp et al.(2006)). Major reforms were enacted during
the brief democratic period from 1944 to 1954, including passage of the 1945 constitution which was the first to provide for specific rights to indigenous peoples. Still, according to the 1979 agricultural census, Guatemala’s Gini Index for land distribution was 85.9, surpassed only by two Latin American countries - pre-reform Peru in 1961 and pre-reform
Colombia in 1964 (World Bank(1995), p. 11). In contrast to other Latin American
coun-tries, unequal access to land has never been alleviated by a redistributive land reform (Macours(2014)).
The overthrow of Guatemala’s democratically elected leftist government in 1954 brought to power a series of military dictatorships. A long civil war between the government and leftist guerrillas, with support among the indigenous and ladino peasantry, began in November 1960 with a failed coup and ended in December 1996 with the signing of Peace Accords between the government and the Unidad Revolucionaria Nacional Guatemalteca
(URNG) (Carey (2004)). Indigenous populations were disproportionate victims of the
war; the Historical Clarification Commission (Comisi´on para el Esclarecimiento Hist´orico - CEH) found that among identified individual victims, 83.3 per cent were Maya and 16.5
per cent ladino (Comisi´on para el Esclarecimiento Hist´orico (1999a), p. 183). During
1981-83, the Guatemalan Army targeted the Maya as an internal enemy and base of support and recruitment for the guerrillas, on this basis conducting indiscriminate
mas-sacres (Comisi´on para el Esclarecimiento Hist´orico(1999b), p. 49). In the Ixil region of
Quich´e, 70-90 per cent of villages were razed (Comisi´on para el Esclarecimiento Hist´orico
(1999b), p. 50). The disproportionate impact of the war on some indigenous communi-ties - in particular, the Ixil, Achi, Chuj, and Q’anjobo’al – is documented by the CEH (Comisi´on para el Esclarecimiento Hist´orico(1999a), p. 186).
According to Smith (1991)’s classic statement on Maya nationalism, it ‘became an
identifiable cause in the early 1970s, was quiescent during the violence, and today is emerging as a real political movement - partly as a radical alternative to the traditional
Left’ (p. 29; see alsoBastos and Camus(2003)). The early timeline then for indigenous social movement formation in Guatemala is broadly similar to that in other Latin American
countries (Van Cott(1995); Brysk(2000); Yashar(2005)). From the mid- to late-1980s,
asWarren(1998) documents, the Maya movement took a leading role during Guatemala’s
peace process in support of educational and judicial reform, as well as of official
recog-nition of the country’s status as a multiethnic, multilingual, and multicultural nation, a point recognised for the first time in the Peace Accords via the Agreement on Identity and
Rights of Indigenous Peoples (see alsoVan Cott(2000);Sieder(2007);Brett(2008)).
Despite these early advances, the indigenous movement subsequently had noticeably less influence in national politics in Guatemala than in other Latin American countries (Yashar(1999);Madrid(2012);Muj Garc´ıa(2012);Pallister(2013);Vogt(2015)). Guatemala has not elected an indigenous president, indigenous political parties have been compara-tively weak and none have won significant shares in national polls, and there are no quotas or reserved seats for indigenous representatives. The weakness of indigenous politics at the national level in Guatemala is puzzling for a number of reasons, not least because it has the second largest indigenous population by percentage in the region, after Bolivia.
Moreover, in the context of the literature on indigenous politics, asPallister(2013)
sum-marises, Guatemala also had many of the conditions identified as conducive to indigenous party formation: a prominent indigenous social movement, a fragmented and weak party system with relatively low barriers to entry, relatively weak competition from the left, and regional models to emulate from Bolivia and Ecuador (p. 125).
One proximate cause for the loss of momentum by the indigenous movement can be seen in the 1999 national referendum on constitutional reforms, during which indigenous leaders organised as the Indigenous Commission for Constitutional Reforms in support of various rights for indigenous populations. A centrepiece of the indigenous movement, the
‘No’ vote in the referendum was a major defeat (Muj Garc´ıa(2012), p. 5). More broadly,
the literature points to the fragmentation and localism of indigenous social movements, highlighting the persistence of socio-political divisions within the indigenous population (Madrid(2012);Yashar(1999)), rooted both in the cultural, linguistic, and religious
diver-sity of the indigenous population (Pallister (2013)) and in legacies of violence and state
strategies of divide and rule (Vogt(2015)). An additional factor,Pallister(2013) argues,
may be the existence of alternative avenues for indigenous representation at the municipal level which have supported a bifurcated system in which the majority of indigenous mu-nicipalities are now led by indigenous mayors and councils while party leadership at the national and departmental levels is primarily ladino. Exactly why indigenous mobilisation
at the local level has not been scaled up remains puzzling, however. Van Cott (2007))’s
work shows that in other contexts such as Bolivia and Ecuador, indigenous mobilisation at the local level served as a stepping stone to national party mobilisation, rather than an
inhibitor. Pallister(2013) offers one explanation highlighting both the salience of local identities and institutional rules (in particular, the role of ‘civic committees’ in Guatemala, through which candidates can contest municipal elections, but not elections at other levels, as in Bolivia and Ecuador).
The socio-political fragmentation of the indigenous community highlighted in the pol-itics literature is also broadly consistent with ethnographic accounts, which document the diversity and localism of Guatemalan indigenous communities before, during, and after the
civil war (see, e.g.,Wilson(1999)). One telling example of such diversity is that
Rigob-erta Mench´u, Guatemala’s best-known indigenous political activist, spoke only Quich´e until she was twenty and then learned Spanish and other Mayan languages because of her
involvement in the campesino movement (Caudillo F´elix(1998), p. 113). Regional
diver-sity more generally is underscored byKlick(2016)’s qualitative and quantitative analysis
of local governance and human development outcomes in Guatemala’s 334 municipalities, which shows wide variability among indigenous communities, even across short distances.
3
Related literature
Related quantitative research in Guatemala to date has focused largely on indigenous as
compared to ladino populations. Cabrera et al.(2015), for instance, explore linkages
be-tween fiscal policy, inequality, and the divide bebe-tween indigenous and non-indigenous
pop-ulations. Ishida et al.(2012) document disparities between indigenous and ladina women
in the use of reproductive health services using nationally-representative data from the
2008-2009 National Survey of Maternal and Infant Health (ENSMI).Chamarbagwala and
Mor´an (2011) find a strong negative impact of the civil war on the education of Maya
individuals.World Bank(1995) used 1989 data showing the probability of being poor
de-fined in terms of consumption is related to schooling, age, region, and indigenous status.
Controlling for education and other variables, the marginal effect of indigenous status on
the probability of being poor is estimated at 15.42 per cent (pp. 7-8; table 1.6).
Several studies have investigated educational and wage differentials among indigenous
and non-indigenous populations. Particularly relevant to this study isSteele(1994), which
uses data from the 1989 National Demographic Survey (Encuesta Nacional Socio-Demografica - ENSD) to document inequalities between indigenous and ladino popula-tions in terms of poverty, the distribution of public services, years of schooling, literacy, child labour, occupation, and income. Using the Oaxaca method, analysis suggests that a
significant share of earnings differentials between indigenous and ladino workers cannot
not be attributed to differences in human capital (see also Psacharopoulos (1993)). For
estimates of discrimination (Steele(1994), p. 125).
Using more recent household surveys for Bolivia, Ecuador, and Guatemala, Canelas
and Salazar(2014) show that in the three countries, indigenous workers are paid less than
non-indigenous workers and that nearly half of the wage gap is explained by differences
in human capital endowments. Similarly,Atal et al.(2009) using data for 18 Latin
Ameri-cans countries, found that ethnic wage differences are greater than gender differences and
that educational attainment differentials play an important role in explaining the gap. In
particular, an important share of the ethnic wage gap is due to the scarcity of minorities in
high-paid positions.Hall and Patrinos(2004), using data for Bolivia, Ecuador, Guatemala,
Mexico, and Peru, have also documented a sizable unexplained earnings gap between
in-digenous and non-inin-digenous populations, as well as large differences in educational
at-tainment and access to health services.Cunningham and Jacobsen(2008) analyse data for
Bolivia, Brazil, Guatemala, and Guyana and use simulations to show that within-group (rather than between-group) inequality is the main contributor to overall earnings
inequal-ity. They explore inequalities on the basis of gender, as well as dominant/subordinate
ethnic status, defined by race in Brazil and Guyana and by indigeneity in Bolivia and
Guatemala. Departing from the previous studies,Patrinos(1997) divides the Guatemalan
indigenous sample into the main ethnic groups and finds that in 1989 different ethnicities
presented widely different and dramatic results in terms of schooling, earnings, and returns
to schooling.
In the context of this work, this paper makes three contributions to the literature on horizontal inequalities, education, and labour market outcomes in Latin America, and in Guatemala specifically. First, in addition to documenting inequalities between indigenous and ladino populations, it shows significant inequalities across indigenous ethnic groups (e.g., Quich´e, Kekch´ı, Mam). This analysis is informed by and speaks to findings in the related anthropological and political science literature which suggest the continuing relevance to socio-political outcomes of ethnic and ‘local’ identities within the broader in-digenous category. Our findings suggest their relevance also to socio-economic outcomes (which in turn may relate to socio-political outcomes). While some such inequalities have
been documented in previous work through examination of wage differentials at the mean
(Patrinos(1997)), our analysis also investigates variation in wages across the entire wage
distribution. Further, we examine differences in educational attainment, primary school
completion, and school entry age among Guatemalan children.
Second, we use more recent data than prior studies. As suggested above, much of the extant quantitative literature on Guatemala draws on survey data from 1989 or 2000, i.e., either during the civil war or shortly thereafter. By drawing on the 2000 and 2011 waves of the Guatemalan living standards surveys, we more fully capture the significant socio-economic changes that took place in Guatemala in the fifteen years since the war, as well
as in Latin America more broadly since the late 1990s.
Finally, the paper explores the implications of this empirical analysis for broader the-ories of ethnic and indigenous politics. In particular, it considers the relevance to broader understanding of the puzzling weakness of indigenous political mobilisation in Guatemala at the national level as compared to other Latin American countries such as Bolivia.
4
Empirical specification
4.1
School enrolment
To examine differences in children’s school participation and educational progress over
time between ethnic groups, we estimate a set of probit regressions of the following form:
Yi∗= αi+ Xi βi+ εi, (1) Y = 1 Y∗> 0 0 otherwise
where Yi is the outcome of interest and Xi is a vector of individual child characteristics
and household variables that affect the child’s educational outcomes. The vector of
child-specific variables includes age, gender, and ethnic origin of the child (four dummy vari-ables for the dominant minority groups and one dummy for all other indigenous groups). We also include variables that control for the family’s demographic composition: whether the head of the household is female; number of children younger than 6 years; number of children (other than self) aged between 6-9, 10-14, and 15-18 years; number of female and male adults present in the home; and a set of variables that control for other family characteristics such as education of the household head, the presence of the mother in the household, the presence of the father in the household, and area of residence. Finally, we proxy household wealth with three dummies controlling for access to sanitation, electric-ity, and piped water.
We first examine schooling participation, then the age at which children enter for-mal schooling, and finally schooling completion. Our definition of schooling is based on whether the child is enrolled in school at the time of the survey. For the definition of the children’s age of entry into the formal school system, we create a dummy variable equal to
one if the child started school at age six or seven, the official entry age, and zero otherwise.
For the final measure, we use a subsample of children aged 15-17. We create a dummy variable equal to one if the child has completed primary school and zero otherwise.
4.2
Earnings di
fferentials
The standard procedure for analysing the determinants of earnings differentials for
differ-ent subpopulations is to model earnings functions for each group and apply the
Blinder-Oaxaca procedure. This method allows us to decompose the earnings differential at the
mean in two terms: one corresponding to the composition effect, which measures
differ-ences in the observed characteristics of the groups, and a second term representing the
wage structure effect, which accounts for the difference in returns between the groups.
In this paper, we employ a two-fold Blinder-Oaxaca procedure where we use coefficients
from a pooled regression with a group membership indicator, seeJann (2008). We then
apply a quantile decomposition method to study earning differences across the entire wage
distribution.
While a number of decomposition methods for parameters other than the mean have
been proposed in the literature (see Juhn et al. (1993), Machado and Mata (2005) and
Melly(2005)), we rely on the method proposed by Firpo et al. (2009) (FFL) because it
allows us to compute the effect of each covariate on the unconditional wage distribution.
Since the law of iterated expectations does not apply to quantiles, the idea underlying the FFL technique is that one can use the Recentered Influence Function (RIF), which
is a transformation of the outcome variable, to determine the effect of covariates on the
unconditional quantiles by using a conditional regression approach.
Let Y be labour earnings and Qτ the τ-quantile. The recentered influence function of
the τ-quantile of Y is given by:
RIF(Y, Qτ)= Qτ+ τ − 1{Y ≤ Qτ
}
fY(Qτ)
. (2)
where1{·} is an indicator function expressing whether the outcome variable is smaller or
equal to the quantile, and fY(·) is the density of the marginal distribution on Y evaluated
at the population τ-quantile of the unconditional distribution of Y. As indicating byFirpo
et al. (2009), the unconditional quantile regression Ey[RIF(Y, Qτ)|X], can be estimated
using a linear regression of the form:
RIF(Y, Qτ)= αi+ Xi βi+ εi, (3)
where Xiis a vector of covariates that determine labour earnings such as: age and gender of
the individual, educational attainment, area and region of residence, occupational category, and employment category , i.e. self-employment, casual labour, and salaried work.
After computing the RIF for each group, we perform a detailed decomposition in the same spirit of the classical Blinder-Oaxaca methodology by relying on the following
prop-erties: a) Ey[RIF(Y, Qτ)] = Qτ and b) Ex[Ey[RIF(Y, Qτ)|X]] = Qτ. As in the previous
5
Data and descriptive analysis
The analysis in this paper draws on individual level data from the 2000 and 2011 ENCOVI conducted by Guatemala’s National Statistics Institute (Instituto Nacional de Estad´ıstica Guatemala - INE). ENCOVI is a cross-sectional survey representative of the Guatemalan population. The survey contains detailed information on household demographics, health, education, occupation and labour force participation, housing and asset ownership, house-hold food and non-food expenditures, and income.
For the purposes of this paper, indigenous people are identified using a self-identification variable. While the sample does include a range of ethnic groups, we focus on four Mayan groups that have a relatively large presence (more than 5 per cent of the sample): Quich´e, Kekch´ı, Kakchiquel, and Mam. We aggregate all the other Mayan and non-Mayan groups
as ‘other-indigenous’.6 We use ‘ladino’ as the majority or dominant group.
For the analysis on educational outcomes, we restrict our data to children aged 7-17
years. Table 1 shows statistics on educational outcomes of interest for different ethnic
groups. A quick look at the table reveals an improvement in educational indicators be-tween 2000 and 2011 for all groups. In particular, the proportion of children aged 15-17 years that have completed primary education has almost doubled during the period of study. The table also suggests that after ladino children, Kakchiquel children have
tradi-tionally done better than any other indigenous group in Guatemala. TablesA.1andA.2in
the Appendix provide summary statistics for all variables used in the estimation.
Table 1: Educational outcomes statistics
Ladino Indigenous Quich´e Kekch´ı Kakchiquel Mam Other Indigenous Panel A: 2000
School attendance 0.74 0.60 0.59 0.50 0.64 0.63 0.62 School entry age 7.10 7.50 7.48 7.87 7.08 7.64 7.55 Primary completed 0.65 0.35 0.37 0.25 0.51 0.31 0.32 Panel B 2011
School attendance 0.81 0.79 0.78 0.82 0.78 0.78 0.77 School entry age 7.01 7.06 6.94 7.27 6.95 7.18 7.2 Primary completed 0.74 0.63 0.62 0.52 0.73 0.70 0.60
Source: Author’s calculation based on the ENCOVI 2000 and 2011. Primary completed computed for children 13+.
For the analysis on earnings differentials, we restrict our data to working individuals
aged 20-70 years. In the data, workers are classified as regular salaried, self-employed,
and casual labour. For salaried workers, wages can be paid in cash or in kind. For the latter case, we use the individual’s perceived value of the goods. Earnings are computed using labour income from primary occupation. Labour earnings are reported on a monthly basis at current prices for all workers. For this study, we deflate earnings to 2000 prices using the national consumer price index. We exclude from the sample non-paid family and non-family workers.
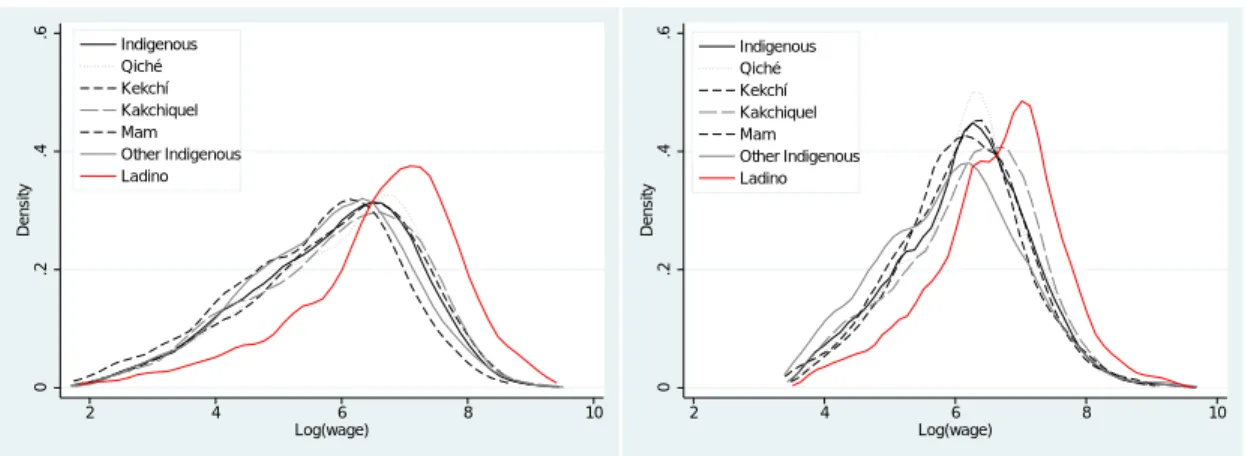
Figure 1 plots the kernel densities of the earnings distribution for six ethnic groups
in Guatemala. Overall, the figure shows that the distributions have shifted to the right over time and that they have become taller and thinner, suggesting a higher concentration
of earnings around the mean. However, earning differences between and within ethnic
groups still persist. In particular, at 2011 the distributions of all indigenous groups are still at the left of that of ladinos. Also, ethnic minorities grouped as ‘other indigenous’ show a significant concentration of workers in the lower tail of the distribution, as evidenced by two sizable bumps in the left part of the distribution.
Tables A.3-A.4 provide summary statistics of the data on individual and household
characteristics for the six ethnic groups for each sample year.
Figure 1: Kernel density of log real earnings, 2000 and 2011
0 .2 .4 .6 Density 2 4 6 8 10 Log(wage) Indigenous Qiché Kekchí Kakchiquel Mam Other Indigenous Ladino 0 .2 .4 .6 Density 2 4 6 8 10 Log(wage) Indigenous Qiché Kekchí Kakchiquel Mam Other Indigenous Ladino
Source: Authors’s calculation from ENCOVI 2000-11
6
Results
We begin the analysis by providing an overview of horizontal inequalities among ethnic
groups over time. For this purpose, building on Stewart (2008), we rely on the Group
Coefficient and the Theil Index weighted by the size of the population subgroups.7 The
outcomes of interest are labour earnings and years of schooling, so the indices can be interpreted as a measure of concentration of the total stock of any of the outcomes in one ethnic group. For instance, looking at education, a GGINI of zero would mean that all ethnic groups have the same mean years of schooling, while a GGINI of one would correspond to a situation where one ethnic group has exclusive access to all the education in the country.
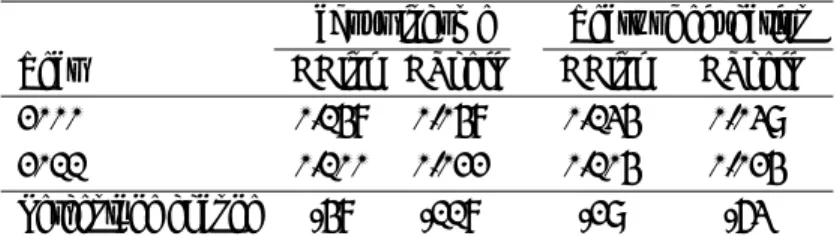
Table 2 shows that from 2000 to 2011 HI in labour earnings and years of education
decreased. While by construction, both indices provided different values, the rank of the
measures remains the same in both cases, confirming an overall decrease of horizontal inequalities in the country.
Table 2: Horizontal inequality measures
Labour income Years of education
Year GGini GTheil GGini GTheil
2000 0.148 0.048 0.134 0.039
2011 0.100 0.022 0.104 0.024
Percentage change -48 -118 -29 -63
Source: Author’s calculation based on the ENCOVI 2000 and 2011.
6.1
School enrolment
Table 3 provides the estimates of the probit models for all educational outcomes under
study. We focus on the results of the variables of interest, i.e. the ethnicity variables. Complete estimations are available in the Appendix. Panel A of the table shows the results for the 2000 sample and Panel B those of 2011. There are some interesting results that deserve particular attention: first, inequalities in schooling outcomes with respect to the majority group have decreased for all ethnic groups between 2000 and 2011. In fact, by
2011 differences in the probability of school attendance and the age at which children enter
the formal school system are not statistically significant for most ethnic groups, suggesting an overall positive trend towards equality in educational outcomes across ethnicities in Guatemala. However, not all groups seem to have benefited equally during the period of analysis.
7Stewart(2008) make a case for three aggregated measures of horizontal inequality, the GGINI, GTheil, and group-weighted coefficient of variation (GCOV).
Table 3: Educational outcomes. Probit models (marginal effects)
Indigenous Quich´e Kekch´ı Kakchiquel Mam Other Indigenous
Panel A: 2000
School attendance -0.040*** -0.066*** -0.082*** -0.079*** 0.018 0.031
(0.014) (0.022) (0.028) (0.027) (0.023) (0.019)
School entry age -0.113*** -0.062* -0.120*** -0.115*** -0.122*** -0.143***
(0.026) (0.037) (0.048) (0.040) (0.044) (0.034) Primary completed -0.108*** -0.107*** -0.147*** -0.079*** -0.132*** -0.093*** (0.014) (0.022) (0.027) (0.024) (0.023) (0.020) Panel B: 2011 School attendance -0.016 -0.018 0.026 -0.040*** -0.013 -0.011 (0.010) (0.014) (0.016) (0.016) (0.019) (0.019)
School entry age -0.023 -0.073*** -0.020 -0.010 0.043 -0.008
(0.020) (0.030) (0.041) (0.034) (0.039) (0.034)
Primary completed -0.041*** -0.038*** -0.057*** -0.030* -0.082*** -0.029***
(0.008) (0.013) (0.018) (0.016) (0.018) (0.015)
Note: Standard errors in parenthesis. Significance level at *p<0.05, **p<0.01, ***p<0.001
Second, the aggregated indigenous variable underestimates remaining differences in
education for the most disadvantaged groups. For instance, while by 2011 the marginal
effect of the indigenous dummy reports a not statistically significant effect of ethnicity
on whether children enter the school system at the formal age, i.e. 6-7 years, the more disaggregated analysis shows that while this is true for most ethnic groups, Quich´e children are still 7 per cent less likely to start school at the formal age than ladino children. To the extent that late entrance into the school system has been positively associated with a higher probability of school dropout, Quich´e children are still quite disadvantaged in this respect. Third, the impact of ethnicity on the probability of having completed primary school education by the age of 15-17 years is negative and significant for all ethnic groups in both years, suggesting that in spite of significant amelioration of school indicators, indigenous in Guatemala are still falling behind the dominant group.
6.2
Earnings di
fferentials
We start by providing the results from the Blinder-Oaxaca decomposition for each ethnic
group and sample year in Table4. The first row of each panel shows the gap at the mean.
The second row shows the amount of the gap that it is explained, i.e. the part due to di
ffer-ences in the observed characteristics of the groups. The third row shows the unexplained
part, which accounts for the difference in returns between the groups. The first point to
no-tice, is that there was an average reduction of 0.244 log points of the earnings gap between
the explained part of the gap. The detailed decomposition in TableA.6 in the Appendix shows that the reduction is particularly due to higher endowments in terms of education for the indigenous group but also to an increase of the share of indigenous people among salaried workers.
Table 4: Blinder-Oaxaca decomposition
Indigenous Quich´e Kekch´ı Kakchiquel Mam Other Indigenous Panel A: 2000
Total Gap 0.747 0.639 0.683 0.684 1.058 0.830 Explained 0.448 0.529 0.482 0.294 0.663 0.501 Unexplained 0.298 0.109 0.200 0.389 0.395 0.328
Adding employment characteristics
Total Gap 0.747 0.639 0.683 0.684 1.058 0.830 Explained 0.579 0.564 0.590 0.485 0.865 0.579 Unexplained 0.168 0.075 0.093 0.199 0.194 0.251 Panel B: 2011 Total Gap 0.503 0.464 0.503 0.427 0.565 0.702 Explained 0.270 0.344 0.387 0.075 0.407 0.417 Unexplained 0.231 0.119 0.108 0.350 0.156 0.285
Adding employment characteristics
Total Gap 0.503 0.464 0.503 0.427 0.565 0.702 Explained 0.373 0.363 0.373 0.196 0.566 0.544 Unexplained 0.130 0.101 0.129 0.231 -0.002 0.158
Note: Author’s calculation based on the ENCOVI 2000 and 2011.
Figure2examines the changes in earnings inequality by plotting the differences in log
labour earnings between indigenous people and ladinos for different percentiles of their
earnings distributions for 2000 and 2011. The red line corresponds to the mean difference.
The dashed lines correspond to two standard deviations from the mean. The figure high-lights a sizable decline in the labour earnings gaps over time across the distribution, with the mean value moving from 0.75 in 2000 to 0.5 in 2011. Further, one can clearly see that
the earnings differentials are considerably greater for the lower percentiles of the earnings
distribution, in particular between the 10th and 30th percentile, and narrower after the mean, suggesting the existence of ‘sticky floors’ for indigenous workers in Guatemala.
Table5shows the results of the decomposition across the wage distribution for the
ag-gregated indigenous group and the Quich´e, Kekch´ı, Kakchiquel, Mam, and other
and job characteristics for the same groups. TablesA.5andA.6in the Appendix, show the relative contribution of each group of control variables to the explained part of the gap.
Figure 2: Earnings differential by quantile, 2000 and 2011
0 .25 .5 .75 1 1.25
Log Wage Differential
0 .2 .4 .6 .8 1 Quantile 0 .25 .5 .75 1 1.25
Log Wage Differential
0 .2 .4 .6 .8 1
Quantile
Source: Authors’s calculation from ENCOVI 2000-11
Overall, we see that all indigenous ethnic groups experience earnings gaps with respect to ladinos at the mean and across the earnings distribution; we also see that most of the
gap is due to differences in observed characteristics like educational attainment and area of
residence, which raises questions about the persistence of education gaps for indigenous populations, despite improvements in some schooling outcomes. Further, once we add to the list of control variables employment characteristics, we see that occupational distri-bution accounts for the majority of the explained part of the wage gap, suggesting that it is the type of job that indigenous people end up with, either by selection into or limited
access to other kind of jobs, that mostly determines the earning differences among ethnic
groups. In fact, at the lowest percentiles of the distribution, the over-representation of the Quich´e, Kekch´ı, and Mam ethnic groups among skilled agricultural workers plays a bigger role than educational attainment explaining the gap. This point is of particular importance given the ethnic distribution of labour established in colonial times and later exacerbated
with the expansion of coffee plantations, where indigenous people provided both the
colo-nial and liberal state with important sources of cheap labour,Caumartin(2005).
From a more specific point of view, we see that the proportions of the explained part of the gap are high for all minority groups except the Kakchiquel. In most cases between 70 and 100 per cent of the gap is explained, while for the Kakchiquel group the unex-plained part of the gap is higher, in particular at the lowest quantiles of the distribution. In summary, ethnic groups show very distinctive patterns of wages and wage gaps.
Table 5: RIF- OLS regressions
Ethnic Wage Gap in 2000 Ethnic Wage Gap in 2011
Quantile 0.10 0.25 0.50 0.75 0.90 0.10 0.25 0.50 0.75 0.90 Indigenous Difference 0.601 0.967 0.746 0.666 0.655 0.590 0.597 0.516 0.466 0.410 Explained 0.334 0.456 0.482 0.506 0.510 0.228 0.226 0.289 0.342 0.326 Unexplained 0.267 0.511 0.264 0.160 0.144 0.362 0.370 0.226 0.124 0.084 Quich´e Difference 0.503 0.790 0.612 0.506 0.616 0.442 0.490 0.467 0.495 0.380 Explained 0.599 0.608 0.562 0.516 0.455 0.375 0.346 0.385 0.363 0.322 Unexplained -0.095 0.181 0.050 -0.010 0.161 0.066 0.144 0.082 0.131 0.057 Kekch´ı Difference 0.525 0.800 0.723 0.605 0.582 0.407 0.530 0.599 0.518 0.519 Explained 0.324 0.592 0.553 0.458 0.487 0.398 0.362 0.494 0.385 0.327 Unexplained 0.201 0.208 0.169 0.146 0.009 0.009 0.167 0.104 0.133 0.192 Kakchiquel Difference 0.597 0.969 0.768 0.547 0.522 0.564 0.500 0.456 0.332 0.365 Explained 0.151 0.179 0.296 0.405 0.404 -0.056 -0.001 0.048 0.179 0.213 Unexplained 0.445 0.789 0.472 0.141 0.118 0.621 0.501 0.407 0.152 0.152 Mam Difference 0.965 1.268 1.092 1.068 0.905 0.569 0.664 0.598 0.617 0.464 Explained 0.815 0.804 0.689 0.615 0.583 0.453 0.386 0.461 0.411 0.395 Unexplained 0.150 0.464 0.403 0.453 0.321 0.115 0.278 0.136 0.205 0.069 Other Indigenous Difference 0.570 1.049 0.884 0.777 0.725 0.819 0.937 0.718 0.590 0.498 Explained 0.532 0.639 0.509 0.480 0.496 0.486 0.436 0.478 0.397 0.356 Unexplained 0.038 0.410 0.375 0.297 0.229 0.333 0.501 0.239 0.192 0.142
Table 6: RIF- OLS regressions with employment characteristics
Ethnic Wage Gap in 2000 Ethnic Wage Gap in 2011
Quantile 0.10 0.25 0.50 0.75 0.90 0.10 0.25 0.50 0.75 0.90 Indigenous Difference 0.602 0.968 0.747 0.667 0.655 0.590 0.597 0.516 0.466 0.411 Explained 0.576 0.680 0.626 0.569 0.533 0.455 0.407 0.393 0.382 0.333 Unexplained 0.026 0.287 0.121 0.098 0.122 0.136 0.190 0.123 0.084 0.078 Quich´e Difference 0.504 0.790 0.612 0.507 0.617 0.442 0.490 0.468 0.495 0.380 Explained 0.700 0.679 0.579 0.514 0.459 0.420 0.391 0.408 0.360 0.316 Unexplained -0.196 0.111 0.033 -0.007 0.158 0.022 0.099 0.060 0.135 0.064 Kekch´ı Difference 0.526 0.801 0.723 0.606 0.583 0.590 0.597 0.516 0.466 0.411 Explained 0.610 0.801 0.647 0.483 0.502 0.455 0.407 0.393 0.382 0.333 Unexplained -0.085 0.000 0.076 0.123 0.081 0.136 0.190 0.123 0.084 0.078 Kakchiquel Difference 0.597 0.684 0.769 0.547 0.523 0.565 0.500 0.456 0.333 0.366 Explained 0.567 0.485 0.495 0.482 0.426 0.244 0.219 0.172 0.205 0.204 Unexplained 0.030 0.199 0.274 0.065 0.097 0.320 0.282 0.284 0.127 0.162 Mam Difference 0.966 1.269 1.092 1.069 0.913 0.569 0.665 0.599 0.618 0.465 Explained 1.321 1.215 0.888 0.655 0.570 0.822 0.663 0.635 0.450 0.392 Unexplained -0.355 0.054 0.204 0.414 0.343 -0.253 0.001 -0.036 0.168 0.073 Other Indigenous Difference 0.571 1.050 0.885 0.778 0.726 0.820 0.938 0.718 0.591 0.499 Explained 0.701 0.770 0.591 0.513 0.514 0.804 0.652 0.596 0.436 0.366 Unexplained -0.130 0.280 0.293 0.265 0.212 0.016 0.286 0.122 0.155 0.133
7
Discussion
These results suggest several broader implications and related avenues for future research. For one, consistent with the (non-economic) literature on ethnic politics in Guatemala that we explore above, these results underscore the relevance of diversity within the indigenous population to an understanding of horizontal inequality and ethnic politics in the country. In terms of future economic analyses on these topics for Guatemala, our findings suggest
that the focus on the indigenous/non-indigenous divide found in much of the extant
liter-ature may obscure meaningful diversity within the indigenous population and that future work should consider further disaggregation of ethnic categories along the lines devel-oped here. Such disaggregation also should be considered in related work on other Latin American contexts (as we discuss further below).
Our findings further offer additional evidence on the nature of this diversity, beyond
that discussed in existing work. While the extant literature in political science and an-thropology draws mainly on qualitative data, our analysis presents quantitative data drawn from nationally-representative surveys. While the extant literature focuses largely on di-versity and division in sociopolitical terms, our analysis documents how ethnic boundaries
within the indigenous population are marked additionally by socioeconomic differences
apparent in educational and labour market outcomes.
How exactly socioeconomic diversity relates to sociopolitical division is another im-portant question for future research. Further work in this area, in our view, has potential relevance to broader theories of ethnic politics in particular. Put another way, as reviewed above, the weakness of indigenous representation at the national-level in Guatemalan pol-itics is a puzzle in light of what we know about indigenous polpol-itics elsewhere in Latin America. Previous literature attributes this weakness largely to the localism and diversity of Guatemala’s indigenous communities, which in turn is linked to its comparative cul-tural, linguistic, and religious diversity; legacies of violent divide and rule; and possibly to institutional incentives in the electoral system. But the extent to which this explanation relies on explaining sociopolitical division through sociopolitical diversity is somewhat unsatisfying.
We posit that the socioeconomic inequality among indigenous groups documented
here, in combination with the number and sizes of groups, can offer new leverage on
understanding the puzzling weakness of national indigenous politics in Guatemala. Such socioeconomic diversity and inequality, we hypothesise, serves to dampen collective ac-tion along ‘indigenous’ lines, given dissimilarities in the experiences and incentives of members of indigenous ethnic groups. In such situations, socio-economic class may be a more unifying cleavage around which to mobilise in the national political arena, even for ‘indigenous’ individuals. This would appear broadly consistent with the observation that
indigenous leaders have tended to place their support behind leftist parties at the national level in Guatemala.
Moreover, simply in terms of numbers and sizes of groups, Guatemala’s indigenous population in comparison to other Latin American countries’, seems to be notably frac-tionalised. In Bolivia, for instance, where over 60 per cent of the population self-identified as indigenous in 2001 census, the vast majority of the indigenous population falls into one of two language groups, Quechua and Aymara. In comparison to Guatemala, where the largest indigenous language group, Quich´e, is only 8-13 per cent, in Bolivia, the two largest groups were 31 and 25 per cent of the population respectively. To explore this hy-pothesis more fully, future work would need to provide systematic cross-national compar-ison of this sort of ‘nested’ or sub-group fractionalisation, along with comparative analysis of horizontal inequalities among the same groups.
A further avenue for future research relates to more disaggregated consideration of the structural and institutional roots of such disaggregated horizontal inequality. The literature on indigenous politics in Latin America focuses in considerable depth on the roots of inequality between indigenous and non-indigenous populations, but has devoted much
less attention to differing experiences among indigenous communities. We expect, among
other factors, the geographic location of groups and the structural bases of the economy to influence enduring diversity within the indigenous population. We also would look in particular to relations with colonial and post-colonial states (a blatant example of which is the disproportionate violence against particular indigenous groups by the Guatemalan military during the civil war). These two factors might in turn go together. In Bolivia, for instance, the agrarian reform after the 1952 national revolution influenced relationships to production and especially in the western highlands served to convert indigenous ‘peasants’ into strong supporters of the ruling party.
More specifically, our results as detailed above raise several related questions for future research. One set of questions - for which interdisciplinary collaboration might be partic-ularly useful - concerns the factors and causal processes underlying the specific variation illustrated in educational and labour market outcomes among indigenous ethnic groups. Why, for instance, as the gap between indigenous and ladino children in school entry has narrowed overall, do we see Quich´e children in particular lagging behind? In looking at earnings gaps, what factors explain the results for those self-identifying as Kakchiquel? Is
there a more general explanation for the distinctive wage patterns observed for different
groups? As above, we hypothesise that multiple factors are at work - including the ge-ographic location of groups, historical ethnic and regional stratification of the economy,
and differential legacies of civil war violence - but further research is needed.
Finally, from a policy standpoint, our results also speak to the promise - and limits
countries. It is worth noting that progress toward addressing educational inequality goes a significant way toward supporting more equal wage outcomes, but at the same time the persistence of wage inequalities highlights the need to address additional factors, such as discrimination in the labour market. Moreover, the fact that gaps in educational and labour market outcomes remain higher for some indigenous ethnic groups than others suggests the need for continued policy attention to addressing the needs of disadvantaged populations in a disaggregated way.
8
Conclusion
Guatemala is an important case for the understanding of ethnic politics and horizontal in-equality, both in Latin America and beyond. While the economic literature to date has documented the depth of horizontal inequalities between indigenous and non-indigenous Guatemalans, it has not fully considered the diversity within the indigenous population. Work in political science and anthropology on the other hand point to this diversity as important in understanding ethnic politics in the country, including the otherwise puzzling weakness of national indigenous mobilisation. This paper builds from both of these bod-ies of work, drawing on new analysis of individual-level data from the 2000 and 2011 ENCOVI survey to consider inequalities in educational and labour market outcomes be-tween both ladino populations and indigenous populations and bebe-tween ladino and di-verse indigenous ethnic groups. Further, in analysing educational outcomes, we focus on
Guatemalan children. And, while wage differentials at the mean have been documented
in previous work for Guatemala, our analysis investigates variation across the entire wage distribution. The analysis documents a number of empirical patterns and explores the implications of these findings for understanding horizontal inequality and ethnic politics more broadly.
References
Atal, J. P., ˜Nopo, H., and Winder, N. (2009). New Century, Old Disparities. Gender and
Ethnic Wage Gaps in Latin America. Working Paper No. 109. Inter-American Develop-ment Bank.
Bastos, S. and Camus, M. (2003). El Movimiento Maya en Perspectiva. Guatemala: FLASCO.
Brett, R. (2008). Social Movements, Indigenous Politics and Democratisation in Guatemala, 1985-1996. Leiden: Brill.
Brysk, A. (2000). From Tribal Village to Global Village: Indian Rights and International Relations in Latin America. Stanford: Stanford University Press.
Cabrera, M., Lustig, N., and Moran, H. E. (2015). Fiscal Policy, Inequality, and the Ethnic Divide in Guatemala. World Development, (76):263–279.
Canelas, C. and Salazar, S. (2014). Gender and Ethnic Inequalities in LAC Countries. IZA
Journal of Labor& Development, 3(1):18.
Carey, D. (2004). Maya Perspectives on the 1999 Referendum in Guatemala: Ethnic Equality Rejected? Latin American Perspectives, 31(6):69–95.
Caudillo F´elix, G. A. (1998). Aproximacion al discurso de Rigoberta Mench´u. Espiral, Estudios sobre Estado y Sociedad, 13(5):112–141.
Caumartin, C. (2005). Racism, Violence, and Inequality: An Overview of the Guatemalan Case. CRISE Working Paper No. 11. University of Oxford.
Chamarbagwala, R. and Mor´an, H. E. (2011). The human capital consequences of civil war: Evidence from guatemala. Journal of Development Economics, 94(1):41 – 61. Comisi´on para el Esclarecimiento Hist´orico (1999a). Guatemala, Memoria del Silencio.
Guatemala: UNOPS.
Comisi´on para el Esclarecimiento Hist´orico (1999b). Guatemala, Memoria del Silencio. Conclusiones y Recomendaciones. Guatemala: UNOPS.
Cunningham, W. and Jacobsen, J. P. (2008). Earnings inequality within and across gender, racial, and ethnic groups in four Latin American Countries. Policy Research Working Paper Series 4591, The World Bank.
Firpo, S., Fortin, N. M., and Lemieux, T. (2009). Unconditional Quantile Regressions. Econometrica, 77(3):953–973.
Gonzalez, M. L. (1994). How Many Indigenous People? In Psacharopoulos, G. and
Patrinos, H. A., editors, Indigenous People and Poverty in Latin America , pages 21–39. Washington DC: World Bank.
Hall, G. and Patrinos, H. A. (2004). Indigenous Peoples, Poverty and Human Development in Latin America. The World Bank.
Ishida, K., Stupp, P., Turcios-Ruiz, R., William, D. B., and Espinoza, E. (2012). Ethnic Inequality in Guatemalan Women’s Use of Modern Reproductive Health Care. Interna-tional Perspectives on Sexual and Reproductive Health, 38(2):99–108.
Jann, B. (2008). A Stata Implementation of the Blinder-Oaxaca Decomposition. ETH Zurich Sociology Working Papers.
Juhn, C., Murphy, K. M., and Pierce, B. (1993). Wage Inequality and the Rise in Returns to Skill. Journal of Political Economy, 101(3):410–442.
Klick, M. T. (2016). The Effect of State-Local Complementarity and Local Governance on
Development: A Comparative Analysis from Post-War Guatemala. World Development, (82):1–13.
Lewis, M. P., Simons, G. F., and Fenning, C. D. (2016). Ethnologue: Languages of the World, Nineteenth Edition. Dallas, TX: SIL International, 19th edition.
Machado, J. A. F. and Mata, J. (2005). Counterfactual Decomposition of Changes in Wage Distributions Using Quantile Regression. Journal of Applied Econometrics, 20(4):445– 465.
Macours, K. (2014). Ethnic Divisions, Contract Choice, and Search Costs in the
Guatemalan Land Rental Market. Journal of Comparative Economics, 42(1):1 – 18. Madrid, R. L. (2012). The Rise of Ethnic Politics in Latin America. Cambridge: Cambridge
University Press.
Melly, B. (2005). Decomposition of Differences in Distribution Using Quantile
Regres-sion. Labour Economics, 12(4):577–590.
Muj Garc´ıa, M. L. (2012). Political Representation Social Inclusion: Guatemala Case Study. In Agrawal, N., Andr´e, R., Berger, R., Escarfuller, W., and Sabatini, C., editors, Political Representation Social Inclusion: A Comparative Study of Bolivia, Colombia, Ecuador, and Guatemala. New York: Americas Society and Council of the Americas. Pallister, K. (2013). Why No Mayan Party? Indigenous Movements and National Politics
in Guatemala. Latin American Politics and Society, 55(3):117–138.
Patrinos, H. A. (1997). Differences in Education and Earnings Across Ethnic Groups in
Guatemala. The Quarterly Review of Economics and Finance, 37(4):809 – 821.
Psacharopoulos, G. (1993). Ethnicity, Education, and Earnings in Bolivia and Guatemala. Comparative Education Review, 37(1):9–20.
Sieder, R. (2007). The judiciary and indigenous rights in guatemala. International Journal of Constitutional Law, 5(2):211.
Smith, C. (1991). Maya Nationalism. Report on the Americas, 25(3):29–46.
Steele, D. (1994). Guatemala. In Psacharopoulos, G. and Patrinos, H. A., editors,
In-digenous People and Poverty in Latin America, pages 97–126. Washington DC: World
Bank.
Stewart, F. (2008). Horizontal Inequalities and Conflict: Understanding Group Violence in Multiethnic Societies. Basingstoke, Hampshire: Palgrave Macmillan.
Thorp, R., Caumartin, C., and Gray-Molina, G. (2006). Inequality, Ethnicity, Political Mobilisation and Political Violence in Latin America: The Cases of Bolivia, Guatemala and Peru. Bulletin of Latin American Research, 25(4):453–480.
Van Cott, D. L. (1995). Indigenous Peoples and Democracy in Latin America. New York: St. Martin’s Press.
Van Cott, D. L. (2000). Latin america: Constitutional reform and ethnic right. Parliamen-tary Affairs, 53(1):41.
Van Cott, D. L. (2007). From Movements to Parties in Latin America: The Evolution of Ethnic Politics. Cambridge: Cambridge University Press.
Vogt, M. (2015). The Disarticulated Movement: Barriers to Maya Mobilization in Post-Conflict Guatemala. Latin American Politics and Society, 57(1):29–50.
Warren, K. B. (1998). Indigenous Movements and Their Critics: Pan-Maya Activism in Guatemala. Princeton: Princeton University Press.
Wilson, R. (1999). Maya Resurgence in Guatemala: Q’eqchi’ Experiences. Norman: University of Oklahoma Press.
World Bank (1995). Guatemala: An Assessment of Poverty. Poverty Assessment 12313-GU, The World Bank.
World Bank (2004). Poverty in Guatemala. A World Bank Country Study 27586, The World Bank.
Yashar, D. J. (1999). Democracy, indigenous movements, and the postliberal challenge in latin america. World Politics, 52(1):76–104.
Yashar, D. J. (2005). Contesting Citizenship: Indigenous Movements and the Postliberal Challenge in Latin America. Cambridge University Press.
AppendixA
T able A.1: Descripti v e statistics 2000 (children aged 7-17 years) Ladino Indigenous Quich ´e K ekch ´ı Kakchiquel Mam Other Indigenous V ariable Mean Std. De v. Mean Std. De v. Mean Std. De v. Mean Std. De v. Mean Std. De v. Mean Std. De v. Mean Std. De v. Age 11.67 3.15 11.63 3.14 11.64 3.19 11.72 3.12 11.55 3.09 11.49 3.16 11.70 3.13 School attendance 0.74 0.44 0.60 0.49 0.59 0.49 0.50 0.50 0.64 0.48 0.63 0.48 0.62 0.49 Gender (male = 1) 0.53 0.50 0.50 0.50 0.50 0.50 0.53 0.50 0.51 0.50 0.48 0.50 0.51 0.50 First born 0.45 0.50 0.40 0.49 0.41 0.49 0.39 0.49 0.42 0.49 0.39 0.49 0.40 0.49 Last born 0.30 0.46 0.29 0.46 0.29 0.46 0.28 0.45 0.29 0.45 0.29 0.45 0.31 0.46 Mother in hhold 0.91 0.29 0.92 0.28 0.91 0.28 0.90 0.30 0.95 0.21 0.90 0.30 0.91 0.28 F ather in hhold 0.74 0.44 0.80 0.40 0.76 0.43 0.83 0.37 0.84 0.37 0.76 0.43 0.79 0.41 Hh li ving in couple 0.84 0.36 0.89 0.31 0.88 0.33 0.91 0.29 0.87 0.33 0.89 0.31 0.91 0.28 Hh education in years 4.01 4.14 1.89 2.75 1.79 2.64 1.64 2.72 2.70 2.97 1.34 2.28 1.84 2.79 Household size 6.76 2.41 7.60 2.43 7.60 2.64 7.97 2.50 7.24 2.16 7.45 2.18 7.69 2.51 No children aged 0-5 0.97 1.10 1.38 1.19 1.39 1.30 1.47 1.17 1.27 1.14 1.38 1.13 1.39 1.19 No children aged 6-9 0.71 0.77 0.88 0.80 0.84 0.80 0.94 0.83 0.82 0.76 0.96 0.81 0.86 0.81 No children aged 10-14 0.92 0.84 1.03 0.82 1.02 0.84 1.04 0.79 1.03 0.83 1.08 0.83 1.02 0.80 No children aged 15-18 0.46 0.64 0.56 0.71 0.62 0.77 0.63 0.70 0.46 0.65 0.52 0.67 0.56 0.74 No female adults (19 + ) 1.43 0.75 1.44 0.73 1.46 0.80 1.40 0.64 1.36 0.69 1.40 0.68 1.51 0.77 No male adults (19 + ) 1.27 0.82 1.31 0.80 1.26 0.79 1.48 0.85 1.30 0.85 1.12 0.70 1.35 0.76 Hhold has running w ater 0.59 0.49 0.56 0.50 0.62 0.49 0.34 0.47 0.57 0.50 0.65 0.48 0.60 0.49 Hhold has electricity 0.68 0.47 0.54 0.50 0.65 0.48 0.23 0.42 0.72 0.45 0.47 0.50 0.56 0.50 Hhold has se w age system 0.38 0.48 0.20 0.40 0.26 0.44 0.07 0.26 0.30 0.46 0.16 0.36 0.18 0.39 Urban area 0.46 0.50 0.29 0.45 0.29 0.45 0.26 0.44 0.33 0.47 0.17 0.38 0.34 0.47 Observ ations 6120 4396 861 779 869 649 1238 Sour ce: A uthor’ s calculation based on the ENCO VI 2000T able A.2: Descripti v e statistics 2011 (children aged 7-17 years) Ladino Indigenous Quich ´e K ekch ´ı Kakchiquel Mam Other Indigenous V ariable Mean Std. De v. Mean Std. De v. Mean Std. De v. Mean Std. De v. Mean Std. De v. Mean Std. De v. Mean Std. De v. Age 11.91 3.09 11.83 3.09 11.92 3.12 11.74 3.05 11.71 3.09 11.87 3.05 11.86 3.07 School attendance 0.81 0.39 0.79 0.41 0.78 0.42 0.82 0.38 0.78 0.41 0.78 0.41 0.77 0.42 Gender (male = 1) 0.52 0.50 0.51 0.50 0.52 0.50 0.52 0.50 0.48 0.50 0.52 0.50 0.51 0.50 First born 0.47 0.50 0.38 0.49 0.39 0.49 0.38 0.48 0.39 0.49 0.38 0.48 0.39 0.49 Last born 0.29 0.46 0.29 0.45 0.29 0.45 0.29 0.45 0.28 0.45 0.30 0.46 0.29 0.45 Mother in hhold 0.90 0.31 0.94 0.24 0.93 0.25 0.96 0.20 0.95 0.21 0.90 0.30 0.93 0.26 F ather in hhold 0.71 0.46 0.79 0.41 0.75 0.43 0.88 0.32 0.82 0.38 0.71 0.46 0.76 0.43 Hh li ving in couple 0.55 0.50 0.66 0.47 0.64 0.48 0.66 0.47 0.74 0.44 0.56 0.50 0.64 0.48 Hh education in years 3.86 3.71 2.37 2.92 2.22 2.87 2.04 2.82 3.13 3.12 2.03 2.45 2.19 2.96 Household size 6.43 2.30 7.52 2.67 7.43 2.65 7.75 2.55 7.49 2.58 7.67 3.06 7.38 2.62 No children aged 0-5 0.69 0.87 0.98 1.04 0.89 0.97 1.20 1.11 0.94 1.00 1.07 1.16 0.97 1.04 No children aged 6-9 0.60 0.73 0.80 0.77 0.79 0.79 0.84 0.77 0.81 0.75 0.74 0.81 0.77 0.76 No children aged 10-14 0.92 0.86 1.16 0.90 1.11 0.88 1.20 0.86 1.18 0.90 1.22 1.01 1.17 0.92 No children aged 15-18 0.48 0.66 0.59 0.69 0.61 0.71 0.58 0.71 0.56 0.67 0.59 0.69 0.61 0.68 No female adults (19 + ) 1.44 0.80 1.57 0.88 1.64 0.90 1.38 0.73 1.60 0.91 1.66 0.99 1.49 0.78 No male adults (19 + ) 1.28 0.86 1.37 0.91 1.34 0.95 1.51 0.89 1.40 0.90 1.29 0.86 1.29 0.86 Hhold has running w ater 0.63 0.48 0.65 0.48 0.74 0.44 0.40 0.49 0.74 0.44 0.60 0.49 0.65 0.48 Hhold has electricity 0.77 0.42 0.68 0.47 0.83 0.38 0.29 0.45 0.84 0.37 0.70 0.46 0.53 0.50 Hhold has se w age system 0.34 0.47 0.20 0.40 0.18 0.39 0.03 0.18 0.41 0.49 0.14 0.34 0.15 0.35 Urban area 0.38 0.49 0.29 0.45 0.32 0.46 0.12 0.32 0.47 0.50 0.17 0.38 0.24 0.43 Observ ations 11249 7464 2495 1232 1676 849 1211 Sour ce: A uthor’ s calculation based on the ENCO VI 2011
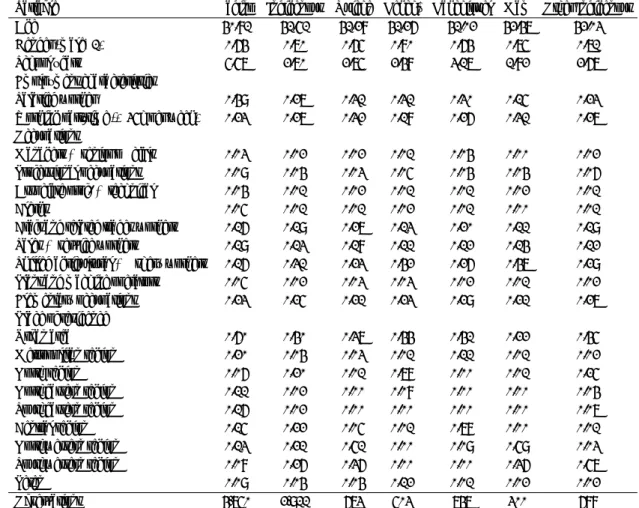
Table A.3: Descriptive statistics 2000 (working individuals)
Variable Ladino Indigenous Quich´e Kekch´ı Kakchiquel Mam Other Indigenous
Age 40.81 41.51 41.28 41.26 41.02 42.47 42.03
Gender (male=1) 0.64 0.70 0.65 0.80 0.64 0.75 0.71
School years 5.57 2.70 2.75 2.48 3.17 1.82 2.67
Employment characteristics
Salaried worker 0.49 0.27 0.31 0.31 0.30 0.15 0.23
Working part-time (< 35h per week) 0.23 0.27 0.32 0.18 0.26 0.31 0.27
Occupations
Managers & senior officials 0.03 0.02 0.02 0.01 0.04 0.00 0.02
Professional occupations 0.09 0.04 0.03 0.05 0.04 0.04 0.06
Associate prof. & technical 0.04 0.01 0.02 0.01 0.01 0.02 0.01
Clerks 0.05 0.01 0.01 0.02 0.01 0.00 0.01
Craft and related trades workers 0.16 0.19 0.27 0.13 0.20 0.11 0.19
Sales & service workers 0.19 0.13 0.18 0.11 0.12 0.14 0.12
Skilled agricultural & fishery workers 0.16 0.31 0.23 0.42 0.26 0.47 0.29
Plant and machine operators 0.05 0.02 0.03 0.03 0.02 0.01 0.02
Elementary occupations 0.23 0.25 0.21 0.23 0.29 0.21 0.27 Place of residence Urban area 0.60 0.40 0.37 0.44 0.41 0.22 0.45 Metropolitan region 0.20 0.04 0.03 0.01 0.11 0.01 0.02 North region 0.06 0.20 0.01 0.78 0.00 0.01 0.25 Northeastern region 0.11 0.02 0.00 0.08 0.00 0.00 0.04 Southeastern region 0.16 0.02 0.00 0.00 0.00 0.00 0.07 Central region 0.15 0.22 0.05 0.01 0.78 0.00 0.01 Northwestern region 0.13 0.21 0.51 0.00 0.09 0.59 0.03 Southwestern region 0.08 0.26 0.36 0.00 0.00 0.36 0.57 Peten 0.09 0.04 0.04 0.12 0.01 0.02 0.02 Observations 4,750 2,911 673 503 747 300 688
Table A.4: Descriptive statistics 2011 (working individuals)
Variable Ladino Indigenous Quich´e Kekch´ı Kakchiquel Mam Other Indigenous
Age 41.03 41.08 42.03 40.51 39.98 41.49 41.23
Gender (male=1) 0.65 0.68 0.66 0.82 0.63 0.69 0.69
School years 5.66 3.28 3.21 2.79 3.96 2.69 3.01
Employment characteristics
Salaried worker 0.50 0.27 0.28 0.22 0.34 0.18 0.23
Working part-time (< 35h per week) 0.23 0.29 0.29 0.25 0.25 0.35 0.36
Occupations
Managers & senior officials 0.07 0.05 0.05 0.05 0.05 0.07 0.04
Professional occupations 0.08 0.04 0.04 0.05 0.04 0.02 0.04
Associate prof. & technical 0.05 0.03 0.03 0.02 0.03 0.02 0.05
Clerks 0.03 0.01 0.01 0.00 0.01 0.00 0.01
Craft & related trades workers 0.12 0.17 0.24 0.04 0.20 0.08 0.11
Sales & service workers 0.13 0.09 0.11 0.05 0.11 0.07 0.06
Skilled agricultural & fishery workers 0.13 0.23 0.13 0.45 0.17 0.27 0.34
Plant and machine operators 0.06 0.04 0.03 0.03 0.06 0.03 0.03
Elementary occupations 0.33 0.35 0.37 0.30 0.33 0.44 0.33 Place of residence Urban area 0.52 0.39 0.39 0.19 0.57 0.26 0.36 Metropolitan region 0.12 0.04 0.02 0.01 0.08 0.03 0.03 North region 0.03 0.14 0.00 0.65 0.00 0.00 0.30 Northeastern region 0.30 0.04 0.00 0.19 0.01 0.01 0.07 Southeastern region 0.13 0.00 0.00 0.00 0.00 0.00 0.02 Central region 0.16 0.21 0.02 0.01 0.71 0.01 0.04 Northwestern region 0.20 0.41 0.75 0.01 0.19 0.76 0.16 Southwestern region 0.03 0.14 0.21 0.03 0.00 0.18 0.35 Pet´en 0.03 0.02 0.00 0.11 0.00 0.01 0.03 Observations 9,371 5,100 1,741 716 1,402 483 757
Table A.5: Detailed decomposition across the earnings distribution
Ethnic Wage Gap in 2000 Ethnic Wage Gap in 2011
Quantile Mean 0.10 0.25 0.50 0.75 0.90 Mean 0.10 0.25 0.50 0.75 0.90
All Indigenous group
Difference 0.75 0.60 0.97 0.75 0.67 0.66 0.50 0.59 0.60 0.52 0.47 0.41 Explained 0.45 0.33 0.46 0.48 0.51 0.51 0.27 0.23 0.23 0.29 0.34 0.33 Gender (male=1) -0.04 -0.05 -0.06 -0.04 -0.02 -0.02 -0.01 -0.02 -0.02 -0.01 -0.01 -0.01 School years 0.33 0.31 0.32 0.33 0.38 0.39 0.21 0.17 0.19 0.23 0.26 0.26 Urban 0.08 0.11 0.13 0.10 0.05 0.03 0.03 0.05 0.04 0.03 0.02 0.02 Regions 0.07 -0.04 0.04 0.09 0.10 0.12 0.04 0.02 0.01 0.04 0.08 0.05 Quich´e Difference 0.64 0.50 0.79 0.61 0.51 0.62 0.46 0.44 0.49 0.47 0.50 0.38 Explained 0.53 0.60 0.61 0.56 0.52 0.46 0.34 0.38 0.35 0.39 0.36 0.32 Gender (male=1) -0.01 -0.01 -0.01 -0.01 0.00 0.00 0.00 -0.01 -0.01 0.00 0.00 0.00 School years 0.32 0.35 0.34 0.33 0.36 0.33 0.23 0.19 0.21 0.26 0.26 0.27 Urban 0.08 0.16 0.15 0.09 0.03 0.02 0.03 0.06 0.04 0.03 0.02 0.01 Regions 0.12 0.08 0.11 0.13 0.12 0.11 0.09 0.12 0.09 0.11 0.10 0.05 Quekchi Difference 0.68 0.53 0.80 0.72 0.61 0.58 0.50 0.59 0.60 0.52 0.47 0.41 Explained 0.48 0.32 0.59 0.55 0.46 0.49 0.27 0.23 0.23 0.29 0.34 0.33 Gender (male=1) -0.10 -0.16 -0.16 -0.09 -0.05 -0.07 -0.01 -0.02 -0.02 -0.01 -0.01 -0.01 School years 0.37 0.38 0.38 0.37 0.41 0.39 0.21 0.17 0.19 0.23 0.26 0.26 Urban 0.06 0.12 0.12 0.07 0.02 0.01 0.03 0.05 0.04 0.03 0.02 0.02 Regions 0.15 -0.03 0.25 0.20 0.08 0.16 0.04 0.02 0.01 0.04 0.08 0.05 Kakchiquel Difference 0.68 0.60 0.97 0.77 0.55 0.52 0.43 0.56 0.50 0.46 0.33 0.37 Explained 0.29 0.15 0.18 0.30 0.41 0.40 0.08 -0.06 0.00 0.05 0.18 0.21 Gender (male=1) 0.00 0.00 0.00 0.00 0.00 0.00 0.01 0.01 0.01 0.01 0.00 0.00 School years 0.28 0.28 0.29 0.28 0.31 0.29 0.16 0.14 0.15 0.18 0.17 0.18 Urban 0.07 0.12 0.12 0.07 0.03 0.02 -0.01 -0.02 -0.02 -0.01 -0.01 -0.01 Regions -0.06 -0.27 -0.25 -0.07 0.05 0.09 -0.08 -0.17 -0.13 -0.13 0.00 0.02 Mam Difference 1.06 0.97 1.27 1.09 1.07 0.91 0.56 0.57 0.66 0.60 0.62 0.46 Explained 0.66 0.82 0.80 0.69 0.62 0.55 0.41 0.45 0.39 0.46 0.41 0.40 Gender (male=1) -0.07 -0.11 -0.11 -0.06 -0.03 -0.05 -0.01 -0.02 -0.02 -0.02 -0.01 -0.01 School years 0.44 0.46 0.47 0.45 0.48 0.45 0.28 0.24 0.25 0.32 0.30 0.32 Urban 0.14 0.31 0.27 0.14 0.05 0.04 0.06 0.11 0.08 0.06 0.03 0.03 Regions 0.15 0.13 0.15 0.16 0.13 0.13 0.09 0.11 0.07 0.10 0.09 0.06 Other Indigenous Difference 0.83 0.57 1.05 0.88 0.78 0.73 0.70 0.82 0.94 0.72 0.59 0.50 Explained 0.50 0.53 0.64 0.51 0.48 0.50 0.42 0.49 0.44 0.48 0.40 0.36 Gender (male=1) -0.04 -0.07 -0.07 -0.04 -0.02 -0.03 -0.02 -0.02 -0.02 -0.02 -0.01 -0.01 School years 0.34 0.36 0.35 0.34 0.38 0.37 0.24 0.21 0.22 0.28 0.28 0.29 Urban 0.05 0.10 0.10 0.06 0.02 0.01 0.04 0.07 0.05 0.04 0.02 0.02 Regions 0.15 0.12 0.24 0.14 0.11 0.16 0.15 0.22 0.18 0.18 0.11 0.06
Table A.6: Detailed decomposition with employment characteristics
Ethnic Wage Gap in 2000 Ethnic Wage Gap in 2011
Quantile Mean 0.10 0.25 0.50 0.75 0.90 Mean 0.10 0.25 0.50 0.75 0.90
All Indigenous group
Difference 0.75 0.60 0.97 0.75 0.67 0.66 0.50 0.59 0.60 0.52 0.47 0.41 Explained 0.58 0.58 0.68 0.63 0.57 0.53 0.37 0.45 0.41 0.39 0.38 0.33 School years 0.18 0.17 0.16 0.17 0.20 0.27 0.13 0.09 0.10 0.13 0.16 0.19 Urban 0.03 0.04 0.05 0.04 0.02 0.01 0.01 0.02 0.02 0.01 0.01 0.01 Regions 0.06 -0.07 0.02 0.08 0.10 0.11 0.04 0.02 0.01 0.03 0.08 0.05 Job characteristics 0.17 0.30 0.26 0.20 0.12 0.04 0.09 0.15 0.15 0.12 0.05 0.01 Occupation 0.16 0.18 0.23 0.17 0.16 0.13 0.12 0.20 0.16 0.11 0.10 0.08 Quich´e Difference 0.64 0.50 0.79 0.61 0.51 0.62 0.46 0.44 0.49 0.47 0.50 0.38 Explained 0.56 0.70 0.68 0.58 0.51 0.46 0.36 0.42 0.39 0.41 0.36 0.32 School years 0.18 0.20 0.18 0.17 0.21 0.24 0.14 0.10 0.11 0.15 0.17 0.20 Urban 0.03 0.06 0.06 0.04 0.01 0.00 0.01 0.02 0.02 0.01 0.01 0.01 Regions 0.07 -0.05 0.00 0.09 0.10 0.08 0.08 0.13 0.08 0.09 0.09 0.05 Job characteristics 0.17 0.34 0.29 0.18 0.08 0.03 0.09 0.15 0.14 0.12 0.03 0.00 Occupation 0.11 0.15 0.15 0.09 0.12 0.10 0.05 0.02 0.04 0.05 0.07 0.06 Quekchi Difference 0.68 0.53 0.80 0.72 0.61 0.58 0.50 0.59 0.60 0.52 0.47 0.41 Explained 0.59 0.61 0.80 0.65 0.48 0.50 0.37 0.45 0.41 0.39 0.38 0.33 School years 0.21 0.22 0.20 0.20 0.23 0.29 0.13 0.09 0.10 0.13 0.16 0.19 Urban 0.02 0.04 0.05 0.03 0.01 0.01 0.01 0.02 0.02 0.01 0.01 0.01 Regions 0.12 -0.09 0.18 0.15 0.08 0.15 0.04 0.02 0.01 0.03 0.08 0.05 Job characteristics 0.10 0.21 0.14 0.12 0.05 -0.01 0.09 0.15 0.15 0.12 0.05 0.01 Occupation 0.23 0.38 0.38 0.23 0.18 0.15 0.12 0.20 0.16 0.11 0.10 0.08 Kakchiquell Difference 0.68 0.60 0.68 0.77 0.55 0.52 0.43 0.56 0.50 0.46 0.33 0.37 Explained 0.48 0.57 0.48 0.50 0.48 0.43 0.20 0.24 0.22 0.17 0.21 0.20 School years 0.15 0.15 0.15 0.15 0.17 0.21 0.10 0.08 0.08 0.10 0.12 0.14 Urban 0.03 0.04 0.03 0.03 0.01 0.01 -0.01 -0.01 -0.01 -0.01 0.00 0.00 Regions 0.02 -0.08 0.02 0.01 0.08 0.09 -0.03 -0.04 -0.04 -0.07 0.00 0.00 Job characteristics 0.15 0.30 0.15 0.17 0.08 0.02 0.06 0.09 0.10 0.08 0.02 0.00 Occupation 0.12 0.14 0.12 0.13 0.13 0.09 0.07 0.12 0.08 0.05 0.06 0.05 Mam Difference 1.06 0.97 1.27 1.09 1.07 0.91 0.56 0.57 0.66 0.60 0.62 0.46 Explained 0.86 1.32 1.21 0.89 0.65 0.57 0.57 0.82 0.66 0.63 0.45 0.39 School years 0.24 0.24 0.22 0.23 0.27 0.32 0.17 0.14 0.14 0.18 0.20 0.25 Urban 0.06 0.13 0.11 0.06 0.02 0.02 0.02 0.03 0.03 0.02 0.01 0.02 Regions 0.08 -0.04 0.01 0.10 0.10 0.11 0.08 0.12 0.05 0.08 0.08 0.06 Job characteristics 0.28 0.61 0.48 0.29 0.13 0.03 0.15 0.26 0.26 0.20 0.05 0.01 Occupation 0.27 0.49 0.47 0.26 0.19 0.17 0.16 0.29 0.20 0.16 0.11 0.07 Other Indigenous Difference 0.83 0.57 1.05 0.88 0.78 0.73 0.70 0.82 0.94 0.72 0.59 0.50 Explained 0.58 0.70 0.77 0.59 0.51 0.51 0.54 0.80 0.65 0.60 0.44 0.37 School years 0.20 0.21 0.18 0.19 0.20 0.25 0.15 0.12 0.12 0.16 0.19 0.22 Urban 0.02 0.04 0.04 0.03 0.01 0.00 0.02 0.02 0.02 0.01 0.01 0.01