W
o
r
k
in
g
P
a
P
e
r
s
s
e
s
F
a c u l t é d e ss
c i e n c e se
c o n o m i q u e s e ts
o c i a l e sW
i r t s c h a F t s-
u n ds
o z i a l W i s s e n s c h a F t l i c h eF
a k u lt ä tu
n i v e r s i t é d eF
r i b o u r g| u
n i v e r s i t ä tF
r e i b u r g11.2013
N° 446
Robust Imitation Strategies
Devanathan Sudharshan, Olivier Furrer and
Ramesh A. Arakoni
ROBUST IMITATION STRATEGIES D. Sudharshan, Olivier Furrer, & Ramesh A. Arakoni
Performance is the lifeblood of a firm’s management. Performance itself depends on the adaptation of strategy, based on learning and the environment. An important way that firms adapt their strategy is through imitation or mimetic isomorphism. Imitation implies a referent for such adaptations. This article seeks to determine who or what should serve as that referent. Accordingly, this research (1) develops a broad and rich model of industry dynamics, bringing together literature from industrial economics, strategic groups, learning, and resource-based theories; (2) examines the robustness of imitations strategies; and (3) develops a framework of the managerial implications of imitative behavior in varying industry conditions.
Key words: Imitation; Strategy Dynamics; Resources; Strategic Change; Performance.
1. INTRODUCTION
Strategic management is fundamentally concerned with environmental changes and
organizational adaptations (Ansoff, 1979; Hofer and Schendel, 1978). One of the key ways firms adapt their strategy is through imitation or mimetic isomorphism. The profound influence of imitation on industry dynamics has been well established (DiMaggio and Powell, 1983;
Haveman, 1993; Miner and Raghavan, 1999; Rivkin, 2000). It consists of following a leader (or referent; Fiegenbaum, Hart, and Schendel, 1996), though the question of which leader to follow has not been satisfactory answered. Industrial organization (IO) economics suggests that firms should imitate the strategy of the firm that leads the overall industry in terms of its performance. Strategic group theory recognizes mobility barriers between groups and thus suggests that firms should follow the strategy of a leading firm in their strategic group. In contrast, the
resource-based theory posits that a firm should imitate the leading firm from among those with similar resources (i.e., its resource group), but only if it does not have unique resources to distinguish itself from competitors. Considering these three distinctive recommendations, we seek to answer the following question: Is there a robust imitation strategy for firms seeking to improve their performance? By robust, we mean a strategy that most often leads to leadership across various environmental conditions. If the answer to this question is not a clear yes (as our findings indicate), is there a most robust strategy for each of a variety of environmental conditions? To answer these questions, we adopt a simulation methodology (Davis, Eisenhardt, and Bingham, 2007; Harrison, Lin, Carroll, and Carley, 2007) to determine the performance implications of following the industry leader, a strategic group leader, or a resource group leader. Through these simulations, we can identify the most robust imitation strategy for a firm to follow, which results in it becoming a performance leader, given a certain level of uncertainty in its external
environment (environmental turbulence) and uncertainty about the value and inimitability of its resources.
Furthermore, we develop a resource–strategy–performance (R–S–P) framework to model both the magnitude and the direction of change in the strategy of an imitating firm. Our
framework while similar to the one proposed by Kunc and Morecroft’s (2010) contends that the relationship between resource development and performance is mediated by a firm’s strategic positioning in the industry environment. Kunc and Morecroft laid out a decision making process describing the relationship between firm performance, resource conceptualization, and resource development. The inclusion of strategy positioning helps us to account for various environmental
conditions1. In our simulation, the R–S–P framework helps reveal the effect of pursuing
alternative imitation strategies. That is, with a model based on this framework, we can compute a firm’s performance as a function of its position and the density of competition it faces in the strategy space. An imitating firm’s strategy change moves in the direction of a referent, and its extent is a function of its change capability (which in turn is a function of its resource stock at the time of the change). To complete the cycle, a firm’s resources increase or decrease as a function of its past performance. Thus we can answer the question of which referent to follow by varying the parameters of the model to simulate different environmental conditions and then comparing the resulting performance under the three different imitation strategies. We contribute to extant literature by (1) developing a broad, rich model of industry dynamics that brings together literature from IO economics, strategic groups, learning, and resource-based theories; (2)
identifying robust imitation strategies; and (3) recommending managerial guidelines for imitative behavior in varying industry conditions.
2. LITERATURE REVIEW
Competitive imitation lies at the core of strategy theory.2 Both Schumpeter (1950) and Nelson
and Winter (1982) note the central roles of innovation and imitation in dynamic competition. Ghemawat (1999: 84) defines imitation as “the diffusion of successful business models—defined
1
IDC a major strategy consulting firm provides several examples of what they term as MarketScapes. Each MarketScape represents vendors (participants) in an industry. What is fascinating is that they collapse several measures of strategy onto a Strategies dimension and several measures of capabilities onto a Capabilities dimension. Each vendor is represented as a circle on these dimensions with its center representing their
respective Strategies and Capabilities scores and its size its market share. Remarkably, in the examples provided on the IDC website, shares of vendors along the diagonal are in general higher than those located off-diagonal, thus anecdotally confirming the relationship between performance and the match between strategies and resources. Further, both from the MarketScape diagrams and the associated write-up, it is clear that each market is segmented thus justifying the need to model strategy and resource groups.
2
We thank an anonymous reviewer for suggesting this language.
in terms of resources, deployed and/or activities performed—across the population of firms.” Other scholarly works emphasize the use and value of imitation as a strategy, such as DiMaggio and Powell (1983), Porter (1985), Haveman (1993), Rivkin, (2000), and Lieberman and Asaba (2006) (see Miner and Raghavan, 1999, for a review). Ghemawat (1986) provides evidence of the pervasiveness of imitation across cross-sections of industries, which likely stems from the cost and information advantages it offers (DiMaggio and Powell, 1983). In general, innovators tend to bear higher costs (e.g., Porter, 1985) and face more uncertain environments than imitators (e.g., Lieberman and Montgomery, 1988). Thus, imitation is both less costly and less risky as a strategy, compared with innovation.
When a competitor develops a technological innovation that establishes a new offering, the question of whom to imitate may be moot. However, if there are multiple innovators, varying slightly in degree and nature, identifying the correct referent may not be straightforward. For example, should a competitor have imitated Sony’s Betamax or JVC’s VHS technologies? This example also reveals a key point, namely, that it is easier to think in terms of imitating
technologies (Betamax versus VHS) than imitating broader strategic moves. For strategic issues such as changes in scale, scope, or synergy, the question of whom to imitate grows even murkier. Imagine a hypothetical choice between imitating GE’s strategic scope versus that of Rolls Royce. In the context of such broad strategic moves, both uncertainty and ambiguity increase—a
condition that creates powerful drivers of imitation (DiMaggio and Powell, 1983), and managers tend to use role models and examples (Denrell, 2003; Gavetti, Levinthal, and Rivkin, 2005). Also in these conditions, imitating the wrong firm may have serious negative consequences (Denrell, 2005; Gavetti and Rivkin, 2005). So, the question of whom to imitate is of great importance.
Prior literature provides a wealth of responses: The best firm to imitated is variously identified as the best performer (Ghemawat, 1999; Rivkin, 2000); a representative of the herd
(Bikhchandani, Hirshleifer, and Welch, 1998; Lieberman and Asaba, 2006); the one with the best routines for the market conditions (Nelson and Winter, 1982); the one perceived to be more legitimate or successful (DiMaggio and Powell, 1983; Lieberman and Asaba, 2006); a better-performing rival (Haunschild and Miner, 1997; Miner and Raghavan, 1999; Zott, 2003); the one with successful strategies (Porter, 1985); or the most innovative firms or first movers
(Schumpeter, 1950). Thus, even when imitation is recognized as a core element of strategy practice and theory, vast possibilities for selecting a role model or referent exist, and the issue of whom to imitate remains problematic. As Haveman (1993: 596) observes, “Although imitation has long been recognized as a sensible guide to organizational change … there has been little theoretical analysis to determine which social actors will be imitated,” and we might add, little theoretical analysis to determine which social actors should be imitated.
To begin to address this gap, we note that the list of possible referents begs a question about the reference group that produces the referent. For example, IO theory stipulates that in less turbulent environments, firms should imitate their industry leader, such that the industry itself is the reference group (e.g., DiMaggio and Powell, 1983; Ghemawat, 1986). Strategic group theorists instead argue that imitating the industry leader does not lead to higher performance, so firms should follow the leader of their strategic group (e.g., Fiegenbaum and Thomas, 1995). From a resource-based viewpoint, firms should differentiate themselves from others (Barney, 1991), though if they do not possess distinctive capabilities, they should follow leading firms with comparable resources (Mehra and Floyd, 1998), which implies the reference group is the set of firms with similar resources (Mehra, 1994) (i.e., their resource group). In summary, three streams of literature provide conflicting recommendations about whom to imitate—with little guidance about varying conditions. Our proposed stylized model (the R–S–P model) therefore captures elements of all three streams of research to shed more light on this question.
3. THE R–S–P MODEL
Because our objective is to compare alternative referents (i.e., resource-based, strategy-based, or industry-based) that a firm might imitate, our model must allow for representations of the firm’s resources and strategy, as well as of their dynamic relationships with performance as the firm adapts through its imitation. Therefore, our model, building on Kunc and Morecroft’s (2010) framework, comprises the following relationships: (1) performance as a function of resources and strategy, (2) change in strategy as a function of the position of the referent, (3) the extent of strategy change as a function of a firm’s resource position, and (4) resource change as a function of dynamic capabilities and performance.
3.1 Representation of strategy and resource
Early strategy literature (Ansoff, 1979; Hofer and Schendel, 1978) explained firm performance on the basis of either a firm’s strategy position or resource endowments. The two factors are interrelated; it would not be possible to enact strategy without resources, nor would it be possible to acquire additional resources without enacting strategy. However, in strategy literature, these two spaces traditionally have been separated (Wernerfelt, 1984). To be consistent, as well as to distinctly and clearly model and observe the underlying dynamic interaction among resources, strategy, and performance, we separate them in our model as well.
Competitive firms thus appear positioned in two multidimensional spaces. In the strategy space, firms are identified on the basis of their strategy, whereas in the resource space, the same firms are identified on the basis of their resources (Furrer et al., 2008). Multiple dimensions can define the strategy space, as noted by McGee and Thomas (1986) and Thomas and Venkatraman (1988). Early studies used strategy variables to conceptualize strategic groups; more recent works group firms according to their resource positions (Bogner, Thomas, and McGee, 1996; Mehra, 1996). Tang and Liou (2010) propose the use of Bayesian inference to identify industry specific
resource configurations, which mediate sources of competitive advantage and sustainable superior performance. These resource configurations correspond to the dimensions of the
resource space. A similar inference process can be used to identify the dimensions of the strategy space. It could also be used to update priors on the state of the industry. Tang and Liou (2010) identify three key resource configurations or resource space dimensions in the semiconductor industry: relationship advantage, management ability, and knowledge management. Similarly, the strategy space dimensions might for example entail operating efficiency and capital leverage. Both operating efficiency and capital leverage are derived from scale, scope, and synergy and thus relate back to the conventionally defined view of corporate strategic choices (Ansoff, 1979). 3.2 A model of firm performance
Modeling performance as a function of the firm’s strategic position is a well-established tradition. For example, Levinthal (1997), Ghemawat (1999), and Gavetti et al. (2005) represent a strategy– performance map as a high-dimensional performance landscape, such that locations in strategy space relate directly to performance. In addition, following Rivkin (2000), we model a firm’s performance as a function of the distance between its actual position in the strategy space and the optimal position (which depends on the nature of the industry). In competitive environments, a firm’s performance is not based solely on its own strategy (Porter, 1985); rather, as population ecology literature (Hannan and Freeman, 1977) and positioning literature (Hotelling, 1929; Porter, 1985) indicate, we assume that when firms are closer to each other, their respective performance suffers. Thus, we model firm performance as directly proportional with its closeness to the optimum (Rivkin, 2000) and inversely proportional with the closeness of other firms to that optimum (Kuehn and Day, 1962; Shocker and Srinivasan, 1974, Sudharshan, May, and Shocker, 1987).
strategic groups literature (e.g., Hatten and Schendel, 1977), an industry has several optimal points, one for each group. The appropriate grouping of firms to explain their performance might reflect the commonality of their strategies (McGee and Thomas, 1986) or the commonality of their resources (Mehra 1994). If performance is based on strategic groups, the number of optima equals the number of strategic groups present, with one optimum for each group. Similarly, if performance is based on resource groups, the number of optima is the number of resource groups present, with one optimum for each group. But IO theory (Scherer and Ross, 1990) instead calls for one unique, optimal position, or industry optimum, such that proximity to it leads to superior performance in the industry.
More formally, firm f’s performance Pf can be specified as in Equation 1, where the
numerator is the inverse of the weighted (w) distance between the firm’s position in strategy space (s) and the relevant optimum (opt), and the denominator is the sum of the inverses of the distances of all firms from the appropriate optimum. This follows the tradition in the marketing literature of following the pioneering work of Kuehn and Day (1962) and Shocker and Srinivasan (1974). We provide a detailed summary of the notation in Table 1.
(1) 3.3 Change in strategy
Assuming that managers are organizationally rational, they select and implement strategies that they believe will lead to higher performance (Simon, 1976). Strategy change then represents an outcome jointly determined by the motivation to change, opportunity to change, and capability to change (Greve, 1998; Miller and Chen, 1994). A firm’s strategy change is not fixed in magnitude or direction over time; rather the magnitudes and directions likely vary at different times
(Burgelman, 1994; Zajac, Kraatz, and Bresser, 2000). Cognitive strategic group theory (Porac et
al., 1995; Reger and Huff, 1993) and reference-point theory (Fiegenbaum and Thomas, 1995;
Fiegenbaum et al., 1996) suggest that managers use referents to evaluate their relative strategic position and the direction to move to improve their performance. Observing competitors provides firms with an opportunity to see how similar firms, often endowed with comparable resources, go about addressing opportunities and problems that are similar to those that they face (Peteraf and Shanley, 1997).
In our model, a firm adjusts its strategy in accordance with observed industry behavior and a reference point. Each adjustment requires a choice of both the direction and the magnitude of change. To achieve or protect its desired position in strategy space, a firm needs to deploy resources (Dierickx and Cool, 1989; Peteraf, 1993); thus resources constrain the change that can be made to the strategy. In turn, we model strategy change as it occurs in the multidimensional strategy space, in each time period, in the direction of a referent, and with a maximum
magnitude, given available resources and not exceeding the amount needed to close the gap with the referent. We present the formal relationships of strategy change, resources, and performance gaps after we detail how resources constrain strategy change.
3.4 Resource constraints on strategy change
To achieve its desired position in strategy space, a firm must deploy resources. Many of the enablers of and constraints on strategy changes arise from meta- or dynamic capabilities (Collis, 1994; Eisenhardt and Martin, 2000; Teece, Pisano, and Shuen, 1997) and core rigidities
(Leonard-Barton, 1992). To modify its strategy, a firm needs to reconfigure its resource structure (Eisenhardt and Martin, 2000) and develop or acquire new resources (Makadok, 2001).
At any given time, a firm’s ability to change a strategy dimension is limited by its resources and dynamic capabilities. Following the principle of Occam’s Razor, we model this assertion
with a multiplicative conversion factor that translates resources into strategy change. In principle, conversion factors depend on a firm’s dynamic capabilities (Teece et al., 1997). It is also possible that firms are idiosyncratic in choosing how much of their resources they wish to spend on the various dimensions of strategy, as captured through a multiplicative maximum utilization factor.
More formally, we specify the change in firm f’s strategy (∆s) on dimension j in Equation 2, which provides the maximum change possible, and Equations 3 and 4, which reveal the
constraints that limit this change. Associated with each resource group k is a factor wk,i,j that
scales the resource value of firm f on resource dimension i to change on strategy dimension j
without further constraints. Utilization factor utilk,i,j constrains the amount of change possible
through the use of resource dimension i on resource dimension j.
(2)
Furthermore, to ensure that a firm’s actual change (∆sactual,f,i) is no more than needed to attain best
performance (Simon, 1976), we apply the following additional condition:
(3)
where ∆sf,i is the difference between the optimal strategy and the fth firm’s strategy.
3.5 Resource changes
Resources may change through utilization, erosion, or substitution (Collis, 1994; Makadok, 2001; Sirmon, Hitt, and Ireland, 2007), so a firm must continually develop its resources (Kunc and Morecroft, 2010) and as resources get used, it needs to replenish its stocks by reinvesting part of its performance in resources (Dierickx and Cool, 1989). The extent of resource change affected by the use of a unit of performance depends on the firm’s dynamic capabilities (Teece et al., 1997) and resource configuration (Tang and Liou, 2010). In each time period, the firm’s resources get updated, with the subtraction of the extent to which they were used in the past
(erosion is not explicitly modeled) and the addition of a proportionality factor of performance. Therefore, the governing equation for the conversion of resource i into strategy, accounting for the actual use of resources, is:
(4)
where qf,i is a measure of how much of resource i is used.
Not all available resources necessarily are used to implement strategy change (Tang and Liou, 2010); the amount of change needed may have been less than the amount of change possible with the resources available (Penrose, 1959). A ratio of needed strategy change to the maximum possible strategy change provides an indicator of the proportion of usable resources actually used.
Recalling that ∆sf,i is the difference between the optimal strategy and the fth firms’ strategy, and
∆smax,f,i is the maximum possible change allowed, we denote
(5)
which implies that
Σ
j utilr,i,j≤ 1; otherwise, firms will use more resources than they actually have,which is not a valid condition.
We performed a simulation study using these relationships. For the simulation, the model based on the R–S–P framework was programmed in C++. When possible, we set parameters suggested by prior literature (Repenning, 2002) or empirical evidence (Oliva and Sterman, 2001). For other parameters that rely on scale values that are likely specific to industries, we instead carried out a sensitivity analysis to find a range of values that produces useful scenarios as recommended by Davis, Eisenhardt and Bingham (2007). Sudharshan, May and Shocker (1987) also provide insights into parameter selection for simulations representing spatial competition. With a generic set of scales, we could assume that an appropriate scale transformation is possible
between the generic scale values we use and the empirically derived values that can be measured. For example, without loss of generality, interval scales are invariant up to a + bx (where x is the variable, and a and b are transformational parameters); ratio scales are invariant up to an ax rescaling. With these scale invariance conditions, our results become generalizable.
4. MODEL PARAMETERIZATION
To study the effects of resources and strategy on a firm’s performance and the robustness of its imitation strategies, we first ran a parametric study to identify acceptable ranges for different parameters (Davis, Eisenhardt, and Bingham, 2007; Law and Kelton, 2000). We sought to identify the primary effects of the group parameter on performance, its variance among different firms, and the number of time-steps required to reach a steady state. Then, we examined the effect of perturbations of the optimal point on the dynamics of the industry. Given the nature of the adaptation model, there is a chance that some parameter values will result in cases in which the performance of all firms is very close, such that they nearly converge. If this convergence were to occur in just a few time periods, it would imply that the parameter values used are not very interesting, in that they would not correspond with the reality in most competitive markets that show sustained performance differences across firms (Schmalensee, 1985). Therefore we carefully chose the parameter values, as we describe in detail subsequently. We also determined acceptable ranges for the parameters to use in our main simulation study.
4.1 Setting values for p_rk,i, r_sk,i,j, and utilk,i,j
A firm in a resource group is characterized by two parameters: (1) p_rk,i, which converts the
performance of a firm belonging to resource group k into resource on the ith dimension of
resource space, and (2) r_sk,i,j, which converts the resource on the ith dimension of the resource
space. A third parameter to parameterize is utilk,i,j, which is the maximum proportion of resources
that can be converted into strategy. Firms are allocated to strategic groups on the basis of the closeness of their initial positions in strategy space, so strategic groups have no specific parameters.
In turn, p_rk,i provides the principal feedback to the system by governing the replenishment of
the firm’s resources. It describes the amount of resources a firm obtains per unit of performance. We made this parameter non-dimensional by dividing it by the order of magnitude of the
resources. To facilitate the comparison of the effects of p_rk,i across different simulations, when
varying the range of resources, we normalized it as follows: p_r’k,i = p_rk,i/rmax,i. In the
simulations, rmax,i is taken to be 10 (i.e., the maximum of the magnitude used for simulation),
without loss of generality. It is important to identify an acceptable range for p_r’k,i because a
higher value of p_r’k,i ensures that firms do not exhaust their resources too quickly.
A high value of the normalized performance-to-resource feedback parameter (p_r) ensures that firms do not exhaust their resources too quickly. For the same unit of performance, more resources are created for higher normalized performance-to-resource feedback parameter firms. With higher resources, the tendency of each firm is to adopt the currently targeted optimal strategy in fewer time steps, which leads it to miss out on (overshoot) nearby optimal strategy points that may be better. In other words, there is less time for learning.
If all firms face similar conditions, then an optimal value of p_r’k,i exists that minimizes the
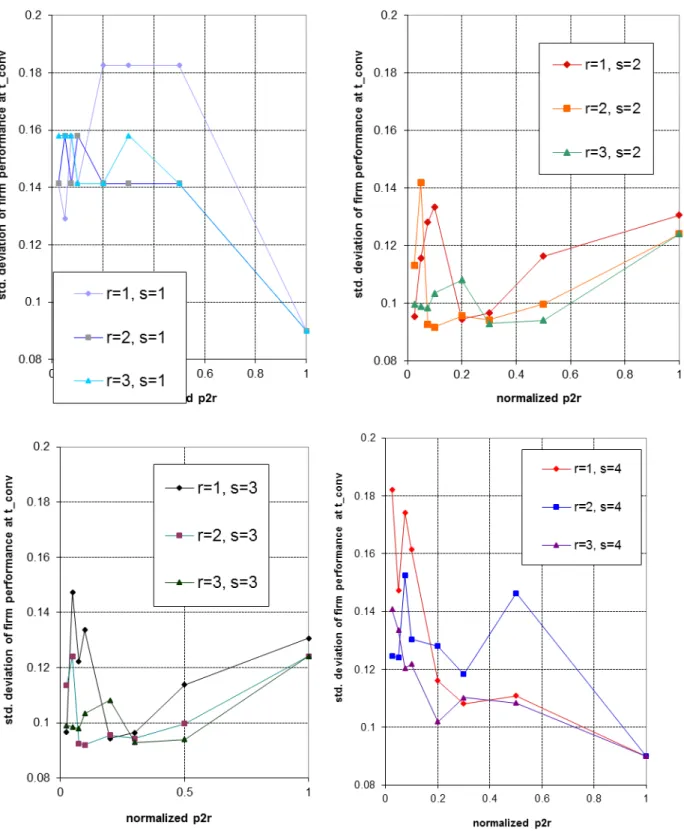
disparity between the firms and the time needed to reach a steady or quasi-steady state. Because the objective for all firms is improved performance, we chose the condition in which the change in the standard deviation of firm performance was close to 0 (zero), which implies that in the industry, there may be performance differences across firms, but the overall performance variation does not change much from one time period to another. This state is the converged
state, and the time taken to reach it is t_conv.
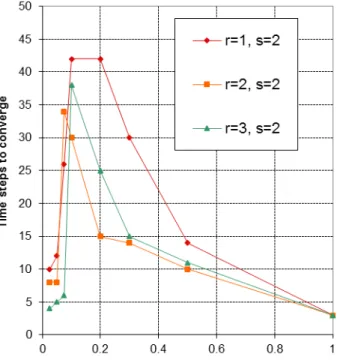
In most industries, convergence only occurs after a sufficient period of time (Miner and
Raghavan, 1999). It is therefore important to identify a range for p_r’k,i for which convergence is
not achieved too quickly. The simulation results in Figure 1 show that at low values of p_r’k,i
(i.e., < 0.1), there is no effect on t_conv. However at values greater than 0.1, the time taken to
converge decreases with the increase in p_r’k,i. The results in Figure 2 show that a p_r’k,i value
between 0.2 and 0.3 gives the lowest standard deviation of performance of firms at t_conv when firms follow their resource group or strategic group leaders. This trend changes when firms move toward the optimal points or the overall group leaders though. These results are valid when the optimal point(s) is fixed and there is no perturbation in the system—constraints that we later
relax. With these results, and because rmax,i has been fixed at 10, the range for p_r’k,i is between
0.1 and 0.2 (i.e., p_rk,i is between 1 and 2), to denote the range that leads to sufficient
performance differences across firms for a sufficient period of time. [Insert Figures 1 and 2 about here]
Next, to determine an acceptable range for r_s k,i,j that transforms resources into strategy, we
consider the cost involved in changing the strategy used by a firm. A lower value of r_sk,i,j
implies that more resources have to be used to effect a unit of change in strategy, compared with the case for a higher r_sk,i,j. To normalize r_sk,i,j, we compute r_s’k,i,j = r_sk,i,j· smax,j/rmax,i and
thereby compare different simulations. If both smax,j and rmax,i are equal, this normalization is not
required. In the current scenario, the smax,j/rmax,i ratio is held constant, though that is not always
the case. The costs for changing a strategy are not necessarily linear, which would be reflected in
r_sk,i,j. When r_sk,i,j is constant, its effects parallel that of p_rk,i. For example, doubling the value
of r_sk,i,j is equivalent to doubling the value of p_rk,i.
converted into strategy. For the sake of simplification, we set the utilk,i,j matrix to be symmetric
with the off-diagonal terms equal to 0 (in line with Suh’s [1990] design axiom). Thus the resource coordinate i serves to change only the strategy coordinates i.
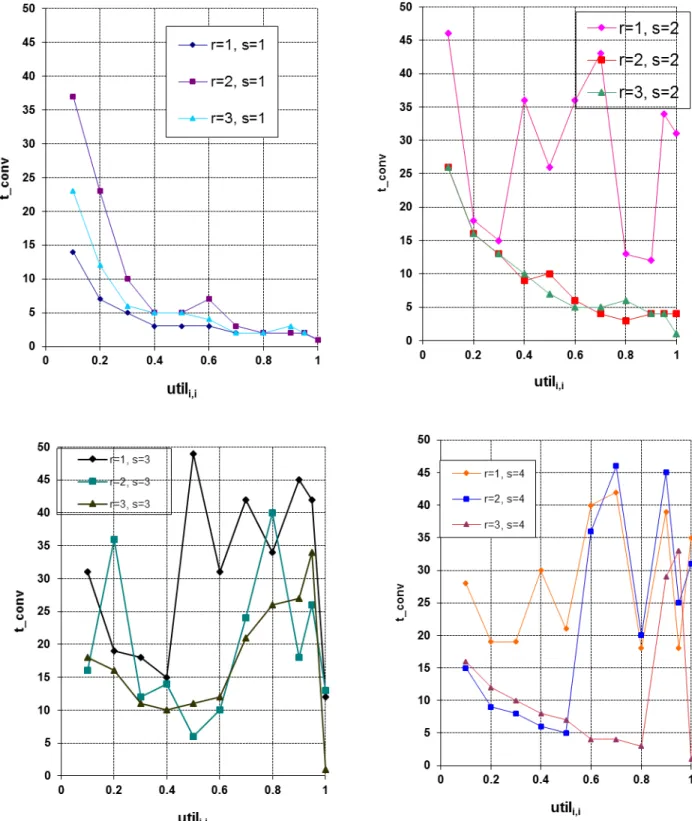
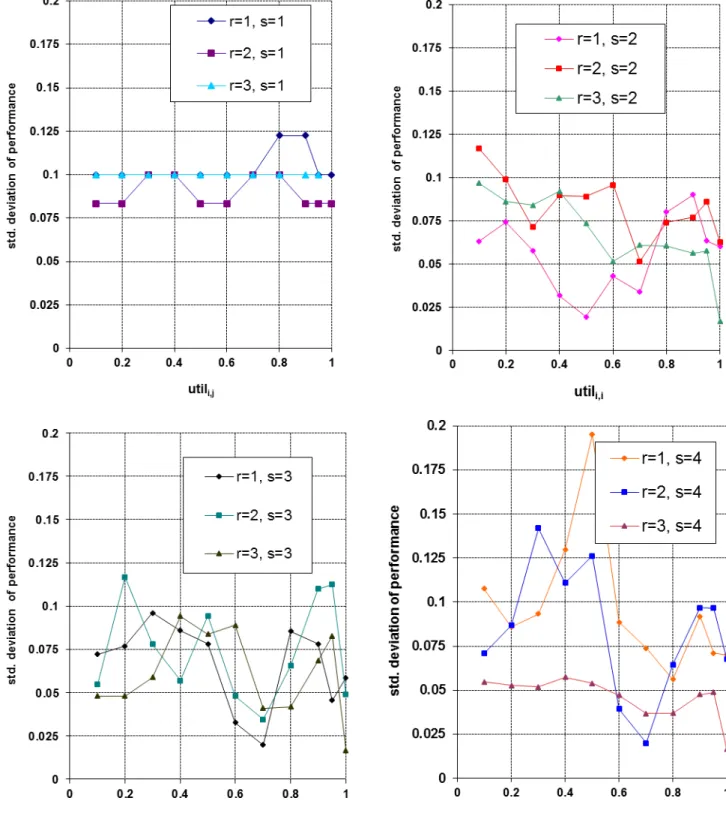
The simulation results in Figure 3 show the effect of utili,i on t_conv. A higher value of utili,i
reduces the time taken to converge only when firms try to adopt a strategy of directly targeting the optimal point (s_cond = 1). For all the other strategies, the time taken to converge reduces up
to a utili,i of about 0.4. Figure 4 shows the effect of utili,i on the standard deviation of performance
at t_conv. When firms adopt the strategy of targeting the optimal point (s_cond = 1), the standard
deviation of performance at t_conv is nearly constant and is not affected by the utili,i. For the
other strategies, no effect can be observed.
[Insert Figures 3 and 4 about here]
From these results and to meet our criteria of sufficient interfirm performance difference over
a sufficient period of time, we fixed the range for utili,i between 0.2 and 0.5 and the range for
r_sk,i,j between 0.2 and 0.75.
4.2 Effect of optimal point perturbations
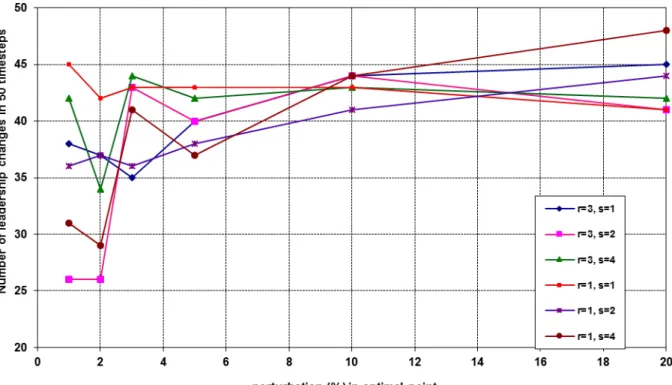
Finally, we tested the effect of optimal point perturbations. Previously, optimal points have been assumed to be fixed across time, but environments are often dynamic (Sirmon et al., 2007), so we relax this constraint and rerun the simulations with random perturbations added to the optimal point(s) at every time period. Even the smallest perturbations ensure that no steady state is possible and that no single firm can remain a leader forever, as the number of leadership changes in Figure 5 show. The perturbations depicted in the figure were randomly chosen, and the
maximum amplitude allowed is a percentage of smax,j. When the perturbation is greater than 2
percent, the system becomes chaotic. In such a situation with ample perturbations in the position of the optimal point(s), there is a large number of changes in leadership and firm performance,
leading the imitation of a prior leader to lead to unpredictable outcomes. Thus, in the main simulation, we set the value of the perturbation parameter at 1 percent to provide sufficient but not excessive variation (Law and Kelton, 1991).
[Insert Figure 5 about here]
This parameterization study also helps establish the face validity of this study, in that our system behaved as would be expected.
5. SIMULATION RESULTS AND ANALYSES
Which imitation strategy is the most robust? As we define it, it is the one that most often leads to leadership across various environments (i.e., environmental turbulence and perturbation in the position of the optimum and uncertainty about the value and inimitability of its resources). Should firms follow their resource group or strategic group leaders? Or, should they follow the industry’s overall best performer? To answer these questions, we ran a series of simulations in which different imitation strategies (s_cond) were adopted by firms from different groups. The simulations used the following parameter values and ranges: total firms = 30; number of resource
groups = 10; number of strategy groups = 153 (we ensured the number of resource groups was
different from the number of strategy groups to facilitate the investigation of the effects of grouping by resource versus strategy). These values are consistent with the findings of previous studies on strategic and resource groups, which suggest 4 to 6 groups in industries with between 12 and 43 firms (Bogner et al., 1996; Cool and Schendel. 1987, 1988; Fiegenbaum et al., 1990;
3
There is considerable debate about the most appropriate clustering methodology and how to specify cluster cut-offs for each methodology; this is about the number of strategic group and firms change membership over time (e.g., Bogner et al., 1996; Cool and Dierickx, 1993). To avoid adding more complications, in terms of changing clustering methodologies and the number of groups over time, we focused specifically on the effect of the imitation strategy chosen.
Hatten and Schendel, 1977; Mehra. 1996). The number of time steps is fixed at 20, to provide a sufficient period of observation. The resource group parameters were the same for all groups. The
performance-to-resource parameter p_rk,i was either 1 or 2 (i.e., p_r’ = 0.1 or 0.2). The
resource-to-strategy parameters r_sr,i,j were
0.75 0 0 0.2 and 0.2 0 0 0.75
, the utilization parameters utilr,i,j
were 0.5 0 0 0.2 and 0.2 0 0 0.5
, and the performance weighting factors were
[
1.0 1.0]
(nopreference for any strategy coordinates, both weighted equally when calculating performance). Each simulation was run five times, with the results averaged. A summary of the parameter values appears in Table 1.
[Insert Table 1 about here]
In Tables 2 and 3, we present the results when the optimal points are fixed. Table 2 shows the results when firms belonging to the same resource group follow the same strategy: Firms in resource group 1 follow their resource group leader, firms in resource group 2 follow their strategic group leader, and firms in resource group 3 follow the industry overall leader. Table 3 presents the results when firms belonging to the same strategic group have the same strategy: Firms in strategy group 1 follow their resource group leader, firms in strategy group 2 follow their strategic group leader, and firms in resource groups 3 and 4 follow the industry overall leader. The next two tables present the results when the optimal point is perturbed with a
maximum amplitude of 1 percent. Table 4 refers to the case in which firms belonging to the same resource group follow the same strategy, and Table 5 details the results when firms belonging to the same strategic group have the same strategy.
[Insert Tables 2 to 5 about here]
group have similar strategies, it is better for them to follow the industry leader if there is an optimal point for each resource group (76.7 percent chance of becoming leader) or when there is a single optimal point for the entire industry (57.9 percent chance of becoming leader). It is better to follow the strategic group leader when there is an optimal point for each strategic group though (55.9 percent chance of becoming leader). When there is no perturbation and the firms in a
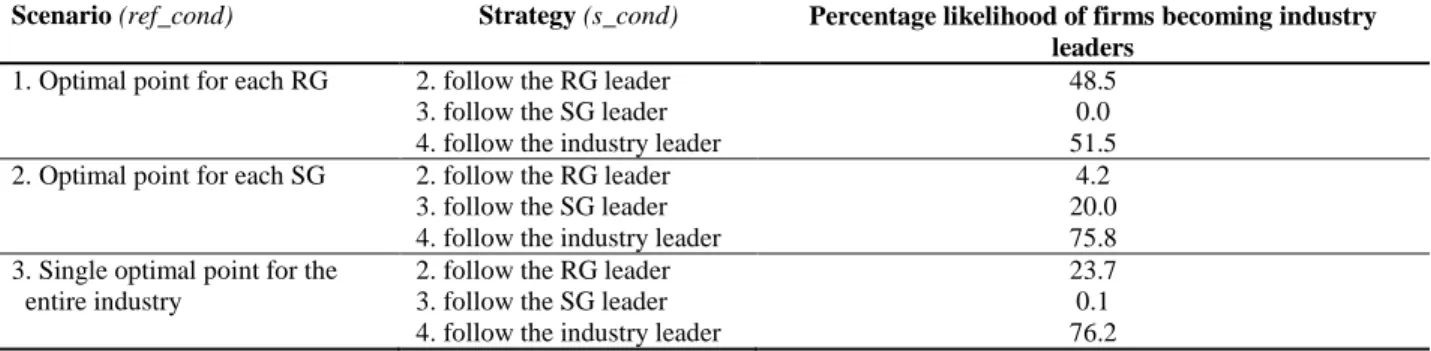
strategic group have similar strategies, it is better for them to follow the industry leader in any case. When the optimal point is perturbed, and firms belonging to the same resource group follow the same strategy, firms are better off following the strategic group leader when there is an
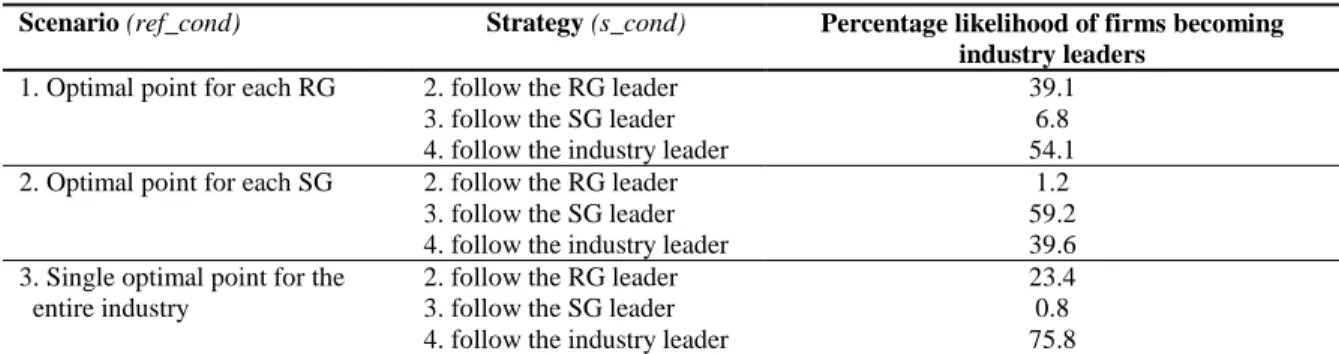
optimal point for each resource group (42.8 percent chance of becoming leader) or when there is a optimal point for each strategic group (57.6 percent chance of becoming leader). Yet it is better to follow the industry overall leader when there is a single optimal point for the entire industry (66.8 percent chance of becoming leader). In a perturbed environment and when firms belonging to the same strategic group follow the same strategy, firms are better off following the industry overall leader when there is an optimal point for each resource group (54.1 percent chance of becoming leader) or when there is a single optimal point for the entire industry (75.8 percent chance of becoming leader). It is however better to follow the strategic group leader when there is an optimal point for each strategic group (59.2 percent chance of becoming leader).
In a turbulent environment, managers choose which referent to imitate using two types of information: their worldview (or mental model; Adner and Helfat, 2003; Kunc and Morecroft, 2010) and the observed behavior of the firms in their reference group. The strategic positioning of a firm relative to other firms and their positioning relative to the optimal point(s) for the industry dictate its performance. This process is elaborated as follows: First, managers have (or choose) a worldview. Due to internal and external causal ambiguity, managers do not a priori know the location of the optimal point (King, 2007; Kunc and Morecroft, 2010). They infer the
location of this point based on their performance and the performance of other firms (Tang and Liou, 2010). Which firms they use as referent depends on their worldview, which is the mental representation or knowledge structure they have about the relationships between resource, strategy, and performance. This mental representation includes the reference group with which they identify (Figenbaum, Hart, and Schendel, 1996). According to prior literature, managers may adopt one of four different worldviews: (1) their strategic group, (2) their resource group, (3) their industry as a whole, or (4) a flexible worldview, which allows them to identify each
reference group and choose the most relevant one based on the situation. Second, managers need to observe the behavior of the firms in their reference group, and the result of these observations is conditioned by their worldview. Managers with a worldview based on resource groups can observe if firms in the same resource group follow the same imitation strategy. However, if firms in the same strategic group follow the same imitation strategy, for example, managers will not be able to observe or identify any pattern of behavior. Only managers with flexible worldviews can recognize all the different patterns of behavior and choose the correct referent for imitation. Third, after conducting their worldview-shaped observations and analysis, managers choose the leader to imitate: resource group or industry leader if they have a resource group worldview, strategic group or industry leader if they have a strategic group worldview, industry leaders when the managers have an industry worldview, and any of the three leaders when they adopt a flexible worldview. A firm’s performance (i.e., the likelihood that the firm will become an industry leader) then is a function of the manager’s strategic choice and the strategic choices of all competitors, together with the location of the optimal point(s). An industry might feature an optimal point for each resource group, for each strategic group, or only one optimal point for the entire industry. Figure 6 depicts the firm’s decision tree, as well as the resulting likelihoods of becoming an industry leader according to the results in Tables 4 and 5. From this stylized
decision process, we derive seven key findings pertaining to our simulation results. [Insert Figure 6 about here]
Finding 1: Knowledge of the state of the industry allows firms to choose the best strategy.
We fine large differences in the percentage of chances of becoming the industry leader across states of the industry, ranging from 0 to 33.3 percent. Firms that are able to identify (know) the state of an industry have higher likelihood of becoming an industry leader than those that do not know it.
Finding 2: When the state of the industry is known and the industry is homogeneous (i.e.,
there is a single optimum for the entire industry), firms should follow the industry leader.
When there is only one optimum for the entire industry, following the leader is always the best strategy. On average, there is a 12.2 percent likelihood of becoming the industry leader, whereas the likelihood is only 5.0 percent when choosing another strategy (p = 0.03).
Finding 3: When the state of the industry is known to be fragmented into strategy groups
such that each strategy group has an optimal point, firms should follow their strategic group leader.
When the state of the industry is known and the industry is fragmented, with an optimal point for each strategy group, there is an 18.0 percent likelihood of becoming the industry leader if the firm follows the strategic group leader, compared to 4.8 percent when choosing another strategy (p = 0.002).
Finding 4: When the state of the industry is known and it is fragmented into resource groups
such that each resource group has an optimal point, firms should differentiate (i.e., not follow the same type of leaders as other firms).
In this state of the industry, firms that follow the resource group leader have a 9.7 percent average likelihood of becoming industry leader; that likelihood is only 7.5 percent when they choose another strategy (p = 0.09).
Finding 5: Approaching the question of choosing the correct referent with a flexible
worldview allows firms to increase their chances of becoming an industry leader.
Because, there are vast differences in the likelihoods of becoming the industry leader across fixed and flexible worldviews, firms with a flexible worldview are able to differentiate more accurately among different strategic alternatives and thus increase their chance of becoming industry leader.
Finding 6: Firms with a fixed worldview and no knowledge about the state of the industry
should follow the industry leader.
Assuming that a firm does not have knowledge about the state of the industry, which we take to be equivalent to assuming that all the states have equal probabilities, following the industry leader is the most robust strategy. There is one exception to this finding though: when managers have a strategic group worldview, they have higher chance to become industry leader by
following their strategic group leader. However, in three out of four situations, when firms are able to differentiate more accurately among different strategic alternatives (because of their flexible worldview), they enjoy higher likelihoods of becoming industry leaders.
Finding 7: Firms with a flexible worldview and no knowledge about the state of the industry
should follow their strategic group leader.
Following the strategic group leader is the most robust strategy when the states of the industry have equal probabilities of occurrence. In all such situations, following the strategic group leaders
produces equal or higher likelihoods of becoming the industry leader. 6. DISCUSSION
If firms had perfect information, they would perhaps make perfect decisions. It is only when they do not have a source of perfect information (because of the non-existence, cost, or some other reason) that they are likely to resort to inferences to adapt their strategies (Tang and Liou, 2010). Imitation of referents is one such coping and adaptation behavior. In this work, we have
developed a model of how firms choose the referent group to imitate and adapt their strategies based on their observations of the behavior of their respective referent groups. We provide a formal representation of the dynamics of an industry in which resources get converted into strategic choices, which in turn deliver firm performance, depending on the environment of the industry and the extent of differentiation and concentration among constituent firms. A firm’s performance provides the wherewithal for its resource changes, and then the cycle repeats. Firms may choose among referent groups: (1) their strategic group, (2) their resource group, or (3) their industry as a whole. If a firm chooses to observe only one referent group, it exhibits a fixed worldview. Some firms also may have a flexible worldview, such that they consider each reference group and choose the most relevant one based on the situation. This approach is in effect a fourth type of referent, namely, the flexible referent. Because information/observation may be costly or perhaps due to managerial cognitive biases, firms may choose a specific referent group’s behaviors to observe and imitate. An industry might be characterized by the existence of an optimal point for each resource group, for each strategic group, or only one optimal point for the entire industry. A firm’s objective, to become the leader, then is a function of the manager’s strategic choice and the choices of all competitors with respect to the location of optimal point(s).
6.1 Theoretical contribution
Our simulation model is consistent with work by Powell (2003; Powell and Lloyd, 2005), who measures performance in terms of wins, equivalent to the results we present in Tables 2–5. There are some differences though. First, we do not have local optima (rugged landscape). Second, we have moving as opposed to fixed ones. We also add model complexity in two different ways; local optima could be added easily to our model in the future. Moreover, our results are consistent with those of Gavetti et al. (2005), who show that Analogizers are better than Local
Searchers in a novel and complex landscape (environment). However, Gavetti et al. (2005) and
Gavetti and Rivkin (2005) do not provide specific guidelines for managers to identify a good referent. With this study, we propose and test the performance of three types of referents (best performer in the resource group, strategic group, or entire industry). Our results are also consistent with Denrell’s (2005) emphasis on the dangers of benchmarking (i.e., following the wrong leader).
Along the same vein as the studies by Kunc and Morecroft (2010) and Tang and Liou (2010), this paper also extends the resource-based view by arguing that the mere possession of valuable, rare, non imitable, and non substitutable resources (Barney, 1991) is not sufficient to ensure sustainable superior performance. Whereas, Tang and Liou (2010) demonstrate that is resources configurations that leads to superior performance, not single independent resources, Kunc and Morecroft (2010) argue that these resource configurations should not only be conceptualized, but should also be developed over time and implemented. Our study extends this work by showing that the conceptualization and development of resources should be contingent with environmental conditions. In addition, consistent with these study, our behavioral framework contend that managers are only boundedly rational and that in the face of causal ambiguity there is no assurance that they choose the right referent and develop the right resources and implement the
right strategy.
6.2 Managerial implications
As an example that might help in thinking of how our study translates into the world of practice consider the recent performance of J.C. Penney & Co. (JCP) in the U.S. Department store industry. Walmart is the clear industry leader in the industry and has held its leadership
consistently over time. The industry is grouped in terms of strategies pursed by its participants. A new CEO, Mr. Ron Johnson, was installed in February 2012 to counter threats from Macy’s and Kohl’s in JCP’s strategy group and loss of market share. He disastrously pursued everyday low pricing—a key strategy of the industry leader. JCP’s same store sales fell 20.3 percent in the first half of fiscal year 2013. JCP brought back Mr. Myron Ullman, who had been replaced by Mr. Johnson, as its CEO. Mr. Ullman has brought back sales promotions as a key component of JCP’s strategy. In this instance of a market fragmented by strategy, following the industry leader was disastrous.
Another example may be seen in the European airline industry. Every European major airline is seeking to develop strategies for responding to competition from low-cost airlines (Jarach, 2004). However, every initiative to imitate low-cost airlines, such as EasyJet and Ryanair, seems likely to fail due to differences in resource group memberships. For example, Air France’s low cost subsidiaries are constrained to a large extent in their options by union pressures and cost structure. Following a leader of a different resource group—low cost airlines—when resource groups matter seems to be unwise.
Our results also fit a contingency theory viewpoint; the contingencies and their appropriate strategies constitute a result of our analysis. The findings from our simulations suggest several managerial recommendations, which we present in Figure 7 in the form of a 2 × 2 matrix that
consists of firms’ worldview (fixed or flexible) and firms’ knowledge about the state of the industry (known or unknown). Thus we detail four robust imitation strategies.
[Insert Figure 7 about here]
Firms with a fixed worldview (i.e., fixed referent) and no knowledge of the state of the industry should follow the industry leader; firms with a flexible worldview (i.e., flexible referent) and no knowledge of the state of the industry should follow their strategic group leader. In
addition, firms with a fixed worldview and knowledge of the state of the industry should follow the industry leader if the industry is homogenous, their strategic group leader if optimal points are based on strategic grouping, or differentiate if optimal points are based on resource grouping. Finally, firms with a flexible worldview and knowledge of the state of the industry should follow the industry leader if the industry is homogenous, follow their strategic group leader if optimal points are based on strategic grouping, or differentiate if optimal points are based on resource grouping.
6.3 Limitations and future research
Our paper has some limitations as does any simulation study (Davis, Eisenhardt, and Bingham, 2007; Harrison, Lin, Carroll, and Carley, 2007). In our simulations, we captured the basic dynamics of the R–S–P model in the form of the effect of the group parameters on the overall industry. Accordingly, we studied the effects of perturbations on leadership changes and overall dynamics in the industry; how the factor converting performance into resources on the outcome affected the overall leaders (the parameter played an important role, depending on the strategy condition adopted by firms); and, when different groups adopted different strategy conditions, the ideal strategy conditions that lead to overall leadership. However, the effects of non-constant parameters such as the one converting resource to strategy need further investigation. We held them constant in our simulations, both in strategy space and time. This approach could be
changed to reflect changes in cost over time or a spatially varying cost. The sensitivity analysis of the effect of the other parameters on the outcomes also needs to be studied, as should the effects of inter-coupling of parameters. Future studies using behavior simulation (per Kunc and
Morecroft, 2010) or Bayesian inference (per Tang and Liou, 2010) might be useful to identify values for key parameters and assess the external validity of our framework. Future simulation research could involve varying many more components of our model, including the objective function(s). A fruitful study would also allow for the Bayesian updating of the ideal point estimates (i.e., more generally response surface estimates by industry participants). Developing methodologies for estimating response surfaces from natural experiments would be very promising as these are more applicable for practice in our disciplines than in-petri
experimentation. Lab (or in-petri) experiments with controlled studies would also be very helpful to understand specific learning models and strategic thinking models that might provide
additional knowledge or refinements to incorporate into mathematical models of industry change. 7. CONCLUSION
The R–S–P model provides a basis for empirical implementation as part of a decision support system, because it details the parameters (variables) and functional forms to be calibrated (measured) for a particular industry and its constituents. We believe that empirical examinations of industries using our model will not only lead to a better understanding of industry dynamics but also encourage methodological developments for estimating the functional forms of resource to strategy conversion, strategy to performance conversion, and performance to resource
conversion. Firms using the recommendations derived from our model thus could focus on innovations that might change the competitive space, as well as the relationships among resources, strategy, and performance, which would enhance their competitive advantage.
8. REFERENCES
Adner R, Helfat CE. 2003. Corporate effects and dynamic managerial capabilities. Strategic
Management Journal 24(SI): 1011–1025.
Ansoff HI. 1979. Strategic Management. John Wiley & Sons: New York.
Barney JB. 1991. Firm resource and sustained competitive advantage. Journal of Management 17(1): 99–120.
Bikhchandani S, Hirshleifer D, Welsh I. 1998. Learning from the behavior of others: conformity, fads, and informational cascades. Journal of Economic Perspectives 12(3): 151–170.
Bogner WC, Thomas H, McGee J. 1996. A longitudinal study of the competitive positions and entry paths of European firms in the U.S. pharmaceutical market. Strategic Management
Journal 17(2): 85–107.
Burgelman RA. 1994. Fading memories: a process theory of strategic business exit in dynamic environment. Administrative Science Quarterly 39(1): 24–56.
Collis, DJ. 1994. How valuable are organizational capabilities? Strategic Management Journal 15(WSI): 143–152.
Cool KO, Dierickx I 1993. Rivalry, strategic groups and firm profitability. Strategic Management
Journal, 14(1): 47–59.
Cool K, Schendel DE. 1987. Strategic group formation and performance: the case of the U.S. pharmaceutical industry, 1963–1982. Management Science 33(9): 1102–1124.
Cool K., Schendel DE. 1988. Performance differences among strategic group members. Strategic
Management Journal 9(3): 207–223.
Davis JP, Eisenhardt KM, Bingham CB. 2007. Developing theory through simulation methods.
Academy of Management Review 32(2): 480–499.
Denrell J. 2005. Selection bias and the perils of benchmarking. Harvard Business Review 83(4): 114–119.
Dierickx I, Cool K. 1989. Asset stock accumulation and sustainability of competitive advantage.
Management Science 35(12): 1504–1514.
DiMaggio PJ, Powell WW. 1983. The iron cage revisited: institutional isomorphism and
collective rationality in organizational fields. American Sociological Review 48(2): 147–160. Eisenhardt KM, Martin JA. 2000. Dynamic capabilities: what are they? Strategic Management
Journal 21(10-11): 1105–1121.
Management Journal 17(3): 219–235.
Fiegenbaum A, Sudharshan D, Thomas A. 1990. Strategic time periods and strategic groups research: concepts and an empirical example. Journal of Management Studies 27(2): 133–149. Fiegenbaum A, Thomas H. 1995. Strategic groups as reference groups: theory, modeling and
empirical examination of industry and competitive advantage. Strategic Management Journal 16(6): 461–476.
Furrer O, Sudharshan D, Thomas H, Alexandre MT. 2008. Resource configurations, generic strategies, and firm performance: exploring the parallels between resource-based and competitive strategy theories in a new industry. Journal of Strategy and Management. 1(1): 15–40.
Gavetti G, Levinthal DA, Rivkin JW. 2005. Strategy making in novel and complex worlds: the power of analogy. Strategic Management Journal 26(8): 691–712.
Gavetti G, Rivkin JW. 2005. How strategists really think: tapping the power of analogy. Harvard
Business Review 83(4): 54–63.
Ghemawat P. 1986. Sustainable advantage. Harvard Business Review 74(5): 53–58.
Ghemawat P. 1999. Strategy and the Business Landscape. Addison-Wesley: Reading, MA. Greve HR. 1998. Performance, and risky organizational change. Administrative Science
Quarterly 43(1): 58–86.
Hatten KJ, Schendel DE. 1977. Heterogeneity within an industry: firm conduct in the U.S. brewing industry: 1952–71. Journal of Industrial Economics 26(2): 97–113.
Hannan MT, Freeman J. 1977. The population ecology of organizations. American Journal of
Sociology 82(5): 929–964.
Harrison JR, Lin Z, Carroll GR, Carley KM. 2007. Simulation modeling in organizational and management research. Academy of Management Review 32(4): 1229–1245.
Haunschild PR, Miner AS. 1997. Modes of interorganizational imitation: the effects of outcome salience and uncertainty. Administrative Science Quarterly 42(3): 472–500.
Haveman HA. 1993. Follow the leader: mimetic isomorphism and entry into new markets.
Administrative Science Quarterly 38(4): 593–627.
Hofer C, Schendel, DE. 1978. Strategy Formulation: Analytical Concept. West Publishing: St Paul, MN.
Hotelling H. 1929. Stability in competition. Economic Journal 39(153): 41–57.
perspective. Journal of Air Transportation 9(2): 23–39.
King AW. 2007. Disentangling interfirm and intrafirm causal ambiguity: A conceptual model of causal ambiguity and sustainable competitive advantage. Academy of Management Review 32(1): 156–178.
Kuehn AAm Day RL. 1962. Strategy of product quality. Harvard Business Review, 40(6): 100– 110.
Kunc MH, Morecroft JDW. 2010. Managerial decision making and firm performance under a resource-based paradigm. Strategic Management Journal 31(11): 1164–1182.
Law AM, Kelton WD 2000. Simulation modeling and analysis. third edition. McGraw Hill: Boston, MA.
Levinthal DL. 1997. Adaptation to rugged landscapes. Management Science 43(7): 934–950. Leonard-Barton D. 1992. Core capabilities and core rigidities: a paradox in managing new
product development. Strategic Management Journal 13(2): 111–124.
Lieberman MB, Asaba S. 2006. Why do firms imitate each other? Academy of Management
Review 31(2): 366–385.
Lieberman MB, Montgomery DB 1988. First-mover advantages. Strategic Management Journal 9(S1): 41–58.
Makadok R. 2001. Toward a synthesis of the resource-based and dynamic-capability views of rent creation. Strategic Management Journal 22(5): 387–401.
McGee J, Thomas H. 1986. Strategic groups: theory, research and taxonomy. Strategic
Management Journal 7(2): 141–160.
Mehra A. 1994. Strategic groups: a resource-based approach. Journal of Socio-Economics 23(4): 425–439.
Mehra A. 1996. Resource and market based determinant of performance in the U.S. banking industry. Strategic Management Journal 17(4): 307–322.
Mehra A, Floyd SW. 1998. Product market heterogeneity, resource imitability and strategic group formation. Journal of Management 24(4): 511–531.
Miller D, Chen MJ. 1994. Sources and consequences of competitive inertia: a study of the U.S. airline industry. Administrative Science Quarterly 39(1): 1–23.
Miner AS, Raghavan SV. 1999. Interorganizational imitation: a hidden engine for selection. In
Variations in Organization Science: In Honor of Donald T. Campbell, Baum JAC, McKelvey
Nelson RR, Winter SG. 1982. An Evolutionary Theory of Economic Change. Belknap Press: Cambridge, MA.
Oliva R, Sterman JD. 2001. Cutting corners and working overtime: quality erosion in the service industry. Management Science 47(7): 894–914.
Penrose ET. 1959. The Theory of the Growth of the Firm. John Wiley & Sons: New York. Peteraf MA. 1993. The cornerstones of competitive advantage: a resource-based view. Strategic
Management Journal 14(3): 179–191.
Peteraf MA, Shanley M. 1997. Getting to know you: a theory of strategic group identity.
Strategic Management Journal 18(SSI): 165–186.
Porac JF, Thomas H, Wilson F, Paton D, Kanter A. 1995. Rivalry and the industry model of Scottish knitwear producers. Administration Science Quarterly 40(2): 203–227.
Porter ME. 1985 Competitive Advantage: Creating and Sustaining Superior Performance. Free Press: New York.
Powell TC. 2003. Varieties of competitive parity. Strategic Management Journal 24(1): 61–86. Powell TC, Lloyd CK. 2005. Toward a general theory of competitive dominance: comments and
extensions on Powell (2003). Strategic Management Journal 26(4): 385–394.
Reger RK, Huff AS. 1993. Strategic groups: a cognitive perspective. Strategic Management
Journal 14(2): 103–124.
Repenning NP. 2002. A simulation-based approach to understanding the dynamics of innovation implementation. Organization Science 13(2): 109–127.
Rivkin JW. 2000. Imitation of complex strategies. Management Science 46(6): 824–844.
Scherer FM, Ross D. 1990. Industrial market structure and economic performance, 3rd ed.,
Houghton-Mifflin: Boston.
Schumpeter JA. 1950. Capitalism, Socialism, and Democracy. 3rd ed. Harper: New York.
Schmalensee R. 1985. Do markets differ much? American Economic Review 75(3): 341–351. Shocker AD, Srinivasan V. 1974. A consumer-based methodology for the identification of new
product ideas. Management Science 20(6): 921–937.
Simon AH. 1976. Administrative Behavior. 3rd ed. Free Press: New York.
Sirmon DG, Hitt MA, Ireland RD 2007. Managing firm resources in dynamic environments to create value: looking inside the black box. Academy of Management Review 32(1): 273–292. Sudharshan D, May JH, Shocker AD. 1987. A simulation comparison of methods for new
Suh NP. 1990. The Principles of Design. Oxford University Press: New York.
Tang YC, Liou FM. 2010. Does firm performance reveal its own causes? The role of Bayesian inference. Strategic Management Journal 31(1): 39–57.
Teece DJ, Pisano G, Shuen A. 1997. Dynamic capabilities and strategic management. Strategic
Management Journal 18(7): 509–533.
Thomas H, Venkatraman V. 1988. Research on strategic groups: progress and prognosis. Journal
of Management Studies 25(6): 537–555.
Wernerfelt, B. 1984. A resource-based view of the firm. Strategic Management Journal 5(2): 171–180.
Zajac EJ, Kraatz MS, Bresser RKF. 2000. Modeling the dynamics of strategic fit: a normative approach to strategic change. Strategic Management Journal 21(4): 429–453.
Zott, C. 2003. Dynamic capabilities and the emergence of intraindustry differential firm
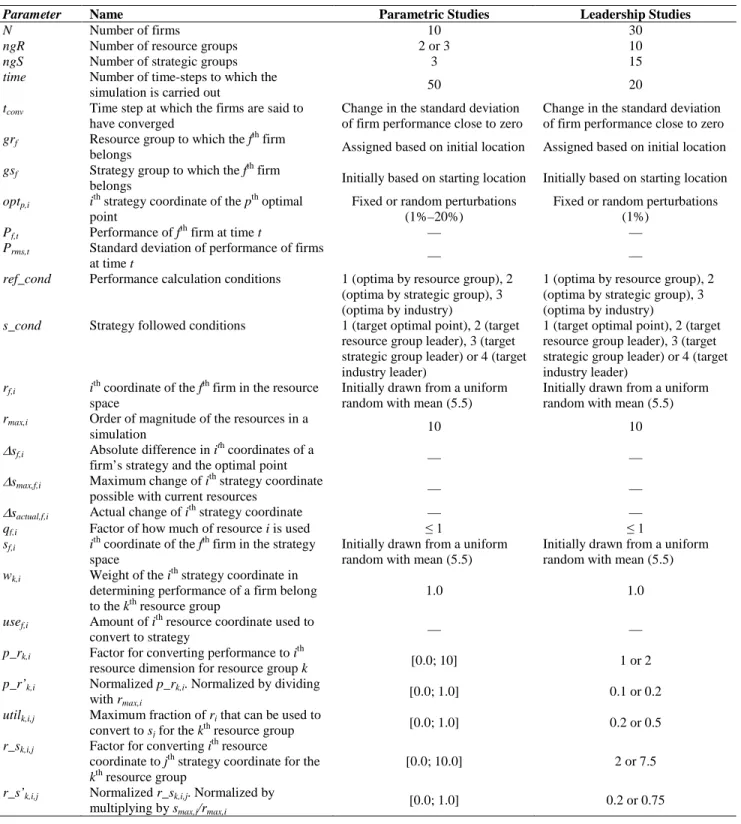
Table 1. Nomenclature and simulation parameter values
Parameter Name Parametric Studies Leadership Studies
N Number of firms 10 30
ngR Number of resource groups 2 or 3 10
ngS Number of strategic groups 3 15
time Number of time-steps to which the
simulation is carried out 50 20
tconv Time step at which the firms are said to
have converged
Change in the standard deviation of firm performance close to zero
Change in the standard deviation of firm performance close to zero grf Resource group to which the fth firm
belongs Assigned based on initial location Assigned based on initial location gsf Strategy group to which the fth firm
belongs Initially based on starting location Initially based on starting location optp,i ith strategy coordinate of the pth optimal
point
Fixed or random perturbations (1%–20%)
Fixed or random perturbations (1%)
Pf,t Performance of fth firm at time t — —
Prms,t Standard deviation of performance of firms
at time t — —
ref_cond Performance calculation conditions 1 (optima by resource group), 2 (optima by strategic group), 3 (optima by industry)
1 (optima by resource group), 2 (optima by strategic group), 3 (optima by industry) s_cond Strategy followed conditions 1 (target optimal point), 2 (target
resource group leader), 3 (target strategic group leader) or 4 (target industry leader)
1 (target optimal point), 2 (target resource group leader), 3 (target strategic group leader) or 4 (target industry leader)
rf,i ith coordinate of the fth firm in the resource
space
Initially drawn from a uniform random with mean (5.5)
Initially drawn from a uniform random with mean (5.5)
rmax,i Order of magnitude of the resources in a
simulation 10 10
∆sf,i Absolute difference in i th
coordinates of a
firm’s strategy and the optimal point — —
∆smax,f,i Maximum change of i
th
strategy coordinate
possible with current resources — —
∆sactual,f,i Actual change of i
th
strategy coordinate — —
qf,i Factor of how much of resource i is used ≤ 1 ≤ 1
sf,i ith coordinate of the fth firm in the strategy
space
Initially drawn from a uniform random with mean (5.5)
Initially drawn from a uniform random with mean (5.5) wk,i Weight of the i
th
strategy coordinate in determining performance of a firm belong to the kth resource group
1.0 1.0
usef,i Amount of ith resource coordinate used to
convert to strategy — —
p_rk,i Factor for converting performance to ith
resource dimension for resource group k [0.0; 10] 1 or 2
p_r’k,i Normalized p_rk,i. Normalized by dividing
with rmax,i
[0.0; 1.0] 0.1 or 0.2
utilk,i,j Maximum fraction of ri that can be used to
convert to sj for the kth resource group
[0.0; 1.0] 0.2 or 0.5
r_sk,i,j Factor for converting ith resource
coordinate to jth strategy coordinate for the kth resource group
[0.0; 10.0] 2 or 7.5
r_s’k,i,j Normalized r_sk,i,j. Normalized by
multiplying by smax,j/rmax,i
Table 2. Results for overall leader when there is no perturbation in the environment (firms in the same resource group follow the same strategy)
Scenario (ref_cond) Strategy (s_cond) Percentage likelihood of firms becoming industry
leaders
1. Optimal point for each RG 2. follow the RG leader 23.0
3. follow the SG leader 0.3
4. follow the industry leader 76.7
2. Optimal point for each SG 2. follow the RG leader 7.2
3. follow the SG leader 55.9
4. follow the industry leader 36.9
3. Single optimal point for the 2. follow the RG leader 8.0
entire industry 3. follow the SG leader 34.2
4. follow the industry leader 57.9
Notes: RG = resource group, SG = strategic group.
Table 3. Results for overall leader when there is no perturbation in the environment (firms in the same strategic group follow the same strategy)
Scenario (ref_cond) Strategy (s_cond) Percentage likelihood of firms becoming industry
leaders
1. Optimal point for each RG 2. follow the RG leader 48.5
3. follow the SG leader 0.0
4. follow the industry leader 51.5
2. Optimal point for each SG 2. follow the RG leader 4.2
3. follow the SG leader 20.0
4. follow the industry leader 75.8
3. Single optimal point for the 2. follow the RG leader 23.7
entire industry 3. follow the SG leader 0.1
4. follow the industry leader 76.2
Table 4. Results for overall leader when there is perturbation in the environment (1%) (firms in the same resource group follow the same strategy)
Scenario (ref_cond) Strategy (s_cond) Percentage likelihood of firms becoming
industry leaders
1. Optimal point for each RG 2. follow the RG leader 16.0
3. follow the SG leader 42.8
4. follow the industry leader 41.2
2. Optimal point for each SG 2. follow the RG leader 26.8
3. follow the SG leader 57.6
4. follow the industry leader 15.6
3. Single optimal point for the 2. follow the RG leader 2.0
entire industry 3. follow the SG leader 31.1
4. follow the industry leader 66.8
Notes: RG = resource group, SG = strategic group.
Table 5. Results for overall leader when there is perturbation in the environment (1%) (firms in the same strategic group follow the same strategy)
Scenario (ref_cond) Strategy (s_cond) Percentage likelihood of firms becoming
industry leaders
1. Optimal point for each RG 2. follow the RG leader 39.1
3. follow the SG leader 6.8
4. follow the industry leader 54.1
2. Optimal point for each SG 2. follow the RG leader 1.2
3. follow the SG leader 59.2
4. follow the industry leader 39.6
3. Single optimal point for the 2. follow the RG leader 23.4
entire industry 3. follow the SG leader 0.8
4. follow the industry leader 75.8
Figure 2. Effect of p_r’r,i on standard deviation of performance at t_conv as a function
Figure 4. Effect of utili,i on standard deviation of performance at t_conv as a function of ref_cond(r) and s_cond(s)