[51
A magnetic polarity time scale for the Early Cretaceous and Late Jurassic
W. Lowrie i and J.G. Ogg 2i Institutfftr Geophysik, ETH-HSnggerberg, 8093 Zi~rich (Switzerland)
2 Scripps Institution of Oceanography, Unit)ersity of California at San Diego, La Jolla, CA 92093 (U.S.A.) Received May 15, 1985; revised version accepted October 30, 1985
The ages of polarity chrons in previous M-sequence magnetic polarity time scales were interpolated using basal sediment ages in suitably drilled DSDP holes. This method is subject to several sources of error, including often large paleontological age ranges. Magnetostratigraphic results have now tied the Early Cretaceous and Late Jurassic paleontological stage boundaries to the M-sequence of magnetic polarity. The numeric ages of most of these boundaries are inadequately known and some have been determined largely by intuition. An examination of relevant data suggests that 114 Ma, 136 Ma and 146 Ma are optimum estimates for the ages of the Aptian/Barremian, Cretaceous/Jurassic and Kimmeridgian/Oxfordian stage boundaries, respectively. Each of these boundaries has a good correlation to the M-sequence of magnetic reversals. The magnetostratigraphic tie-level ages are linearly related to the spreading distance and have been used to calculate a new magnetic polarity time scale for the Early Cretaceous and Late Jurassic. All stage boundaries in this time interval were correlated by magnetic stratigraphy to the proposed new time scale which was then used to estimate their numeric ages. These are, with the approximate relative errors of placement within the M-sequence:
Aptian/Barremian Barremian/H aut erivian Hauterivian/Valanginian Valanginian/Berriasian Berriasian/Tithonian Tithonian/Kimmeridgian
Kimmeridgian/Oxfordian 146 Ma ( + 0.2 Ma) The absolute errors of these interpolated stage boundary ages
114 Ma (+0.5 Ma) 121 Ma ( - 2 . 0 , +1.5 Ma) 126 Ma ( - 0 . 5 , +3.0 Ma) 131 Ma ( - 0 . 5 , +2.5 Ma) 136 Ma (+1.0 Ma) 143 Ma (+0.5 Ma)
depend on the accuracy of the tie-level ages.
1. Introduction
M agnetostratigraphic investigations in paleon- tolog~cally dated sedimentary sequences have con- firmed the Late Cretaceous and Paleogene geo- magnetic polarity record derived from interpreta- tion of oceanic magnetic anomalies [1]. The paleontological ages of basal sediments in DSDP holes drilled on known anomalies agree well with the ages determined for these anomalies from the magnetostratigraphic correlations. A magnetic polarity time scale is obtained by associating the best available numeric ages with key stage boundaries which have been correlated to the polarity sequence and by interpolating the ages of intervening polarity chron boundaries between these tie-levels. For the original time scale of
Institut fur Geophysik, ETH-Zi~rich, Contribution No. 496.
0012-821X/86/$03.50 © 1986 Elsevier Science Publishers B.V.
Heirtzler et al. [2] no tie-level was available be- yond the oldest radiometrically dated continental lavas. The time scale of LaBrecque et al. [3] in- cluded the magnetostratigraphic correlation of the Tertiary/Cretaceous boundary in the Gubbio sec- tion [4] and an improved sequence of Late Creta- ceous polarity [5]. Subsequent versions of the late Cretaceous and Cenozoic polarity time scale differ from each other in their assumptions concerning the number of acceptably well dated stage and sub-stage boundaries and the numeric ages associ- ated with them [1,6-8].
The ages of the Late Jurassic and Early Creta- ceous M-sequence polarity chrons are less well known. Time scales have been calibrated using the paleontological ages of basal sediments in suitably placed DSDP holes. The time scales of Larson and Pitman [9] and Larson and Hilde [10] were based on the assumption that the sea-floor spreading rate
342
on the Hawaiian lineations remained constant. The ages of reversal boundaries were dated by interpolating linearly between two groups of sites, near the young and old ends of the M-sequence respectively. Vogt and Einwich [11] added extra sites to the younger group and an early Valanginian tie-point at DSDP site 387 near the middle of the sequence, between M15 and M16. Their time scale was interpolated on two linear segments corre- sponding to visual optimum fits.
The ranges of the basal sediment paleontologi- cal ages at these DSDP tie sites are large, fre- quently greater than an entire stage. At sites 303 and 304 nannofossil and foraminiferal age esti- mates have each a two-stage range with the nan- nofossil ages a stage older than the foraminiferal ages. In addition, the locations of the DSDP sites relative to the anomaly sequence are sometimes imprecise, particularly for DSDP sites 100 and 105 at the old end of the sequence. As a result, the M-sequence magnetic polarity time scales are in- adequately calibrated and predict incorrect ages for chron boundaries.
2. Magnetostratigraphic correlation of M-sequence tie-levels
The Aptian/Barremian, Cretaceous/Jurassic and Kimmeridgian/Oxfordian boundaries are now reasonably well correlated to the magnetic reversal pattern. The magnetostratigraphic correlations dif- fer substantially from the associations between stage boundaries and magnetic anomalies predict- ed by previous M-sequence time scales.
The time scales of Larson and Hilde [10] and Vogt and Einwich [11] predicted a mid-Aptian age for M0, the youngest polarity chron of the M-se- quence. M0 has been identified in Italian magne- tostratigraphic sections in the Biancone limestone in the Vicentinian Alps [12] and the Maiolica limestone in Umbria [13]. Foraminiferal and nan- nofossil studies place the age of M0 as earliest Aptian, just younger than the Aptian/Barremian boundary. New results from a reevaluation of the nannofossil stratigraphy of the Umbrian Maiolica sections suggest a slightly higher correlation for this stage boundary, low within M0 (Bralower [14], and personal communication, 1985).
Larson and Hilde [10] predict the Cretaceous/ Jurassic boundary to lie near to M16, and Vogt
and Einwich [11] locate it within and near to the old edge of M17. Magnetostratigraphic investiga- tions in Umbria [15,16] agree with a location near the old edge of M17. However, a different correla- tion of the boundary close to M18 was found in limestones from the southern Alps [17] and in DSDP sediments from the northern Atlantic [18]. Investigations of the magnetic polarity sequence in the Berriasian type section in southern France [19,20] imply a Cretaceous/Jurassic boundary lo- cation older than that found in Umbria, but the stratotype section does not extend completely to the boundary. Discrepancies in the boundary cor- relation result in part from the use of different biostratigraphic schemes [21,22] and the lack of paleontological unity of the definition of the boundary. A reasonable case can be made for a magnetochronologic definition of the Cretaceous/ Jurassic boundary and we propose that it be asso- ciated with the old edge of chron M18 in the magnetic polarity sequence [23].
An early to middle Oxfordian age was predic- ted for M25 [10,11]. However, recent magnetostra- tigraphic results from Jurassic limestones in the Betic Cordillera of southern Spain [24] correlate the Kimmeridgian/Oxfordian boundary within M24B. This correlation is not unique and a slightly different interpretation of the data is followed here, with the boundary within M25.
In the remainder of this paper the Aptian/ Barremian boundary is placed at the old edge of M0, the Cretaceous/Jurassic boundary at the old edge of M18 and the Kimmeridgian/Oxfordian boundary within M25. These correlations form the basis for a new magnetic polarity time scale for the M-sequence of oceanic magnetic anomalies.
3. Revision of the Late Jurassic and Early Creta- ceous polarity time scale
Any attempt to form a magnetic polarity time scale for Late Jurassic and Early Cretaceous time is handicapped by the scarcity of reliable numeric dates for these stages. Most age dates are not obtained directly at a stage boundary but for samples that are allocated biostratigraphically to a stage. Thus the problems of reliability of radiomet- ric age determination are compounded by some- times uncertain biostratigraphic corrdations. Con- sequently, age dates for rocks from neighbouring
stages often overlap and the age of the boundary must be interpolated.
Harland et al. [25] decided that not any of the stage boundaries between the early Cretaceous A l b i a n / A p t i a n and the middle Triassic L a d i n i a n / Anisian boundaries were sufficiently well dated to serve as tie-points in preparing a revised geologic time scale. Accordingly, they estimated the ages of all Early Cretaceous, Jurassic and Late Triassic stage boundaries by assuming equal duration of each stage.
The criteria applied by Harland et al. [25] for acceptability of a tie-level were based on paraboli- cally shaped chronograms as used in the dating of polarity sequences in young lavas [26]. The AI- b i a n / A p t i a n boundary was adopted as a tie-level with a chronogram age of 113 Ma. However, this critical tie-level is not defined entirely satisfacto- rily. The chronogram minimum, although pro- nounced, is far from zero, indicating that many age estimates for the adjacent stages overlap. Hal- lam et al. [27] placed this boundary at 107 Ma, following Kennedy and Odin [28] who considered it to be not younger than 106 Ma or older than 108 Ma.
The A l b i a n / A p t i a n boundary falls within the Cretaceous magnetic quiet interval [13] in which magnetic reversals are absent or unconfirmed and cannot be used as a tie-level for calibrating the M-sequence. However, the A p t i a n / B a r r e m i a n boundary is well correlated to the M-sequence reversal history. Kennedy and Odin [28] estimated its age to be around 112 ( + 2) Ma. Hallam et al. [27] suggest that 114 Ma be used until there are more reliable dates close to the boundary. This compares with an age of 119 Ma derived by as- suming equal stage durations [25].
The assumption of equal stage duration yields an interpolated age of 144 Ma for the Cretaceous/ Jurassic boundary, which is much older than most estimates and falls outside the relevant data (Fig. 1). Armstrong [29] deduced a comparable age (142 Ma) but it depends largely on intrusives from western North America which may be rather im- precisely dated biostratigraphically [27]. Harland et al. [25] computed a chronogram age of 135 Ma for the Berriasian/Tithonian boundary. This data point was discarded because the associated error range (5 Ma) was equal to but not less than their rather arbitrary limit for acceptability. With only
Radiometric Dates • • • D 6 E 2 2 I I I , I I I I I 130 135 1/.0
Estimated Boundary Age (Ma}
Fig. 1. Chronogram of radiometric dates relevant to definition of the Cretaceous/Jurassic boundary (from [25, Table 3.1]), Solid symbols refer to rocks of Early Cretaceous age (upper two lines), open symbols to rocks of Early Jurassic age (lower two lines). Triangles are glauconite dates, squares are other dates. The parameter E 2 [25,26] is minimum at the best esti- mate of the boundary age; half the width of the parabola where E 2 exceeds its minimum value by 1.0 is taken as an estimate of the age error.
slight loosening of this criterion the boundary between Berriasian and Tithonian could have been used as an additional tie-level for their time scale, as we do in this paper. Harland et al. [25] would then have had to interpolate on two segments because the 135 Ma age does not lie on the straight line joining the two tie-levels which they used for linear interpolation.
The relevant Early Cretaceous and Late Jurassic age dates compiled and corrected by Harland et al. [25] are certainly few but they give a chronogram with a well-defined minimum (Fig. 1). It gives an age of 135 Ma for the Cretaceous/Jurassic boundary. The error estimated from the half-width is + 2 Ma. An age of 135 Ma (with a broader error intuitively estimated as + 5 Ma) is judged by Hallam et al. [27] to be the most satisfactory present estimate, with possible preference for a slightly older age. If the glauconite data in Fig. 1 are evaluated alone, they give a boundary age of 133 Ma. The non-glauconite data are too sparse to be used alone but suggest a somewhat higher age of 136-140 Ma. Although glauconites give radio- metric age dates that are often regarded as too
344
low, they can giv e correct ages when properly selected [28]. Glauconite dates constitute an im- portant body of radiometric age data which can not simply be ignored, although extra weight might be given to high temperature data where available. As a compromise with the above we associate an age of 136 (+ 2) Ma with the Jurassic/Cretaceous boundary.
Van Hinte [30] recognized the approximate time equivalence of biozones and constructed a Jurassic time scale by allocating equal length of approxi- mately 1 Ma to each ammonite zone. Using a similar approach Hallam et al. [27] subdivided the Jurassic into 79 equal chrons corresponding ap- proximately to the number (74) of Jurassic am- monite subzones. The duration of each Jurassic stage was estimated from the number of chrons it contains. By this means an age of 146 Ma was inferred for the Kimmeridgian/Oxfordian bound- ary. A much older age of 156 Ma was inferred by the equal stage duration assumption [25], in agree- ment with an age estimated from whole-rock K / A r dates [29]. The construction of a time scale by the equal chron method inherently implies relatively
constant ammonite evolution rates. This assump- tion breaks down in the Cretaceous but appears to hold well for the Jurassic [27]. It is more plausible than assuming equal duration of biostratigraphic stages.
The Hallam et al. [27] time scale gives ages of 114 Ma for the Aptian/Barremian and 146 Ma for the Kimmeridgian/Oxfordian boundaries. We use our above estimate of 136 Ma for the Jurassic/Cretaceous boundary. The correlations of the tie-level stage boundaries to the magnetic polarity sequence and their associated numerical ages are then:
(1) Aptian/Barremian (age 114 Ma), near old edge of M0;
(2) Berriasian/Tithonian (age 136 Ma), near old edge of M18;
(3) Kimmeridgian/Oxfordian (age 146 Ma), within M25.
The ages of the tie-level stage boundaries were plotted against distance along the Hawaiian linea- tions to the corresponding anomalies. The nearly straight-line fit (Fig. 2) lends support to the as- sumption of constant spreading rate on the Hawai-
ttl O + 100 120 I/,0 160 ,~ 17-,118
B
Distance Scale (Hawaiian Lineations) 0 2 0 0 k m | = I 38Z 361 166 303 30Z ~ n a l i n o $ ~ forams I overlap • magnetostratigraphic tie-point I li I i Iliil I I I I I I I I I I I I I M0 1 5 10 15 20M-SEQUENCE POLARITY CHRONS
Time Scale (Hal/am eta/., 1985) 95 Albian 107 Aptian I1/. t~ 118 Barrernian r-- .~ Hauterivian u~ 122 ,~ Valanginian Berriasian Portlandian Kirnmeridgian Oxfordian Callovian 131 135 139 loo 160= I I I I I Ill I 25
Fig. 2. Biostratigraphic ages of basal sediment at DSDP sites drilled on M-sequence anomalies, and magnetostratigraphic correlations of key stage boundaries. The polarity chron lengths are proportional to distance along the Hawaiian lineations assuming a constant rate of sea-floor spreading [10].
ian lineations during formation of the M-sequence magnetic anomalies [9,10] and obviates the need for a change of spreading rate in the Valanginian [11].
The magnetostratigraphic correlations do not agree well with the ages determined for the basal sediments in the DSDP holes used to calibrate the M-sequence (Fig. 2). The position of the straight line implies that the quoted ages of the DSDP holes are mostly too young, by approximately half a stage or more. The ages determined for the older sites 100 and 105 are about a stage too old. This
A p t i a n E I l l , r t41 B a r r e m i a n t M 3 y 121 . . . . ? - - - ? . . . . Ms C M? /49 r H a u t e r i v i a n M 7o e M I O N t 1 2 6 . . . . ? - - - ? . . . . M11 a M t I A C M I 2 V a l a n g i n i a n e I'413 o 131 . . . . ? - - - ? . . . . U M 15 $ B e r r i a s i a n Mr6 M 1 7 - - 1 3 6 • ' M1e L M19 a M 2 0 t T i t h o n i a n e MO M 2 2 J I,~3 . . . t423 u K i m m e r i d g i a n M2~ r I~; 6 M 25 a M 2 6 s M 2 8 O x f o r d i a n S M 2 9 i c M 2 !
Fig. 3. Revised magnetic polarity time scale for Early Creta- ceous and Late Jurassic time. Solid lines represent magnetostra- tigraphically correlated stage boundaries, the radiometric ages of which were used to calibrate the reversal time scale, The ages of the discontinuous stage boundaries have been calculated from their magnetostratigraphic correlations to this time scale.
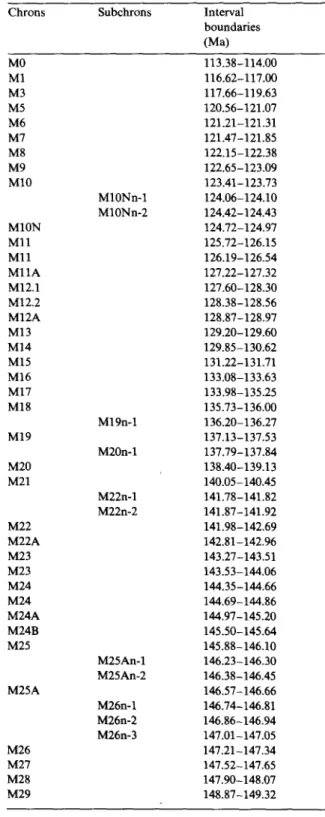
TABLE 1
Revised ages for Early Cretaceous and Late Jurassic intervals of reversed magnetic polarity
Chrons Subchrons Interval
boundaries (Ma) M0 M1 M3 M5 M6 M7 M8 M9 M10 M10N M l l M l l M l l A M12.1 M12.2 M12A M13 M14 M15 M16 M17 M18 M19 M20 M21 M22 M22A M23 M23 M24 M24 M24A M24B M25 M25A M26 M27 M28 M29 M10Nn-1 M10Nn-2 M19n-1 M20n-1 M22n-1 M22n-2 M25An-1 M25An-2 M26n-1 M26n-2 M26n-3 113.38-114.00 116.62-117.00 117.66-119.63 120.56-121.07 121.21-121.31 121.47-121.85 122A5-122.38 122.65-123.09 123.41-123.73 124.06-124.10 124.42-124.43 124.72-124.97 125.72-126.15 126.19-126.54 127.22-127.32 127.60-128.30 128.38-128.56 128.87-128.97 129.20-129.60 129.85-130.62 131.22-131.71 133.08-133.63 133.98-135.25 135.73-136.00 136.20-136.27 137.13-137.53 137.79-137.84 138.40-139.13 140.05-140.45 141.78-141.82 141.87-141.92 141.98-142.69 142.81-142.96 143.27-143.51 143.53-144.06 144.35-144.66 144.69-144.86 144.97-145.20 145.50-145.64 145.88-146.10 146.23-146.30 146.38-146.45 146.57-146.66 146.74-146.81 146.86-146.94 147.01-147.05 147.21-147.34 147.52-147.65 147.90-148.07 148.87-149.32
346
has important consequences for the accuracy of previous M-sequence time scales which rely heavily on these sites for calibration [9-11]. A similar comparison made Ior Late Cretaceous Cenozoic DSDP sites [1] showed good agreement with mag- netostratigraphic results. The poor agreement for the early Cretaceous and late Jurassic warrants a new examination of the dating of the M-sequence oceanic magnetic anomalies.
Linear interpolation was used to obtain numeric ages for the chron boundaries between M0 and M25. The polarity sequence for this interval is that obtained by Larson and Hilde [10], extended by additional oceanic magnetic reversals M25-M29 identified in the Pacific Ocean [31]. Following Harland et al. [25] the anomaly M25-M29 ages were calculated by linear extrapolation from the rest of the M-sequence, although there is no cer- tainty that sea-floor spreading remained constant during their formation. The Middle and Late Oxfordian ages of anomalies M25-M29 agree with magnetostratigraphic results from sections dated with ammonites in north-central Spain [32].
The revised magnetic polarity time scale for the entire Late Jurassic and Early Cretaceous M-se- quence of magnetic anomalies is given in Fig. 3 and Table 1. As in other time scales [9-11] the chron ages are given to two decimal places. The boundaries of magnetized oceanic crustal blocks are located on the Hawaiian lineations within about 1-2 km. Using a spreading rate of 3.3 c m / y r this gives a precision of 0.03-0.06 Ma for the chron boundary ages within the relative polarity se- quence [10]. This does not imply a corresponding absolute accuracy, which depends on the calibra- tion of the tie-points and is around 2-5 Ma.
4. Stage boundary age estimates from magneto- stratigraphic correlations
The ages of Late Jurassic and Early Cretaceous stage boundaries are poorly determined by exist- ing radiometric data and the values quoted are often largely intuitive. Magnetostratigraphic corre- lations of these stage boundaries to the new time scale should provide improved estimates of the numeric ages of the boundaries.
The Barremian/Hauterivian boundary was not correlated to the oceanic magnetic polarity se- quence in the Italian Cismon section [12] as it
could not be recognized with nannofossils. Its expected position was in a part of the section where the magnetic stratigraphy was ambiguous. This boundary also was not located precisely in the Gorgo a Cerbara section. Although the mag- netic stratigraphy here correlates quite well with the M-sequence [13], the nannofossils are mostly poorly preserved and Bralower ([14], and personal communication, 1985) can at present only locate the boundary between M3 and M8. Magnetostrati- graphic zonations at DSDP sites 534 and 603 do not clear up this problem because they have no obvious match to the M-sequence. By involving several additional constraints Ogg [33] has pro- posed a correlation with M5 or M6. Comparison with the new time scale (Fig. 3) suggests an age of around 119-122 Ma for this boundary. The opti- mum estimate may be 121 Ma, corresponding to the M5/M6 correlation.
The Hauterivian/Valanginian boundary is found in the Cismon section at a level where the magnetostratigraphy can not be correlated with the oceanic polarity sequence. In the Fonte del Giordano section [17] it lies in a stratigraphic gap above magnetozone M14n and in the Bosso sec- tion [15] it falls within M13. Micarelli et al. [34] assigned the end of the Valanginian in these sec- tions to the extinction of calpionellids. However, according to Remane [35] the calpionellids disap- pear shortly after the beginning of the Late Valanginian. The Hauterivian/Valanginian boun- dary must then have a younger correlation than with M13. If the Late and Early Valanginian were of roughly comparable lengths, M12 and M l l may be included in the Valanginian. Although a slightly younger correlation with the M-sequence may be found by further magnetostratigraphic study, at present the optimum location for the Hauterivian/ Valanginian boundary is around M l l , which gives it an estimated age of about 126 Ma.
The Valanginian/Berriasian boundary as de- fined by the biostratigraphy of Micarelli et al. [34] was located within M16 in the Fonte del Giordano section and within M16n in the Bosso section. Again a small discrepancy in the placement of this boundary arises from the zonal scheme used. If the later calpionellid zonation scheme of Remane [35] is used, the Valanginian/Berriasian boundary would fall in or just younger than M15. This revision is consistent with the results from the
Berriasian stratotype section [20], where the boundary was in a covered interval above a nega- tive magnetozone which may correspond to M15. In view of these observations we place this boundary just younger than M15 which gives it an estimated age of 131 Ma.
The Tithonian/Kimmeridgian boundary was correlated in Spanish sections [15] with the young edge of M23. Although this correlation may be associated with a hiatus it agrees favourably with a correlation near M22 found in the magnetostratig- raphy of DSDP site 534 [19]. Comparison with the magnetic polarity time scale suggests an age of 143 Ma for this boundary, reasonably close to the 141 Ma age proposed by Van Hinte [30] on the as- sumption of equal biozone durations.
5. Discussion and conclusions
Kent and Gradstein [36] have independently approached the problem of dating the Early Creta- ceous and Jurassic stage boundaries by the same method. They rely on only two calibration tie-levels at the Aptian/Barremian and Kimmeridgian/ Oxfordian boundaries between which they inter- polate linearly assuming a constant sea-floor spreading rate. Fig. 2 implies that this assumption is justified. However, they attach to their tie-levels the ages (119 Ma, 156 Ma) interpolated by Har- land et al. which are respectively 5 Ma and 10 Ma older than the ages used in the present paper. Consequently, they deduce correspondingly older ages for intervening stage boundaries. Their mag- netostratigraphic correlations of stage boundaries in the Early Cretacous come from the Umbrian results [13,15] which use an unorthodox calpionel- lid biostratigraphy [34]. We have modified the correlations as far as possible to conform to the accepted calpionellid scheme [35] and have also incorporated recent DSDP results.
Clearly, estimates of stage boundary ages must be taken with caution. As yet the correlations involved have been described for too few sections and in some cases have not been directly observed but are largely inferred. Correlation problems are enhanced when different paleontological dating schemes (nannofossils, calpioneUids, ammonites, dinoflagellates, etc.) are involved that have not yet been adequately tied to each other. In some sec- tions (e.g. Cismon, Berrias, certain DSDP holes)
the magnetostratigraphy can not be tied uniquely with the polarity sequence derived from oceanic magnetic lineations. It will take considerable effort and time to overcome the obstacles but the combi- nation of biostratigraphy and magnetostratigraphy provides a means of clearing up discrepancies be- tween different dating schemes. The absolute ages of stage boundaries can be estimated as here by correlation to the dated M-sequence of magnetic polarity. The combination of magneto- and bio- stratigraphic correlations have potential of provid- ing a time scale with much finer resolution. This would be of great use in timing sedimentary rate processes such as sedimentation and diagenesis.
For example, Lowrie and Alvarez [37] noted that the Hauterivian had an unusually large thick- ness in the Umbrian Majolica limestone and sug- gested that this might result from the Hauterivian lasting much longer than usually assumed. The new assessments of the non-standard calpionellid zonations of the Italian sections done for this paper are necessarily imprecise and a new biostra- tigraphic study is warranted. However, our reevaluation moves the estimated ages of the start and end of the Hauterivian closer together. This suggests that its thickness in the Umbrian Maiolica limestone is due to high sedimentation rate. This was probably due to high carbonate production which diluted the detrital fraction to such an ex- tent that the remanent magnetization is largely unmeasurable with the precision needed f o r a paleomagnetic study [22,37].
The length of time represented in the new time scale by polarity chrons M0 to M25 is 32 Ma. By comparison Larson and Hilde [10] estimated this time interval at 44 Ma. Consequently, M-sequence spreading rates must have been 35-40% faster than earlier interpreted.
Ackowledgements
We thank F. Meller, D.V. Kent, H. Thierstein and an anonymous reviewer for helpful criticisms of the manuscript.
References
1 W. Lowrie and W. Alvarez, 100 million years of geomag- netic polarity history, Geology 9, 392-397, 1981.
2 J.R. Heirtzler, G.O. Dickson, E.M. Herron, W.C. Pitman IIl and X. Le Pichon, Marine magnetic anomalies, geomag-
348
netic field reversals and motion of the ocean floor and continents, J. Geophy. Res. 73, 2119-2136, 1968.
3 J.L. LaBrecque, D.V. Kent and S.C. Cande, Revised mag- netic polarity time scale for Late Cretaceous and Cenozoic time, Geology 5, 330-335, 1977.
4 W. Alvarez, M.A. Arthur, A.G. Fischer, W. Lowrie, G. Napoleone, I. Premoli Silva and W. Roggenthen, Late Cretaceous-Paleocene geomagnetic reversal time scale: type section in the pelagic limestone sequence at Gubbio, Italy, Geol. Soc. Am. Bull. 88, 383-389, 1977.
5 S.C. Cande and Y. Kristoffersen, Late Cretaceous magnetic anomalies in the North Atlantic, Earth Planet. Sci. Lett. 35, 215-224, 1977.
6 G. Ness, S. Levi and R. Couch, Marine magnetic anomaly timescales for the Cenozoic and Late Cretaceous: a prrcis, critique and synthesis, Rev. Geophys. Space Phys. 18, 753-770, 1980.
7 A.V. Cox, Magnetostratigraphic time scale, in: W.B. Har- land, A.V. Cox, P.G. Llewellyn, C.A.G. Pickton, A.G. Smith and R. Waiters, A Geologic Time Scale, pp. 63-84, Cambridge University Press, Cambridge, 1982.
8 W.A. Berggren, D.V. Kent, J.J. Flynn and J.A. Van Couver- ing, Cenozoic Geochronology, in: Geochronology and the Geological Record, N.J. Snelling, ed., Geol. Soc. London Spec. Pap., 1985.
9 R.L. Larson and W.C. Pitman III, World-wide correlation of Mesozoic magnetic anomalies, and its implications, Geol. Soc. Am. Bull. 83, 3645-3662, 1972.
10 R.L. Larson and T.W.C. Hilde, A revised time scale of magnetic reversals for the Early Cretaceous and Late Jurassic, J. Geophy. Res. 80, 2586-2594, 1975.
11 P.R. Vogt and A.M. Einwich, Magnetic anomalies and sea-floor spreading in the western North Atlantic, and a revised calibration of the Keathley (M) geomagnetic rever- sal chronology, in: Initial Reports of the Deep Sea Drilling Project 43, pp. 857-876, U.S. Government Printing Office, Washington, D.C., 1979.
12 J.E.T. Channell, W. Lowrie and F. Medizza, Middle and Early Cretaceous magnetic stratigraphy from the Cismon section, northern Italy, Earth Planet. Sci. Lett. 42, 153-166, 1979.
13 W. Lowrie, W. Alvarez, I. Premoli Silva and S. Monechi, Lower Cretaceous magnetic stratigraphy in Umbrian pelagic carbonate rocks, Geophys. J.R. Astron. Soc. 60, 263-281, 1980.
14 T.J. Bralower, Biostratigraphic correlation of the Lower Cretaceous M-sequence in the Maiolica limestone, Italy, EOS 65, 865, 1984.
15 W. Lowrie and J.E.T. Channell, Magnetostratigraphy of the Jurassic-Cretaceous boundary in the Maiolica limestone (Umbria, Italy), Geology 12, 44-47, 1984.
16 S. Cirilli, P. Marton and L. Vigliotti, Implications of a combined biostratigraphic and palaeomagnetic study of the Umbrian Maiolica formation, Earth Planet. Sci. Lett. 69, 203-214, 1984.
17 J.G. Ogg, Sedimentology and paleomagnetism of Jurassic pelagic limestones ("Ammonitico Rosso" facies), 203 pp., P h . D . Thesis, University of California, San Diego, Calif., 1981.
18 J.G. Ogg, Late Jurassic-Early Cretaceous magnetostratigra- phy, DSDP site 534, Western North Atlantic, in: Initial Reports of the Deep Sea Drilling Project 76, pp. 685-696, U.S. Government Printing Office, Washington, D.C., 1983. 19 B. Galbrun, Magnrtostratigraphie de la limite Jurassique- Crrtacr. Proposition d'une 6chelle de polarit6 h partir du stratotype du Berriasien (Berrias, Ardrche, France) et de la Sierra de Lugar (Province de Murcie, Espagne), 95 pp., Thrse 36me Cycle, Universit6 de Pads, 1984.
20 B. Galbrun and L. Rasplus, Magnrtostratigraphie du stratotype du Berriasien. Premiers resultats, C.R. Acad. Sci. Pads 198, 219-220, 1984.
21 J.G. Ogg, Magnetostratigraphy of the Jurassic-Cretaceous boundary in the Maiolica limestone (Umbria, Italy): com- ment, Geology 12, 701, 1984.
22 W. Lowrie and L E T . Channell, Magnetostratigraphy of the Jurassic-Cretaceous boundary in the Maiolica limestone (Umbria, Italy): reply, Geology 12, 702, 1984.
23 J.G. Ogg and W. Lowrie, Magnetostratigraphy of the Jurassic-Cretaceous boundary, Geology, in press, 1985. 24 J.G. Ogg, M.B. Steiner, F. Oloriz and J.M. Tavera, Jurassic
magnetostratigraphy, 1. Kimmeridgian-Tithonian of Sierra Gorda and Carcabuey, Southern Spain, Earth Plan. Sci. Lett. 71, 147-162, 1984.
25 W.B. Harland, A.V. Cox, P.G. Llewellyn, C.A.G. Pickton, A.G. Smith and R. Waiters, A Geologic Time Scale, 131 pp., Cambridge University Press, Cambridge, 1982. 26 A.V. Cox and G.B. Dalrymple, Statistical analysis of geo-
magnetic reversal data and the precision of potassium-argon dating, J. Geophys. Res. 72, 2603-2614, 1967.
27 A. Hallam, J.M. Hancock, J.L. LaBrecque, W. Lowrie and J.E.T. Channell, Jurassic and Cretaceous geochronology and Jurassic to Palaeogene magnetostratigraphy, in: Geo- chronology and the Geological Record, N.J. Snelling, ed., Geol. Soc. London Spec. Pap., 1985.
28 W.J. Kennedy and G.S. Odin, The Jurassic and Cretaceous time scale in 1981, in: Numerical Dating in Stratigraphy, G.S. Odin, ed., pp. 557-592, (John Wiley and Sons, Chichester, 1982).
29 R.L. Armstrong, Pre-Cenozoic Phanerozoic time scale--Computer file of critical dates and consequences of new and in-progress decay-constant revisions, in: Contribu- tions to the Geological Time Scale, G. Cohee, M. Glaessner and H. Hedberg, eds., pp. 73-91, American Association of Petroleum Geologists, Tulsa, Okla., 1978.
30 J.E. Van Hinte, A Jurassic time scale, Bull. Am. Assoc. Pet. Geol. 60, 489-497, 1976.
31 S.C. Cande, R.L. Larson and J.L. LaBrecque, Magnetic lineations in the Pacific Jurassic quiet zone, Earth Planet. Sci. Lett. 41,434-441, 1978.
32 M.R. Steiner, J.(3. Ogg, G . Melendez and L. Sequeiros, Jurassic magnetostratigraphy, 2. Middle-Late Oxfordian of Aguilon, Iberian Cordilleita, Northern Spain, Earth Planet. Sci. Lett. 76, 151-166, 1985.
33 J.G. Ogg, Early Cretaceous magnetostratigraphy of sedi- ments in the Western Central Atlantic, DSDP sites 603 and 534, in: Initial Reports of the Deep Sea Drilling Project 93, in press, U.S. Government Printing Office, Washington, D.C., 1985.
34 A. Micarelli, M. Potetti and M. Chiochine, Ricerche micro- biostratigrafiche sulla Maiolica delle regione umbro- marchigiano, Stud. Geol. Camerti 3, 57-86, 1977.
35 J. Remane, Calpionellids, in: Introduction to Marine Mi- cropaleontology, B.U. Haq and A. Boersma, eds., pp. 161-170, Elsevier, New York, N.Y., 1978.
36 D.V. Kent and F.M. Gradstein, A Cretaceous and Jurassic geochronology, Geol. Soc. Am. Bull., in press, 1985. 37 W. Lowrie and W. Alvarez, Lower Cretaceous magnetic
stratigraphy in Umbrian pelagic limestone sections, Earth Planet. Sci. Lett. 71, 315-328, 1984.
![Fig. 1. Chronogram of radiometric dates relevant to definition of the Cretaceous/Jurassic boundary (from [25, Table 3.1]), Solid symbols refer to rocks of Early Cretaceous age (upper two lines), open symbols to rocks of Earl](https://thumb-eu.123doks.com/thumbv2/123doknet/15028635.686785/3.822.459.709.94.414/chronogram-radiometric-relevant-definition-cretaceous-jurassic-boundary-cretaceous.webp)