A Simple Remote Sensing Ground Receiving System for Interest Creation in Systems Engineering and Geophysics Research Abdelatif Hassini
16
0
0
Texte intégral
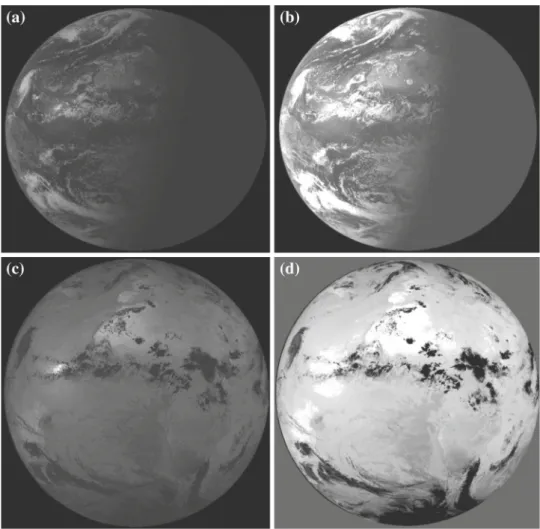
Figure
+7
Documents relatifs