w w w. a c b i o . o r g . z a
The political
economy of Africa’s
burgeoning chemical
fertiliser rush
Contents
Acronymns
3
Key findings
5
About this paper
5
Executive summary
6
Introduction
8
Soil
9
Soils of Africa
10
Soil/plant chemistry
10
Fertilisers, soil fertility and agriculture
11
The global fertiliser industry
14
Fertiliser in Sub-Saharan Africa
17
Fertiliser supply chains in Africa
18
Current fertiliser players in Africa
19
Notore Chemical Industries
20
OCP Group SA
20
Omnia
20
Export Trading Group (ETG)
20
Future fertiliser trends in Sub-Saharan Africa
21
Africa’s coming extractives boom
21
Fertiliser and the Green Revolution push in Africa
22
The Abuja Declaration
23
Policy
25
Finance
25
The Alliance for a Green Revolution in Africa (AGRA)
26
AGRA’s Soil Health Programme (SHP)
27
International Fertiliser Development Centre (IFDC)
28
United States Agency for International Development (USAID)
30
The G8 New Alliance and Grow Africa
30
Yara
31
Fertiliser subsidies in Sub-Saharan Africa
34
Measuring the impacts of Input Subsidy Programmes (ISPs)
34
Objectives
34
Design and implementation
36
Results
36
Exit strategies and graduation
37
Malawi
38
Conclusion
41
Annexure 1. Soil forming factors and processes
42
Annexure 2. The Abuja Declaration on Fertilisers
44
The African Centre for Biosafety (ACB) is a non-profit organisation, based in Johannesburg, South Africa. It was established to protect Africa’s biodiversity, traditional knowledge, food production systems, culture and diversity, from the threats posed by genetic engineering in food and agriculture. It, has in addition to its work in the field of genetic engineering, also opposed biopiracy, agrofuels and the Green Revolution push in Africa, as it strongly supports social justice, equity and ecological sustainability.
The ACB has a respected record of evidence-based work and can play a vital role in the agro-ecological movement by striving towards seed sovereignty, built upon the values of equal access to and use of resources.
©The African Centre for Biosafety www.acbio.org.za
PO Box 29170, Melville 2109 South Africa Tel: +27 (0)11 486 1156
Design and layout: Adam Rumball, Sharkbouys Designs, Johannesburg Cover image: http://www.bls.gov/opub/btn/volume-2/images/2-12-image.jpg
The political economy of Africa’s burgeoning chemical fertiliser rush 3
Acronyms
ACB African Centre for Biosafety
ACTESA Alliance for Commodity Trade in Eastern and Southern Africa ADMARC Agricultural Development & Marketing Corporation (Malawi) AECF African Enterprise Challenge Fund
AFAP African Fertiliser Agribusiness Partnership AfDB African Development Bank
AFFM African Fertiliser Financing Mechanism AFSTA African Seed Trade Association
AGMARK Agricultural Markets Development Trust AGRA Alliance for a Green Revolution in Africa
AISE Agricultural Input Supplies Enterprise (Ethiopia)
AMITSA Regional Agricultural Input Market Information and Transparency System APC Agribusiness Partnership Contract
ASHC African Soil Health Consortium
ASIP Agricultural Input Supply Programme (Malawi)
AU African Union
AUC African Union Commission
CAADP Comprehensive African Agricultural Development Programme CCPC Competition and Consumer Protection Commission (Zambia) CGIAR Consultative Group on International Agricultural Research COMESA Common Market of Eastern and Southern Africa
COMRAP COMESA/ACTESA’s Regional Agro-inputs Programme CSO Civil Society Organisation
DAP Diammonium Phosphate
DfID Department for International Development (UK) DRC Democratic Republic of Congo
EAC East African Community
ECOWAS Economic Community of West African States ESAFD East and Southern Africa Division
FARA Forum for Agricultural Research in Africa FISP Farm Input Subsidy Programme
G8 Group of Eight
IFA International Fertiliser Association
IFDC International Fertiliser Development Centre IFPRI International Food Policy Research Institute IPI International Potash Institute
IPNI International Plant Nutrition Institute ISFM Integrated Soil Fertility Management ISP Input Subsidy Programmes
JFPI Joint Fertiliser Procurement Initiative
K Potassium
MAP Monoammonium Phosphate
4 A F R I C A N C E N T R E F O R B I O S A F E T Y
MT Metric Ton
N Nitrogen
NWAFD North and West Africa Divisions
NEPAD New Economic Partnership for Africa’s Development NGO Non-governmental Organisation
NORAD Norwegian Agency for Development Co-Operation
NPK Complex fertilisers containing a blend of Nitrogen, Phosphate and Potassium OCP Office Chérifien des Phosphates, also known as OPC Group SA
OPV Open-pollinated Variety
P Phosphorus
RECs Regional Economic Communities
SADC Southern African Development Community SAGCOT Southern Agricultural Growth Corridor of Tanzania SFFRM Smallholder Farmer Fertiliser Revolving Fund (Malawi) SHP Soil Health Programme (AGRA)
TSP Triple-super Phosphate
UN United Nations
UEMOA Union Economique et Monétaire Ouest Africaine UN ECA United Nations Economic Commission for Africa UN FAO United Nations Food and Agriculture Organisation USAID United States Agency for International Development WEF World Economic Forum
The political economy of Africa’s burgeoning chemical fertiliser rush 5
Key findings
• Agriculture is dependent upon nutrients found in the soil; humans have been supplementing soil nutrients with external sources such as animal manure and leguminous plants since the dawn of agriculture.
• Today the global fertiliser industry is controlled by a handful of extremely powerful corporations. In 2012 the global sales of NPK fertilisers alone were over US$200 billion. In 2010 BHP Billiton, the world’s largest mining company, attempted a US$40 billion hostile takeover of Canada’s Potash Corp, one of the world’s largest fertiliser companies.
• Fertiliser use is currently low in Sub-Saharan Africa—1.6% of the global total. However, parts of the continent are said to be teetering on the edge of a natural gas boom which is expected to stimulate massive investments in fertiliser production across the continent. Accordingly the fertiliser industry has planned investments totalling upwards of US$8 billion in new fertiliser plants. • Fertiliser is central to the new Green
Revolution push in Africa. The Abuja Declaration on Fertilisers for an African Green Revolution (2006) called for an increase in average fertiliser use on the continent, from 8kg per ha to 50kg per ha, by 2015.
• Similarly, the Alliance for a Green Revolution in Africa (AGRA) has placed increased fertiliser use at the centre of its activities. By the end of 2013, 55% of AGRA’s Soil Health Programme grants had been spent on increasing fertiliser supply in 12 African countries. AGRA’s largest single grant to date was its US$25 million contribution towards the establishment of the African Fertiliser Agribusiness Partnership (AFAP).
• The private sector is most conspicuously represented within the new Green Revolution push by the Norwegian Fertiliser giant, Yara International ASA. Yara is one of the key private sector
players behind the New Alliance for Food Security and Nutrition, initiated by the Group of Eight (G8), and the Grow Africa platform, a joint programme of the World Economic Forum (WEF), the African Union Commission (AUC) and the New Economic Partnership for Africa’s Development (NEPAD).
• The re-emergence of fertiliser subsidies in many African countries has further complicated the issue. In 2011 ten African countries spent over US$1 billion on agricultural input subsidies. ‘Smart’ (or targeted) subsidies have been encouraged by the Abuja Declaration and other organisations such as the World Bank. However, documented experiences have described problems such as elite capture (i.e. the appropriation of resources intended to benefit the larger population by a few individuals or organisations of superior status); political interference; and the divergence of scarce resources away from important areas of agricultural research, such as crop and soil science.
About this paper
In the past few years the African Centre for Biosafety (ACB) has embarked on a research programme to track, monitor and critique the plans and activities of the Alliance for aGreen Revolution in Africa (AGRA) and, more
generally, initiatives aimed at advancing a Green Revolution in Africa. These include the links to private agribusiness expansion and the implication of these for small-scale
farmers on the continent. ACB has identified
seed and soil fertility as strategic entry points
into broader debates about agricultural development in Africa, and the role of private profit in improving conditions of producers and consumers. This is based on the current importance being placed on ‘modern’ input
supply to kickstart the Green Revolution. The
wider use of improved seed and inorganic or synthetic fertilisers is considered essential in the Green Revolution modernisation of African agriculture.
6 A F R I C A N C E N T R E F O R B I O S A F E T Y
In 2012 ACB produced an overview and initial critique of AGRA’s core programmes on seed and soil health1, followed in 2013 by a detailed response to AGRA’s Africa Agricultural Status Report 20132. As this project progressed ACB realised the need also to track implementation, otherwise the enquiry would remain at the level of broad, discursive critique only. It is important to discern how farmers and their organisations are engaging with Green Revolution projects and programmes.
Accordingly ACB has launched a field research programme in partnership with farmers, farmer organisations and other Civil Society Organisations (CSOs) on the continent, both to track the actual implementation of AGRA and other Green Revolution projects, and to consider the impacts on small-scale farmers as a differentiated category in which not everyone is equally affected. ACB will use this research to inform strategic and practical approaches together with its partners at national, regional and continental levels in its work towards food sovereignty in Africa.
This paper seeks to cover some of the trends in fertiliser use in Africa, provide an overview of the policy environment and explore the connections between some of the key players involved. This publication will later be accompanied by a short study on the African Fertiliser and Agribusiness Partnership (AFAP), which was launched at the African Green Revolution Summit of 2012.
Executive summary
Soil performs numerous functions vital to life on Earth, including the filtration and regulation of water cycles, the recycling of decaying plant and animal matter and as a regulator of biological and chemical cycles (including those of carbon, phosphorus and nitrogen). It also provides the medium upon which food, medicinal and fibre crops are grown for human use, together with a wide range of important building materials, such as clays and sand.3 The diversity and abundance of life that exists within the soil is greater than in any other ecosystem.4Healthy plant growth requires the presence of 16 essential elements. Of these elements, hydrogen, carbon and oxygen are obtained mostly from the air and water; the remaining elements come from the soil. Some of these nutrients, including nitrogen (N), phosphorus (P), potassium (K), calcium (Ca), magnesium (Mg) and sulphur (S), are required in large quantities and are known as macronutrients. The link between soil fertility and agricultural production has been recognised since the beginning of recorded history. In Europe archaeological evidence has emerged of farmers using manure and water management techniques up to 8,000 years ago. In The Odyssey Homer refers to the application of animal manure to vineyards.5
The emergence of a coal-based economy in the mid-19th century, for the first time, provided large sources of external nutrients for agriculture and led us down the present trajectory of high external input agriculture. Many of the chemicals and processes used to create fertilisers were first used for the manufacture of explosives. The discovery of the Haber-Bosch process in 1908 (whereby atmospheric Nitrogen could be converted into Nitrogen fertilisers, using natural gas) dramatically increased access to cheap fertiliser. After the Second World War, much of the excess munitions stockpiles left-over were re-channeled into fertiliser production. By the end of the 20th century global fertiliser use had increased tenfold.
According to the Food and Agriculture Organisation (FAO) of the United Nations (UN), the total demand for fertiliser nutrients is expected to grow by 1.9% per annum from 2012 until 2016, to reach a total consumption of 194.1 million tons.6 To meet this, the
International Fertiliser Association (IFA) expects the implementation of 58 new urea plants between 2010 and 2015, while rising natural gas prices in the Middle East (which currently accounts for 32% of global urea exports) has spurred interest in exploiting natural gas sources in Africa.
In the global fertiliser industry, scale is everything. A modern urea plant costs approximately US$1 billion to construct.7 In 2012 global sales of NPK fertilisers (complex fertilisers providing nitrogen, phosphorus and
The political economy of Africa’s burgeoning chemical fertiliser rush 7
potassium) were worth over US$200 billion. The same year, the two biggest fertiliser companies by revenue (Agrium and Yara) made US$16.5 billion and US$15 billion respectively. Profit margins have also been rising—from 2008 to 2013 the average profits of the top ten global fertiliser companies increased by 173%. At the height of the fertiliser price boom of 2008-2009, members of Canpotex, Canada’s legal export cartel for potash fertilisers (containing potassium), were recording profit margins in the region of 480%.
With fertiliser production limited to natural gas deposits (in the case of nitrogen-based fertilisers) or geographically sparse mineral deposits of potash and phosphate rock, the last five years have seen a flurry of activity, with some of the world’s largest mining companies entering the fray. In August 2010 BHP Billiton, the world’s largest mining company, launched a massive US$40 billion hostile takeover bid for Canadian mining house The Potash Corporation of Saskatchewan (commonnly known as Potash Corp). The importance of Potash Corp and its vast potash reserves was not lost on the Canadian government, who rejected the bid, or the Chinese government, who gave tacit backing to state-owned chemical company Sinochem to try to disrupt the bid by BHP. Bill Gates, through his private investment vehicle, is the largest shareholder in the Canadian rail network, which has just signed a ten year transport contract with the Canadian potash cartel. Gates has also invested in Egyptian fertiliser company OCI N.V.
Though Africa accounts for less than 1.6% of global fertiliser consumption, parts of the continent are said to be poised on the brink of a natural gas boom expected to stimulate massive investments in fertiliser production across the continent. A brief review of the literature reveals planned investments upwards of US$8 billion in this regard. Parallel to this isthe recently established push for an African Green revolution, which seeks to replicate the Green Revolution experiences of Asia and Latin America on the African continent. While slightly more nuanced than earlier attempts, the current push continues to drive small-scale farmers in Africa to adopt expensive inputs and produce surpluses for market. Fertiliser plays a fundamental role in
this model. Several large fertiliser companies, including Yara, Notre Chemical Industries of Nigeria, South Africa’s Omnia, and the Office Chérifien des Phosphates in Morocco, also known as OCP Group SA (OCP), already have significant operations on the continent; they stand to benefit handsomely from this fertiliser impetus.
The push for increased fertiliser consumption across the continent is most clearly articulated in the Abuja Declaration on Fertilisers,
announced at the African fertiliser summit of 2006. It calls for Africa to increase its overall fertiliser use to 50kg per ha by 2015, and proposes a number of actions to achieve this. Although accurate and up-to-date information on progress towards this goal is difficult to find, it is fairly clear that this target is a long way from being met. The African Fertiliser Funding Mechanism (AFFM), proposed under article 11 of the Declaration, is still not fully operational. Despite progress being slow, many of the policy initiatives have acquired lives of their own within African Regional Economic Communities (RECs).
In the intervening period the Alliance for a Green Revolution in Africa (AGRA) has been, arguably, the most prominent platform advocating the Green Revolution in Africa, and its language and logic is echoed in the more recently created Grow Africa, and the G8’s New Alliance on Food Security and Nutrition. By the end of 2013 AGRA’s soil health programme had devoted US$37.5 million—55% of its total investments—to increasing fertiliser supplies http://www.oneacrefund.org/blogs/tag/fertilizer/56
8 A F R I C A N C E N T R E F O R B I O S A F E T Y in Africa. AGRA’s largest single commitment to date has been a US$25 million contribution towards the establishment of the African Fertiliser Agribusiness Partnership (AFAP), a public-private partnership. AFAP provides credit guarantees and grant funding to fertiliser companies wishing to establish operations in the three countries of AFAP’s initial focus— Ghana, Mozambique and Tanzania.
The International Fertiliser Development Centre (IFDC) has had a presence on the continent since 1987 and is another significant player in the fertiliser push in Africa. The IFDC’s donors include all the major fertiliser industry bodies, and from 2009 to 2011 it also received over US$16.6 million from AGRA. Its projects across the continent range from strengthening agro-dealer and input networks to the privatisation of Rwanda’s fertiliser value chain. It works closely with AGRA and the United States Agency for International Development (USAID) on a number of projects. In 2013 it trained nearly 690,000 Agribusiness stakeholders in Africa. USAID has been very active in West Africa, working on the harmonisation of fertiliser policy and regulations, and agro-dealer and farmer training. It has also funded a number of studies, conducted by the IFDC, into increasing fertiliser use in seven countries in eastern and southern Africa.
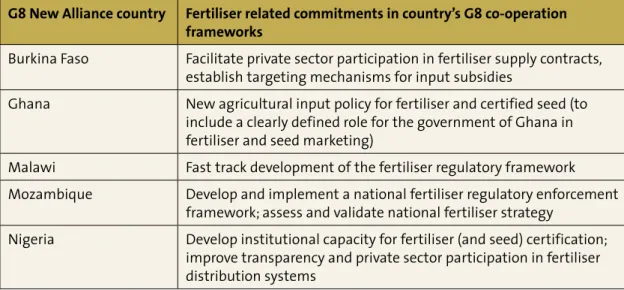
Grow Africa and the New Alliance for Food and Nutrition have also prioritised the increased use of fertilisers. Five of the country co-operation frameworks within the New Alliance call for the creation of fertiliser policy, as well as more private sector participation in the fertiliser arena. The fertiliser industry is also well represented within the Grow Africa initiative, in whichthe Norwegian fertiliser giant, Yara, is by far the most prominent actor. Yara is the world’s largest producer of ammonia, nitrates and complex NPK fertiliser and has had a presence on the African continent since 1929. The company celebrated its centenary in 2005 by launching the Yara Foundation and the Yara Prize for a Green Revolution. (Controversially, the first prize winner was Ethiopian president Meles Zenawi). Yara has been one of the key players behind the World Economic Forum’s foray into African agriculture, through Grow Africa and the agricultural corridors approach.
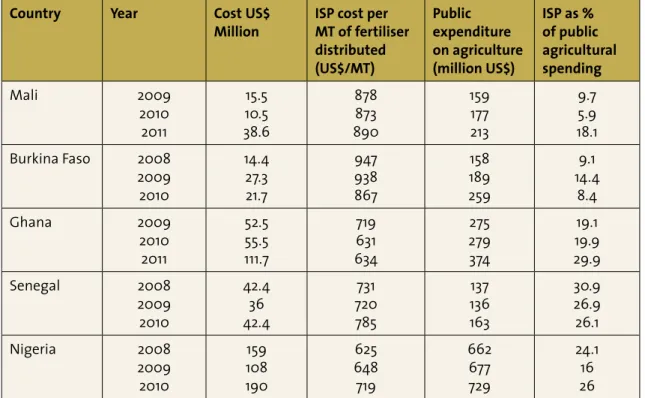
The issue of fertiliser use in Africa has been further complicated in recent years through the revival, after a long period of being out of favour, of fertiliser subsidy programmes, described arguably as ‘the region’s most important agricultural policy development in recent years’.8 In 2011 ten African countries spent approximately US$1.05 billion on Input Subsidy Programmes (ISPs), amounting to 28.6% of their public expenditures on agriculture. Approximately 40% of the fertiliser consumed in Sub-Saharan Africa is subsidised to varying degrees.
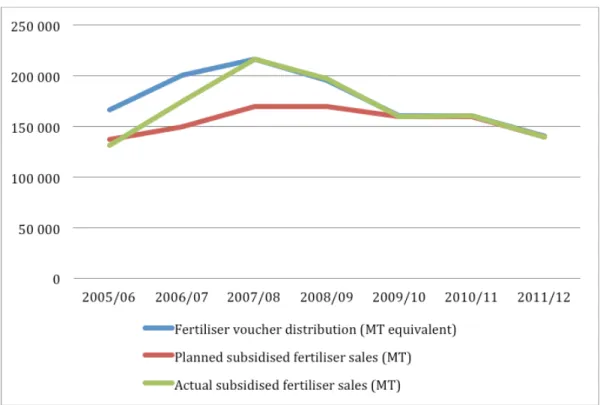
Inspired by the sudden resurgence in ISPs, a number of detailed academic studies on fertiliser subsidies have recently been undertaken and have found mixed results at best. In Zambia, Malawi and Tanzania evidence has emerged of elite capture, even though the subsidies were supposed to be targeted at the poorest. Another commonly reported problem is the ‘leakage’ of fertiliser meant for the subsidy programme into commercial markets or even other countries. Further, fertiliser subsidies divert scarce resources away from important research into crop and soil science. In Zambia less than 15% of annual agricultural expenditure goes into such research, compared with 40–70% of the agricultural budget which is spent on subsidy programmes. Malawi, which went from a period of food deficit to food surpluses following the implementation of input subsidies, is often held up as a shining example of the effectiveness of ‘smart subsidies ‘. However, issues with agricultural data, the problem of elite capture and the huge costs of these programmes have left many experts questioning the long-term sustainability of ISPs.
Introduction
Recent initiatives to modernise African agriculture have placed a strong focus on the need for increasing adoption of a Green Revolution package by Africa’s smallholder farmers, including the use of fertilisers. This is not a paper about soil health
methodologies as an alternative to fertiliser, or the well-known environmental impacts caused
The political economy of Africa’s burgeoning chemical fertiliser rush 9
by chemical fertilisers, both of which have been covered in much detail elsewhere. Some basic information is given regarding soil processes and formulation, and the role of different chemical elements in plant nutrition, but only in an attempt to convey the complexity of the soil fertility issue and to contrast this with the very prescriptive offerings of the fertiliser industry, which tends to focus production on the macro nutrients—Nitrogen (N), Phosphorus (P) and Potassium (K).
The Green Revolution push in Africa cannot be seen as isolated from wider global events, such as climate change and the new scramble for resources underway in the extractive industries. Whether these are linked explicitly to Africa or not, they will inevitably have an impact, politically, economically and environmentally.
This push is being conducted on multiple fronts by a multitude of actors, many of whom are in cahoots. The recent implementation of fertiliser subsidy programmes in a number of African countries has further complicated the issue, as the whims and goals of the international donor community and national governments are often not in unison. Though the Abuja Declaration on Fertilisers (a process that has the tacit approval of the international donor community) has called for the implementation of smart subsidies, evidence on the ground has found that where these have been attempted numerous political economy issues have come to the fore.
The paper opens with a brief overview of soil matters, the development of soil health methodologies (including the implementation of chemical fertilisers), and an overview of the current global fertiliser industry and recent trends. It gives a brief summary of the situation in Africa before profiling some of the key policy and initiatives and organisations behind the fertiliser push in Africa, before concluding with an overview of fertiliser subsidies in Africa.
Soil
9“Without soil, the plant as we know it
would not function.”10
The word soil conjures up a plethora of meanings and images, some technical, some highly emotive. Those who have committed to its study define the soil as ‘any loose material at the surface of the Earth that is capable of supporting life’.
Soil forms as the result of interactions between the atmosphere, the biosphere and the geo-sphere. It performs many functions that are vital to life on Earth, including the filtration and regulation of water cycles, the recycling of decaying plant and animal matter and as a regulator of biological and chemical cycles (including those of carbon, phosphorus and nitrogen). Finally, the soil provides the medium upon which food, medicinal and fibre crops are grown for human use, and also a wide range of important building materials, such as clays and sand. The diversity and abundance of life that exists within the soil is greater than in any other ecosystem on the planet.11
Soils comprise varying proportions of minerals, water, air and organic matter. Broadly speaking, a sample of soil can contain up to 95%
minerals, between 15%–35% water and air, and up to 5% organic matter. (In arid regions the amount of organic matter and water will be much less.) There are three main classes of soil particle, based on size: clay (<0.002mm in diameter), silt (0.02–0.64mm) and sand (0.063–2.0 mm). Soil properties also vary with depth, forming a series of horizontal layers called ‘horizons’, with higher levels of organic matter generally found towards the surface. Just below the surface is the topsoil, which is considered the engine room of soil. If this topsoil is removed, without interventions it could take hundreds of years to be fully regenerated.
There is an inordinate variety of soil forming factors and processes that influence the properties of soil and thus its suitability for certain human actions, such as agriculture. The most important factors in soil forming processes are the parent material from which the soil is derived, the topography of the soil (for example, soils found on slopes are
10 A F R I C A N C E N T R E F O R B I O S A F E T Y more freely draining of water than those at the bottom of hills), climatic factors such as precipitation and average temperatures and the presence of living organisms. All of these factors are influenced over periods of time that can vary from hundreds to thousands of years. Among the most common of the soil
forming processes are physical and chemical weathering, leaching, salinisation or the presence of burrowing mammals or beetles and earthworms (in temperate zones) or ants and termites (in the tropics).
Soils of Africa
Large parts of Africa are unsuitable for the cultivation of crops. According to the Soil Atlas of Africa, a joint collaboration between the European Union, the United Nation’s Food and Agriculture Organisation (UN FAO) and the African Union (AU), just 8% of the continent’s land surface is covered by soil that is ‘relatively free of natural constraints for agriculture’.12 Soil degradation is said to affect about 65% of African farmland. On average, 600 kg N/ha has been lost from African soils during the last 30 years, from around 200 million ha of cultivated land.
In tropical Africa much of the land surfaces are 60–100 million years old, resulting in soils that have been heavily weathered and suffered nutrient loss. Soils under tropical rainforests are not naturally fertile, but depend instead on the high and constant supply of organic matter from natural vegetation. The productivity of the soil is thus quickly and dramatically diminished when this cycle is broken, such as through commercial logging or clearance for plantations, both of which have been on the rise across the continent. In the year 2000 the FAO reported that deforestation was occurring at double the average rate observed in the rest of the world.13
Water is critical to soil health and much of the continent receives either too little or too much. In areas where annual precipitation is less than 250mm, vegetation is very low or non-existent, severely limiting soil-forming processes. Conversely, some areas receive too much precipitation at specific times, i.e. when rainfall exceeds the rate of evaporation. This waterlogs the soil and drives important processes such as
the leaching of nutrients from the topsoil into lower soil horizons, out of reach of plant root systems.
Soil/plant chemistry
Healthy plant growth requires the presence of 16 essential elements of which hydrogen, carbon and oxygen are mostly obtained from the air and water. The remaining elements come from the soil. Some of these nutrients, including nitrogen (N), phosphorus (P), potassium (K), calcium (Ca), magnesium (Mg) and sulphur (S), are required in large quantities by the plant, and are called macronutrients. Plants need large quantities of N, P and K, commonly known as the primary nutrients, so these are usually depleted from the soil first. Ca, Mg and S are known as secondary nutrients. The micronutrients are boron (B), copper (Cu), Iron (Fe), chloride (Cl), manganese (Mn), molybdenum (Mo) and zinc (Zn).14
Nitrogen (N) combines with carbon (C), hydrogen (H) and oxygen (O) to form amino acids, the building blocks of proteins and enzymes. N is required for the production of plant dry matter, and proteins in grain crops. Insufficient N leads to plant stunting and, because N-deficient crops reach maturity prematurely, reduced yield. The older leaves of plants deficient in N will turn pale green to yellow, as N is translocated to younger tissue. N is taken up by plants in the form of nitrate (NO3–) and ammonium ions (NH34+).15
Phosphorus (P) is a component of
Deoxyribonucleic acid (DNA) and plays a major role in energy storage and cell membrane maintenance. Large amounts of P are required where plant growth takes place, such as in shoot and root tips, and it is important for flower development and seed and fruit production. Insufficient P can leave the plant susceptible to plant disease. As with N, P is translocated within plants to younger tissue. A dark green to blue green coloration of older leaves is a sign of P deficiency. In cases of severe P deficiency leaves and stems will appear purple. P deficiency also hinders root development and tillering (the formation of a plant shoot that springs from the root or bottom of the original stalk), plant growth, flowering and fruiting and delays the process of crop maturation. P is taken up from the soil
The political economy of Africa’s burgeoning chemical fertiliser rush 11
solution in the form of H2PO4 – and HPO42– ions.16
Potassium (K) is contained in the cell sap and catalyses the activity of many enzymes involved in plant metabolism. It also affects protein synthesis as it regulates energy transfer within the plant, and the translocaton of sugars for plant growth or storage in grains and tubers. K is required for atmospheric N2– fixation in legumes and is important for crop quality and disease resistance. Plants deficient in K show chlorosis (leaf margin scorch), are stunted and are more often prone to lodging (the bending of the stalk of a plant, called stalk lodging, or the entire plant, known as root lodging), and more susceptible to drought. K is taken up by plants as the ion K+.17
Plants access nutrients in the soil through a process called cation exchange. In order for this to occur the soil must be sufficiently moist, have a pH level and temperature within a certain range and the nutrients must be within the root zone of the plant. The optimum temperature, pH and soil moisture varies by plant species. Shortages of water and micronutrients can limit the efficient use of N and P.18
Humus is the organic matter found in soil which develops as a result of the
decomposition of plant and animal substances. The disintegration process allows components to be changed into forms usable by plants. Generally, the higher the humus content of the soil, the higher the response rate of mineral fertilisers, as organic matter in the soil acts as a key temporary storage for nutrients from fertilisers. Conversely, soils with a low humus content will respond poorly.19
Fertilisers, soil
fertility and
agriculture
The link between soil fertility and agricultural production has been recognised since the beginning of recorded history. In Europe archaeological evidence has emerged of
farmers using manure and water management techniques up to 8,000 years ago,20 and controlled flooding in the Nile and Tigris valleys made Egypt and Mesopotamia the bread-baskets of the ancient world. In approximately 500 BC the Greek historian Herodotus wrote about the very high crop yields obtained in the Tigris Valley and some 200 years later Theophrastus described efforts at holding flood waters on the land for as long as possible to maximise silt deposition.21
In ancient Egypt meticulous records of flooding and irrigation systems along the Nile Valley were kept for the purposes of calculating grain yields and potential tax revenues.22 In The Odyssey Homer refers to the application of animal manure to vineyards,23 while the Roman agricultural writer, Columella, pointed out the benefit of ploughing-in manure immediately, on the same day of its application, so as to maximise its effectiveness in the soil, and even compared the fertiliser value of different legume species.24
In 1669 the German alchemist Henning Brandt made the chemical discovery of phosphorus while attempting to find the philosopher’s stone by distilling 50 buckets of urine, through heating and evaporation. The stone remained elusive but in the process Brandt had discovered the pure form of phosphorus. However, it took a further two centuries before the importance of phosphorus in agriculture was recorded in Europe. In 1840 the German chemist, Leibig, proclaimed phosphorus to be the limiting nutrient in agriculture.25
The emergence of a coal-based economy in Europe and North America from the middle of the 18th century provided new sources of fossil nitrogen, a by-product of the coal tar industry, to supplement traditional sources. 26 The first phosphate fertilisers came from the slag extracted from iron and steel production.27 From 1840–1870 these industrial by-products were supplemented by an estimated 12 million tons of Peruvian guano. Reaching almost 150 metres high on Peru’s Chincha islands, these vast deposits gave Peru a de facto monopoly on the world guano trade,28 the resultant boom trebled government revenues in 30 years and made Peru for a time the largest borrower in Latin America.29
12 A F R I C A N C E N T R E F O R B I O S A F E T Y Mining and the military were also big users of Nr compounds, such as dynamite, nitro-glycerine and trinitrotoluene (TNT), which liberate their stored energy on detonation as they convert back to unreactive N2 gas.30 The development of the South African fertiliser industry was an offshoot of the mining boom of the late 19th century, which required large quantities of explosives and other chemicals.31 Around the turn of the 20th century calls were being made by the scientific establishment in Western Europe to develop new chemical processes which could convert N2 to Nr. Among the first techniques developed was the arc process, where N2 was oxidised to NOx, producing nitric acid (NHO3). The same process happens in the internal combustion engine of a motor car. However, the process was extremely energy intensive and therefore cost effective only with a cheap source of electricity. Norsk-Hydro, later to become fertiliser giant Yara, was one of the first companies to manufacture fertilisers in this way.
In 1908 Fritz Haber discovered a process, later up-scaled by the engineer Carl Bosch, to combine N2 and hydrogen (H2) directly, first from coal gasification and later from natural gas. The Haber-Bosch process dramatically reduced the energy costs of producing nitrogen fertilisers, and has been called the ‘greatest single experiment in global geo-engineering ever made.’ By the 1930s, nitrogen produced using this process exceeded fossil nitrogen sources being used world-wide.32
At the end of the Second World War many countries, particularly the United States, were in possession of huge stockpiles of various chemicals used in their respective munitions industries. In the United States the huge output of explosives from the munitions plant at Muscle Shoals, Alabama was converted to producing nitrogen-based fertilisers, primarily for use in maize production.33 Global fertiliser consumption increased more than tenfold in the ensuing decades, from 14 million tons annually in 1950 to 144 million tons in 1988. Though overall consumption fell in the early 1990s (due to an 80% drop in consumption in the former USSR) it had reached over 180 million tons annually by 2012.34
Fertiliser types
Nitrogen (N)
Synthetic N fertilisers come in two principle forms, liquid ammonium and solid urea. Ammonia is derived from natural gas and air in the Haber-Bosch process, while urea comes from ammonia and carbon dioxide using the Bosch-Meiser process. Urea is measured by its nitrogen content, with 1 ton of nitrogen found in every 2.14 tons of urea.35 Urea is the most commonly applied N fertiliser, although compound NPK blends are also common. Other N fertilisers include anhydrous ammonia, calcium ammonium nitrate, ammonium nitrate and ammonium sulfate. N-based fertilisers are the most energy intensive of all fertiliser components and their manufacture accounts for 3–5% of global natural gas use and 2% of global energy demand.36
Natural gas is the most important ingredient in the manufacture of N-based fertilisers, hence the price of fertilisers is heavily influenced by the price of natural gas (and also crude oil). For example, from 2000 to 2008 the price of natural gas increased by 105%. Over the same period ammonia prices increased 211%, while urea increased by 409%.37
Phosphorus (P)
Unlike other essential macronutrients required by living organisms, such as carbon, nitrogen or hydrogen, the natural phosphorus cycle has no atmospheric phase,
The political economy of Africa’s burgeoning chemical fertiliser rush 13
meaning phosphorus sources are far more geographically restricted. Phosphorus has no substitute in food production and its main source, phosphate rock, is a non-renewable resource that takes approximately 10-15 million years to form. Phosphorus has numerous uses, from the manufacture of munitions to chemical detergents, but around 90% of global use is accounted for by agriculture. Tradable fertilisers based on phosphorus are diammonium phosphate (DAP), monoammonium phosphate (MAP) and triple-super phosphate (TSP).38 Potassium
Potassium makes up 2.5% of the Earth’s crust, making it the seventh most common element. However, due to its high reactivity and affinity for other elements it is not available to plants in its elemental form.39 All fertiliser potassium (commonly known as Potash) is manufactured from large deposits of water-soluble K minerals that have accumulated as a result of the evaporation of shallow seas or natural lakes
over geological time. The most commonly available K fertilisers are potassium chloride (KCl) containing 60% K2O and potassium sulfate (K2SO4), which contains 50% K2O.40 Multi-nutrient fertilisers
There are three main types of multi-nutrient fertiliser. Complex multi-nutrient fertilisers are designed for horticulture where high-grade (and costly) fertilisers are required. These are considered too costly for Sub-Saharan Africa. Compound fertilisers are manufactured by mixing compatible straight fertilisers to produce a slurry from which a granulated product is prepared. These are less costly than complex fertilisers. Finally, bulk blend fertilisers are prepared by physically mixing different fertilisers to arrive at a specific nutrient composition. These are the cheapest of the three types of fertiliser. Compound and bulk blends are often produced for specific crops such as 8-14-7 (maize) or 5-18-10 (cotton) but there are also more generic mixes that can be used with a wide variety of crops.
Figure 1: Fertiliser raw ingredients and products
Source: Yara, 2014.
1 5
I n d u s t r i a l p r o d u c t i o n o f f e r t i l i z e r s i n v o l v e s s e v e r a l c h e m i c a l p r o c e s s e s T h e f e r t i l i z e r i n d u s t r y
14 A F R I C A N C E N T R E F O R B I O S A F E T Y
The global fertiliser
industry
Extreme levels of concentration and huge economies of scale characterise the global fertiliser industry. In 2012 global sales of NPK blended fertilisers alone were over US$200 billion,41 while the global phosphorus fertiliser market was worth an estimated US$96 billion. In comparison, the global crop protection market (insecticides, fungicides and herbicides) in 2013 was US$75 billion.42 The two biggest fertiliser companies by revenue (according to a Yara report) are Agrium and Yara, who made approximately US$16.5 billion and US$15 billion respectively during 2012.43
Production is highly concentrated between both countries and corporations, reflecting the economies of scale needed and access to a steady supply of raw materials. 44 The top five countries control more than 50% of production capacity for the main nitrogen, phosphate and potash fertilisers. Production within countries is also highly concentrated. With China being the exception, within the largest producer countries of ammonia, urea, DAP/MAP, potash
and NPK the top four firms control over 50% of production capacity.45
These market characteristics lend themselves to cartel-like behaviour which has a long history in the global fertiliser industry, dating back to the 1880s. According to a report from the American Antitrust Institute, the fertiliser industry accounted for 12% of all identified international cartels between 1902 and 2010. Twenty such cartels were in operation from 1990 to 2010.
Global markets in potash and phosphorus are still dominated by cartels, and may be best viewed as duopolies. For potash, 70% of global trade is controlled by two such cartels: the first is Canadian sanctioned export cartel Canpotex, comprising PotashCorp, Mosaic and Agrium, while the second comprises three producers from the former Soviet Union, Belaruskali, Silvinit and Uralkali. Their shares in the global potash market are 61% and 32% respectively. The phosphorus duopoly is comprised of US export cartel Phoschem (PotashCorp and Mosaic), which accounts for 52% of world phosphorus trade, and the Moroccan monoploly OCP, which controls 36% of the global raw phosphate market and 51% of global phosphoric acid sales.46
Figure 2: Top 10 global fertiliser companies by net income, 2009–2012
Company Net income
2009 (US$ millions) Net income 2012 (US$ millions) % Change 2009–2012 Potashcorp (Canada) 988 2,079 110 Mosiac (USA) 414 1,839 344 Yara (Norway) 613 1,823 197 CF Industries (USA) 449 1,817 305 Uralkali (Russia) 451 1,574 249 ICL (Israel) 724 1,461 102 Agrium (Canada) 366 1,329 263 K+S (Germany) 403 885 120 SQM (Chile) 372 666 79 APC (Jordan) 281 353 26 Total 5,061 13,826 173
The political economy of Africa’s burgeoning chemical fertiliser rush 15
An investigation by the American Antitrust Institute found that the average profits on potash sales for Canpotex members were 196% from 2008–2009, peaking at a staggering 480% in mid-2008. The institute has concluded that overall damages arising from the
fertiliser duopolies are “likely to amount to tens of billions of dollars annually” and stated “corporate and political control of essential plant nutrients may be one of the most severe competition issues facing national economies today.”47
According to the UN FAO the total demand for fertiliser nutrients is expected to grow by 1.9% per annum from 2012 until 2016, to reach a total demand of 194.1 million tons. However, the annual global demand for phosphate and potash are expected to grow by 2% and 3.7% respectively, compared with a 1.3% annual increase in Nitrogen demand.48
To meet this demand, the International Fertiliser Association (IFA) expects the development of 58 new urea plants between 2010 and 2015. Rising natural gas prices in the Middle East (which currently accounts for 32% of global urea exports) have spurred interest
in exploiting natural gas sources in Africa (see below). Presently, 50% of global urea capacity is not utilised (the figure rises to 70% for South Africa).49
The phosphate and potash sectors, where resources are more geographically (and nationally) concentrated, has seen a flurry of investments, mergers and acquisitions in recent years, as multinational corporations and Figure 3: Top global fertiliser producers by country
Fertiliser Top 5 producer countries
(% global share) Top 5 countries capacity (000 MT) Top 5 countries share of global production (%)
Ammonia China (22.8), India (8.9), Russia (8.5),
USA (6.5), Indonesia (3.9) 84,183 50.6
Urea China (33.1), India (13.1), Indonesia
(5.4), Russia (4.2), USA (4.1) 95,802 59.9
AN USA (15.4), Russia (14.7), China (7.7),
Uzbekistan (4.8), Romania (4.5) 27,770 47.1
DAP/MAP China (22.3), USA (21.2), India (11.4),
Russia (6.0 22,896 65.9
Phosphoric
acid United States (20.9), China (19.3), Morocco (9.6), Russia (6.2), and India (5.3)
28,274 61.3
Potash Canada (37.6), Russia (13.2), Belarus
(9.9), Germany (8.2), and China (7.7) 39,687 76.7 NPK China (29.3), India (8.2), Russia (6.0),
France (4.0), and Turkey (3.0) 47,186 50.4
Source: IFPRI, 2011.
16 A F R I C A N C E N T R E F O R B I O S A F E T Y
national governments seek both to consolidate existing reserves and open up new ones. Given that mining forms a major component of both industries, it is unsurprising that some of the world’s largest mining companies, including BHP Billiton and Rio Tinto, have entered the fray.
BHP, the largest mining company in the world, signalled its intentions in August 2010 with a massive US$40 billion hostile takeover bid for Canada’s Potash Corporation, at the time the world’s most profitable fertiliser company. However, the Canadian government considered Potash Corp and the potash reserves it held as a matter of national interest, and rejected the bid. In a further twist, in September 2010, seven different law firms associated with the deal, and Canada’s Finance Ministry and Treasury Board were subject to a series of cyber-attacks linked to a Chinese effort to block the takeover. At the time a report in the Financial Times claimed that China’s formerly state-owned chemical company, Sinochem Group, with backing from the Chinese government, had hired Deustche Bank and Citigroup to disrupt BHP’s bid for Potash Corp.50
In the interim, BHP has committed to investing up to US$12 billion at its Jansen site in
Saskatchewan, potentially the largest potash mine in the world.51 More recently speculation has been rife that BHP intends to use its Jansen assets as leverage in another attempt on Potash Corp, with industry analysts predicting an imminent US$1 billion offer for a 3% stake in the Canadian fertiliser giant. Far from being cowed by overtures from BHP Billiton, Potash Corp has itself been eyeing potential purchases, including an attempted US$13 billion takeover of Israel based ICL. However, opposition from the Israeli government and trade union groups have put paid to the deal.52
Meanwhile, in September 2013, China’s sovereign wealth fund spent US$2 billion to acquire a 12.5% stake in Russian potash producer Uralkali. China currently imports 6 million tons of potash a year, more than 10% of global demand. The investment is seen as a means to ensure a continued supply of potash and of strengthening China’s bargaining position with other producers.53
Brazilian mining giant Vale, the world’s largest iron-ore producer, bought Rio Tinto’s potash Figure 4: Anticipated increases in African fertiliser supply and demand, 2012–2016
The political economy of Africa’s burgeoning chemical fertiliser rush 17
reserves in Canada and Brazil in 2009, and followed up in early 2010 by purchasing grain trader Bunge’s Brazilian fertiliser assets. The deal included phosphate rock mines and Bunge’s 43% stake in Fosfertile, the largest supplier of phosphate and nitrogen-based fertilisers in Brazil. According to Alberto Weisser, CEO of Bunge, Brazilian President Luiz Inacio Lula da Silva had put “tremendous pressure” on Vale to expand its fertiliser presence in Brazil.54
Rio Tinto re-entered the Canadian potash scene in 2011 in a joint venture with Russian producer JSC Acron (which emerged from privatisation of the Soviet fertiliser industry). Both companies have recently announced they are sitting on massive deposits in Saskatchewan, and expect to start developing the site by 2017.55
Even Bill Gates has interests in fertiliser beyond his support for the Alliance for a Green Revolution in Africa (AGRA). Through his private investment vehicle, Cascade Investments, Gates is now the largest single shareholder (12%) in the Canadian National Railway (CNR),56 one of the two major haulers of potash from the mines of Saskatchewan to the west coast ports of Canada.57 Approximately 17% of CNR’s freight is grain and fertilisers. In 2012 CNR signed a ten year contract with Canpotex Ltd
for transporting potash to North Vancouver. In January 2013 Cascade investments, together with two other US groups, was part of a US$1 billion investment in Egyptian construction and fertiliser company OCI NV, a wholly owned subsidiary of Orascom Construction Industries SAE, the largest publicly traded company in Egypt at the time.58
Fertiliser in
Sub-Saharan Africa
In global terms, Sub-Saharan Africa’s fertiliser consumption is marginal. In 2011 it accounted for 1.6% of global nitrogen consumption, 1.6% of phosphate and 1.3% of potash. According to the UN FAO, between 2012 and 2016 the consumption of nitrogen, phosphate and potash for fertilisers is expected to increase at an annual rate of 2.9%, 3.7% and 4.2% respectively. The major fertiliser consumers in Sub-Saharan Africa are South Africa, Nigeria, Kenya, Ethiopia and Malawi.59
The production of fertiliser in Sub-Saharan Africa (excluding South Africa) is concentrated among four countries: Zimbabwe, Senegal, Figure 5: Fertiliser production capacity in Sub-Saharan Africa (excluding South Africa) 2008– 2009
Fertiliser Top 5 producer countries (%
Sub-Saharan Africa share) Largest producers capacity (000 MT) Largest producers share of Sub-Saharan Africa (%) Largest producers global share (%)
Ammonia Nigeria (82), Zimbabwe (18) 443 100 0.3
Urea Nigeria (100) 500 100 0.3
AN Zimbabwe (100) 250 100 0.4
DAP/MAP Senegal (100) 120 100 0.3
Phosphoric
acid Senegal (90.8), Zimbabwe (5.5.), Tanzania (3.7) 727 100 1.6 NPK Cote d’Ivoire (41.2), Senegal
(27.8), Zimbabwe (25.8), Malawi (5.2)
970 100 1
18 A F R I C A N C E N T R E F O R B I O S A F E T Y Nigeria and Mauritius. Production within these countries is carried out by handful of corporations; no more than four firms operate in any of the producing countries of Sub-Saharan Africa. In most cases there is only one firm operating. For example, Notore Chemical industries control all the ammonia and urea production in Nigeria; Sable Chemical industries account for all Zimbabwe’s ammonia production; Industries Chimiques produce all the phosphoric acid and NPK output for Senegal; and Yara International controls the market for NPK production in Cote d’Ivoire.60 North Africa has substantial phosphate rock and natural gas resources. While Egypt, Morocco and Tunisia account for 88% of Africa’s fertiliser production, the majority of this is exported. South Africa produces 90% of its phosphate fertiliser requirements.61 There is currently no commercial production of potassium anywhere in Africa. In addition to current manufacture, fertiliser imports by Sub-Saharan Africa account for close to 100% of consumption for the three major fertiliser groups (nitrogen, phosphate and potash).62
Phosphate and plunder in ‘Africa’s last colony’63
Western Sahara has been under illegal occupation by Morocco since the latter’s invasion in 1975. Morocco’s claim to sovereignty over Western Sahara is not recognised by any state, the United Nations or the International Court of Justice. The Bou Craa phosphate deposits and mining
activities in the area provide Morocco with the largest phosphate reserves in the world and makes it the world’s third largest producer. From 2009–2013 production and export from Western Sahara averaged 2.3–2.5 million tons annually, approximately 10% of OCP’s total sales. The conveyor belt that transports the phosphate rock from the mines at Bou Craa to the coast is the longest in the world. OCP has developed an investment plan worth US$2.45 billion for the period 2012–2013 to expand and upgrade production.
A report from Western Sahara Resource Watch (WSRW) estimated that during 2012 and 2013 4 million tons of phosphate rock was exported from Western Sahara, giving US$510 million in revenue to OCP. Potash Corp was the largest individual buyer over this period, sourcing over 1 million tons at a cost of US$162 million. Lithuanian fertiliser company Lifosa, a subsidiary of Russia’s Eurochem, purchased 575,000 tons to the value of US$92 million over the same period. Agrium, who signed a 1 million ton per year contract with OCP in 2011, imported 170,000 tons (worth US$26 million) in 2013.64
Fertiliser supply chains in Africa
In Africa, where little fertiliser is domestically produced, the fertiliser supply chain begins with importers (who will interact with shipping agents, bankers, quality inspectors and various other players) and ends with farmers. Farmers in landlocked African countries typically pay an extra US$50–US$100 per metric ton (MT) in transportation and other costs.65 Due to limited capacity at many African ports, most fertiliser imports arrive in 10,000 ton vessels, limiting the size of bulk orders and adding a 10–15% cost premium.66 Wanzala, Bumb and Groot (Fertiliser market development in Sub-Saharan Africa, 2013) have identified five basic fertiliser supply chain models found in Africa:
1. A liberalised market where importers procure fertiliser from overseas and sell mainly to wholesalers/distributors. Some is also sold directly to agro-dealers, an example being Uganda, where the wholesale level has
The political economy of Africa’s burgeoning chemical fertiliser rush 19
not developed. Agro-dealers then either sell directly to small-scale farmers or to stockists, who sell to farmers.
2. A ‘mature’ market, where fertiliser is domestically produced and distributed through a well-developed commercial value chain. In Sub-Saharan Africa only South Africa falls into this category.
3. Typical contract farming arrangements found in export cash crop sectors, such as tea and sugar in Kenya, tobacco in Malawi or cotton in West Africa. Here, companies either import fertilisers themselves or through local agents. The fertiliser is supplied on credit and deducted from farmer payments (along with other inputs) at harvest time. 4. Found where NGOs procure fertilisers from
overseas as part of their projects, and then distribute directly to farmers they work with (for free, at a discount, or on credit). Alternatively, NGOs assist farmer groups to procure fertilisers and then sell on to their members (at a discount) or to non-members at the going rate.
5. In countries with national fertiliser
programmes, government owned enterprises procure either directly from overseas or via
local importers using a tender process. In the majority of cases fertilisers are distributed via government parastatals or ministries of agriculture.67
Current fertiliser
players in Africa
A number of fertiliser companies are currently active in Sub-Saharan Africa. At present Yara has the largest presence of the major multinational companies and, owing to its intimate involvement in the Green Revolution push, will be profiled in more detail below. US fertiliser giant Mosaic’s only significant intervention in Africa so far appears to be through its involvement with the Millennium Village Project, to which it claims to donate US$2 million worth of fertiliser each year.68 Several large firms from the former Soviet Union and the Middle East have been assisting the Ethiopian government with its fertiliser subsidy programme.69 Commodity trader Louis Dreyfus is one of the largest distributors of fertilisers and agro-chemicals in West Africa and in 2013 established new fertiliser Figure 6: Fertiliser imports in Africa, 1995–2011
20 A F R I C A N C E N T R E F O R B I O S A F E T Y operations in Nigeria, Kenya, Tanzania and Zambia.70
Some of the larger operators currently on the continent are African companies. Whether these companies will compete directly with, enter into partnership with, or simply be swallowed whole by the global companies remains to be seen.
Notore Chemical Industries
Notore Chemical Industries took over the assets of the National Fertiliser Company of Nigeria (NOFCON) in 2005. In 2006 Notore signed a 20-year supply contract with the Nigerian gas company and commenced ammonia production in 2009. In recent years Notore has further expanded its scope, having signed a technical advisory service agreement with Tata chemicals of India in 2011, and a joint venture agreement with Mitsubishi Corporation of Japan in 2012, to build a new plant.71 The African private equity firm, Emerging Capital Partners, currently has an 11% stake in Notore.72
OCP Group SA
OCP Group SA is based in Morocco. It controls the world’s largest reserves of phosphate, is the world’s largest exporter of phosphate, and accounts for roughly 21% of the global phosphorus-based fertiliser market. In 2013 its turnover was approximately 46 billion Moroccan dirhams (US$5.5 billion). OCP has big plans for Africa—between 2007 and 2012 its
fertiliser exports to the continent had already increased tenfold, from 50,000–506,000 tons.73 In April 2014 OCP raised US$1.55 billion in its debut international bond sale in support of a planned US$17 billion investment plan to increase its global market share for phosphorus fertilisers to 40% by 2020. In March 2014 OCP signed an agreement to build four plants in Morocco and Gabon at a cost of US$2 billion, intended to supply 30% of the African fertiliser market.74
Omnia
Omnia fertiliser is part of the Omnia group of companies, a South African group with interests in mining, explosives, chemicals and fertilisers. It has offices serving southern Africa in South Africa, Zambia, Zimbabwe, Angola and Mozambique. It also operates (through its head office in South Africa) in the Democratic Republic of Congo, Botswana, Namibia, Ethiopia and Kenya.75
In South Africa Omnia has recently benefited from state support via the Industrial
Development Corporation (IDC), a parastatal agency. In 20111 the IDC committed R250 million towards the construction of a new R1.4 billion nitric acid plant at Omnia’s Sasolburg site.76 As of 31st March 2014, 14% of Omnia is held by South Africa’s government employees pension fund through the Public Investment Corporation (PIC).77
In Zambia Omnia was one of two key suppliers to the government’s fertiliser subsidy programme.78 However, in June 2013 the Zambian Competition and Consumer Protection Commission (CCPC) recommended the blacklisting of both companies regarding the supply of fertiliser to the Farm Input Subsidy Programme (FISP). This followed an extensive CCPC investigation which revealed that cartelistic behaviour and bid rigging by Omnia and Nyiombo had cost the government over US$20 million.79
Export Trading Group (ETG)
Founded in Kenya in 1967, the Export Trading Group (ETG) now has a presence in 30 countries in Sub-Saharan Africa and sells its Falcon fertiliser brand in 20 African countries. The group has built a fertiliser granulation plant in
The political economy of Africa’s burgeoning chemical fertiliser rush 21
Beira, Mozambique, and has plans to acquire a blending plant in Tanzania in 2014. ETG also operates a bulk blending plant in Zambia, primarily to service commercial farmers. 80 In late 2012 international asset management firm the Carlyle Group, South African private equity fund Pembani Remgro and Standard Chartered announced plans to make a strategic minority investmen’ of US$210 million in ETG.
Future fertiliser
trends in
Sub-Saharan Africa
Two major pathways are likely to determine fertiliser demand and production in Sub-Saharan Africa in the near future. These include efforts to increase consumption among Sub-Saharan Africa’s hundreds of millions of small-scale farmers through the new Green Revolution push, and a parallel scramble for the continent’s resources that, so far, is most closely associated with extractive industries, both fossil fuels and other minerals. At their core both developments are the inevitable consequence of capital’s never-ending quest for new market opportunities. However, politics and ideology are inherent in both, even if they differ between the more brazen resource nationalism of the extractives sector and the philanthropic overtures of the Green Revolution.
Africa’s coming
extractives boom
The African continent is said to be teetering on the edge of a natural gas boom and Angola, Gabon, Mozambique, Nigeria and Tanzania in particular are the focus of developments in this sector.81 Equatorial Guinea, Ethiopia, Cote d’Ivoire, Ghana, Namibia, the Democratic Republic of Congo (DRC) and Madagascar are also said to have considerable reserves of natural gas. Recent discoveries off the coastof East Africa have led to predictions that the region could eventually become the world’s third largest exporter of natural gas. Should liquefied natural gas (LNG) exports take off, the International Monetary Fund (IMF) expects between US$20 billion and US$30 billion in foreign direct investment in Tanzania alone.82 To put this in perspective, the World Bank calculated Tanzania’s GDP to be US$28.2 billion in 2012.83
However, the construction of a modern ammonia/urea plant requires an investment of up to US$1 billion and must produce between 1,500 and 3,500 tonnes per day to be economically viable. With over 50% of countries in Sub-Saharan Africa currently consuming less than 50,000 tonnes in a year, many of the anticipated fertiliser plants could quickly turn their attention to lucrative export markets. In Nigeria, currently the only producer of urea on the continent, several local and Indian firms have advanced plans which could see production increase by tenfold, from its current level of 500,000 tons. This includes plans by Dangote to construct Africa’s largest fertiliser plant at a cost of US$2 billion. The plant, scheduled to start production in 2014, will have a production capacity of up to 7,700 tons per day of ammonia-urea fertiliser. Eleme Petrochemicals, backed by the Indorama Corporation of Indonesia, has also announced plans for a 2,500 ton per day plant to be constructed at Port Harcourt.84
The government of Gabon, together with Indian (Tata) and Singaporean (Olam) investors, is in the advanced stage of a feasibility
22 A F R I C A N C E N T R E F O R B I O S A F E T Y assessment for a urea plant with an annual capacity of 1.3 million tons. Fatima Group, Pakistan’s third largest agricultural input company, has been scouting various African countries ahead of a planned US$1 billion investment in a world scale fertiliser plant. In addition to catering for local markets, surplus production from the plant has been earmarked for export to Pakistan, where urea production is unsufficent to meet local demand.85
In Lusophone Africa Japanese firms are leading the way, a group of which winning a US$1.3 billion contract in 2011 to build a fertiliser plant in Angola with a capacity of 666,000 tons of ammonia and 580,000 tons of urea per year. Half of the ammonia will be exported while all of the urea will be for domestic consumption. However, lack of local demand may increase the export focus of the project.86 In 2013 Sumitomo Corporation and Toyo Engineering announced plans to invest US$1.2 billion over the next four years to build a 630,000 ton per year fertiliser plant in Mozambique.87
UK listed Wentworth Resources plans to build a US$360 million urea plant in Tanzania, to be supplied by a proposed 400MW gas-fired power plant in Mtwara, in the south of the country. The power plant, which will cost close to US$1 billion, will be built by the US consortium of Symbion Power and General Electric.88 Also in East Africa, Japanese firm Toyota Tsushu has been awarded the tender to construct a US$1.2 billion fertiliser plant in Nakuru, Kenya. The plant is expected to be completed in 2016.89
Indian companies, seeking new fertiliser sources, have also been scouring the African continent. Indian state-owned Rashtriya Chemicals and Fertilisers Ltd (RCF) has signed a memorandum of understanding with the government of Ghana and is seeking long-term natural gas supplies for the production of urea. It is also looking at sourcing phosphate fertilisers from Togo.90
In Ethiopia five fertiliser plants are currently under construction in Yavy, some 330km west of the capital Addis Ababa, at a total cost of over US$2.8 billion. The plants will have an annual production capacity of 330,000 tons and are expected to begin production in 2017. The project is being led by the state-owned Ethiopian Metal and Engineering Corporation. 91 Substantial phosphate reserves have also been identified in Mozambique and Namibia. Brazilian miner Vale estimates Mozambique’s reserves of apatite to be as high as 155 million MT, making it the largest known reserve in Central or East Africa. Some 60km off the coast of Namibia the Australian owned Sandpiper marine phosphate project is sitting on what it suspects to be the world’s largest marine reserve of phosphate rock, at 1.7 billion MT, including an initial reserve of 133 million MT. As no other country in the world conducts marine phosphate mining, in September 2013 the government of Namibia placed an 18-month moratorium on marine phosphate mining, pending the outcome of an environmental impact assessment into potential impacts on the Namibian fishing industry.92
Fertiliser and the
Green Revolution
push in Africa
Just as in Asia, ambitions for an African Green Revolution are premised on dramatic increases in the use of fertiliser, as well as improved seed, access to credit and markets. This is most clearly expressed in the Abuja Declaration on Fertilisers of 2006, a process fashioned in meetings that included the Rockefeller Foundation and the global fertiliser industry. http://www.skyscrapercity.com/showthread.php?p=102424622