L C A M e t h o d o l o g y F a t e M o d e l l i n g W i t h i n L C A
LCA Methodology
Fate Modelling Within LCA
The Case of Textile Chemicals
Almut Beck, Martin Scheringer* and Konrad Hungerbiihler
* Corresponding author: Laboratory of Chemical Engineering, ETH Zentrum, CH-8092 Zi~rich; e-mail: scheringer@tech.chem.ethz.ch
DOI: http://dx.doi,or9/10.1065/Ica2000.09.03~2
Abstract. For an accurate assessment of the toxic effects of chemi- cals during their life cycle, LCA developers try more and more to include chemical fate into the life-cycle impact assessment (LCIA) procedure. In this study the application of multi-media partition- ing models within LC1A is discussed. With the case of textile chemi- cals as an example, USES-LCA and a simple river model (box approach) are compared according to their practicability and the value added to the assessment results. It is shown that emissions from the supply and use of energy still dominate the LCIA results even if ecotoxicity is assessed with a rather complex fate model such as USES-LCA. Second, the treatment of modelling results is addressed for persistent substances with low or unknown toxic- ity. A possible approach to include such chemicals into valuation is to define an exposure-based impact category additionally to the existing effect-oriented ones (toxicity scores) or a combina- tion of differenr methods. A combined presentation of results from complementary tools is proposed, providing a more detailed back- ground for decision making while avoiding aggregation and leav- ing the final weighting between the categories to the user.
Keywords: Energy; exposure; fate modelling; LCIA; Life-Cycle Impact Assessment (LC[A); persistence; risk assessment; river modelling; textile chemicals; toxicity; unknown damage; USES
1 Introduction
1.1 Chemicalsubstances:
A general problem for Life-Cycle Impact Assessment Life-cycle assessment (LCA) aims at addressing the cradle-to- grave environmental impacts linked to a specific product or service. This overall perspective causes the method to consider environmental interventions independent of the place and time of their occurrence, which makes sense at a first glance and which covers the most important, globally relevant effects of emissions related to the supply and use of energy, e.g. global warming. However, less mobile chemicals used in specific ap- plications such as textile finishing often remain in a local scale around the place of the emission and do not show global ef- fects. Life-cycle impact assessment (LCIA) attempts to include local effects of chemicals by introducing the impact class of ecotoxicity (Gun~E et al., 1996). In such approaches, the envi- ronmental partitioning is calculated with multi-media models, e.g. USES-LCA (Uniform System for the Evaluation of Sub- stances, adapted for LCA) within the CML (Centrum voor Mi- lieukunde Leiden) classification method (Hu[JB~C'TS et al., 2000). If a good representation of environmental properties is aimed at, regional models and corresponding characterisation factors are used (PoTrING and HAUSCHn-D, 1997; PoTr~G et al., 1998).
Since a variety of local conditions can be relevant for the chemicals' fate and the resulting exposure levels, an attempt should be made to improve regional models and to choose the best one for each specific problem. To this end, we here compared two different multimedia fate models, USES-LCA (HuIJBREGTS et al., 2000) and a simple river model
(SCHERINGER
et al., 2000a), and their usefulness for LCIA.
In addition to the limited representation of local environ- mental fate and impacts in current LCIA methods, there are two other obstacles to the assessment of chemicals in LCIA: First, a sufficient collection of data is impeded because there are more than 100,000 existing substances and many new substances are continuously introduced (EEA, 1998). In as- sessing the high variety of textile chemicals, data collection is especially difficult because the amount of information grows very fast and, at the same time, data is often confiden- tial. The chemical substances included most comprehensively in life-cycle inventory databases are chemicals related to energy production, as inventories for energy production have been studied intensively (FRIsCHKNECHT et al., 1994). Sec- ond, emissions from energy-related processes are quantita- tively dominant as compared to other chemical emissions. For this reason, even if known chemicals and their known effects are included into the assessment, the predominance of energy-related emissions and impacts still remains.
1.2 A specific problem: 'Non-toxic '~ substances
In present LCIA methods, chemicals are included into the impact categories of human toxicity or ecotoxicity only if they have known adverse effects to human health or the environment. Substances without known effects, in contrast, can also be investigated with the multbmedia models men- tioned above but wilt not be valuated within the standard- ised LCIA methodology (ISO, 1997; 1998). This can be con- sidered appropriate if one just wants to look at impacts of known mechanisms (effect orientation of LCA; BaRNTHOUSE et al., 1997). The precautionary principle, however, requires a different perspective: Chemicals of a high persistence (low degradability) remain in the environment for a long time and can cause future effects that are not known yet, cf. ozone depletion by chlorofluorocarbons (CFCs) which had been considered harmless before 1974 or endocrine effects caused
1 It is clear that practically all substances are toxic at concentrations above a specific threshold value; however, if this value is rather high, a substance is normally considered non-toxic. Here, the term 'non-toxic' refers to chemicals with low toxicity or unknown effects.
by substances which had been considered non-toxic before. For this reason, we characterize the exposure potential of selected textile chemicals independent of their toxicity by calculating the persistence and spatial range of the chemi- cals with a river model.
1.3 Outline
We want to illustrate how the problems sketched above can be treated by investigating the following questions: 9 What is the importance of chemicals vs. that of energy
in the environmental impacts of textile finishing? 9 What are the benefits of applying USES-LCA to the as-
sessment of locally relevant chemicals in LCIA? 9 Can non-toxic but persistent substances be considered
within LCA?
A screening of energy consumption and chemical use throughout the cotton processing chain was performed in a preliminary study (PuLLI, 1997). In the present study, for the wet processing of cotton cloth for a red T-shirt, a detailed LCIA is carried out. The same LCIA is then re-performed considering only the energy-related flows. Finally, an LCA- independent simple model for the fate of chemicals in rivers
is applied to selected textile chemicals as an addition to the LCA results. On this base, a new category for non-toxic chemi- cals could be developed that is not effect but exposure based. In this case it is necessary to compare effect parameters, which represent damages, with fate parameters, which represent en- vironmental threats (So-mRnqGER and BERG, 1994).
2 L C A Results for a Red Cotton T-Shirt 2.1 Functional unit and system boundaries
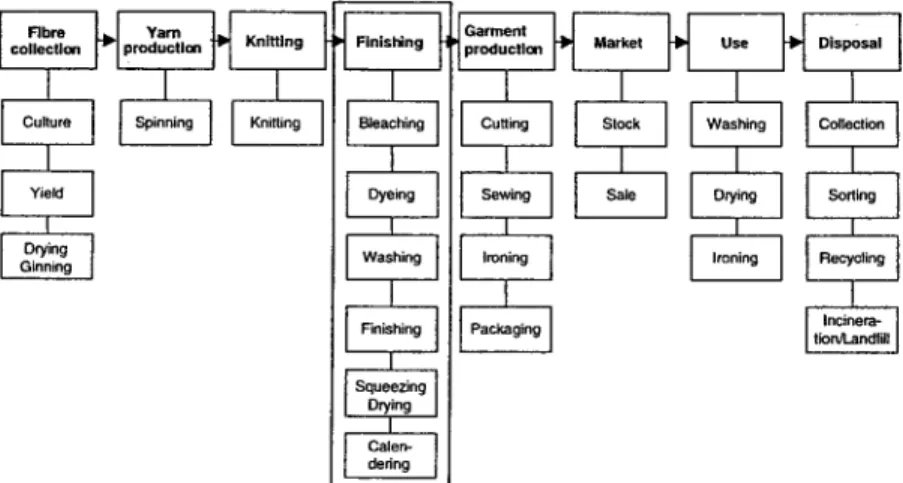
The cotton processing chain can be roughly summarized with the stages of cotton production, cloth production, finishing, garment production, use, and disposal. Fig. 1 depicts the steps 'from cradle to grave' omitting the transport between the phases. The T-shirt that is investigated as the functional unit in our case study weighs 250 g and is washed once a month during the use phase of four years.
In a first screening, the amounts of energy (summarised in MJ) and chemicals (computed as the sum of all masses, in kg) used in the different stages have been calculated (Fig. 2, data from Enqu~te-Kommission (1995) and Pulli (1997)). As is visible from Fig. 2, the use phase is the most important stage in this respect.
,
~
•
Finishing~fe--q ~
~
[Blea!hing
Finishing Garment
Disp
I Blea!hing Cutting
Colle
I Dyeing Sewing
Sor
I
Washing Ironing
Rec~
I
Finishing I SqueezingDrying
I I Calen-derinq
=q
Fig. 1: Life cycle of the red cotton T-shirt. The finishing step with foucs on the wet processes is investigated here.
Fig. 2: Results of the environmental screening of the cotton processing chain (red T-shirt, 250 g weight). Energy consumption in M J, chemical use in kg. All values are relative to the use phase; 100% corresponds to 70 MJ and 0.32 kg, respectively. These estimates indicate only orders of magnitude.
LCA Methodology
Fate Modelling Within LCA
However, the main focus of this study is not set on the use phase, as laundry has been analysed in many ways (e.g. DALL' ACQUA et al., 1999) and as a large part of the related problems are linked to consumer behaviour rather than to production systems (CLIFT and RANSOME, 1999). Cotton culture, which also plays an important role from the environmental point of view, is a production step taking place at very different places in the world and under very variable conditions. Data con- cerning cotton production is therefore of a high uncertainty (RELLER and GERS'I-ENBERG, 1997). Textile finishing has a long tradition in Europe. Swiss chemical and textile industry plays an important role in this field, and data is more accurate here. Additionally, textile finishing contains a lot of different chemi- cal-intensive steps (HUBER and NITSCHKE, 1994). Therefore, textile finishing has been chosen as an example process for the examination of the assessment of chemicals within LCA.
2.2 Energy balance vs. full LCA
Fig. 3 shows a simple energy balance of textile wet process- ing (PuLu, 1997) compared to the LCA of this process using the characterisation procedure of CML (HEIJUNGS et al., 1992;
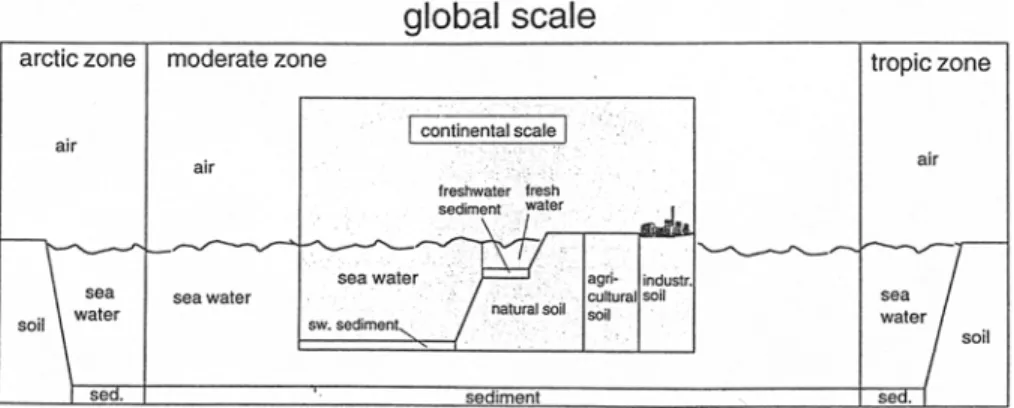
GUINI~E et al., 1996), including fate modelling with USES- LCA (HuIJBREGTS et al., 2000, see Fig. 4 for the model sys- tem) and evaluated with the Danish distance-to-target ap- proach of EDIP (environmental development of industrial products; HAUSCHILD and WENZEL, 1997).
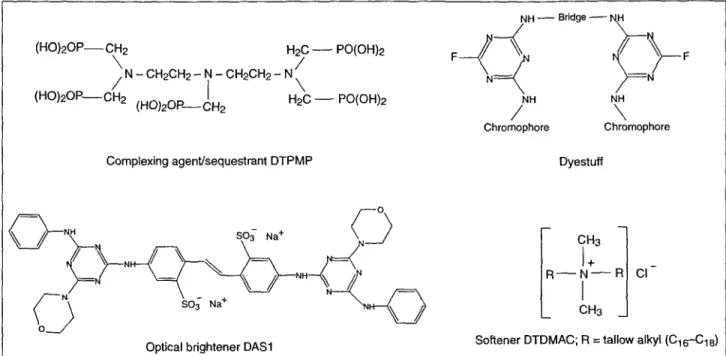
The chemical specific process data was obtained from a tex- tile finisher. Characterisation and evaluation factors are cal- culated for a reactive dyestuff (Cibacron Rot LS-6G), an optical brightener (DAS1), a softener (ditallowdimethyl- ammonium chloride, DTDMAC), and a complexing agent and sequestrant (diethylenetriamine penta(methylenephos- phonic acid), DTPMP), which are the most important chemi- cals involved; see the physico-chemical and toxicological data in Tables 1 and 2 and the chemical structures in Fig. 7. The substances were chosen according to a ranking system for textile chemicals which uses toxicity and degradability in the waste-water treatment plant as the main criteria (BAUMANN et al.,
1995).
For entering the chemicals into the characterisation data base, mostly safety data sheets were evaluated. USES-LCA requires a lot of different input data, especially toxicity test results and other substance proper- ties such as partitioning coefficients and degradation rateFig. 3: LCA and energy balance of the finishing step (red T-shirt, 250 g weight). The LCA results are in points according to Heijungs et al. (1992), Guinee et al. (1996), Huijbregts et al. (2000), Hauschild and Wenzel (1997); energy in MJ.
constants, but also environmental parameters. Most safety data sheets available, even if corresponding to the require- ments, do not provide all the substance-related figures. For dealing with this problem, USES-LCA and risk assessment in general introduce extrapolation factors to be applied to uncertain data. While this procedure makes sense for the risk assessment of single substances from the precautionary principle point of view, it can nevertheless be problematic, as a comparison of substances with very different data situ- ations does not work any more: Results can be changed a lot if the substances with little information are given a higher toxicity by high extrapolation factors.
The properties of the different chemicals are listed in Tables 1 and 2. Daily consumptions in a textile finishing facility
are in the range of 600-900 kg (dyestuffs), 6-24 kg (phos- phonates as complexing agents and sequestrants), up to 200 kg (softeners), and up to 40 kg (optical brighteners) (HuBER and NITSCHKE, 1994). Different fractions of these chemicals in the range of less than 1% (optical brighteners) up to 20% (dyestuffs) pass through waste water treatment plants and enter the environment.
As can be seen in Fig. 3, the energy balance and the LCA yield rather the same results, i.e. energy-intensive processes have a dominant influence on the LCIA results. - This con- clusion is confirmed by a more detailed analysis: Fig. 5 shows the detailed LCIA of the finishing steps, performed once with the complete inventory and once with a reduced inventory containing only the energy-related flows.
Table 1: Physico-chemical data and degradation rate constants of the textile chemicals. K : octanol-water partitioning coefficient, fracP: fraction adsorbed on suspended particles, calculated from the sediment-water partitioning coefficient with a particle concentration of 2.10 -~ kg/l. Data from Boethling and Lynch (1992), Gledhill and Feijtel (1992), Baughman (1995), BUA (1997), Stoll et al. (1998), Scheringer et al. (2000a). n.a.: not available.
mol. weight CAS-No. log K~, vapour pressure (298 K) solubility (298 K) sediment-water partitioning coefficient fracP
degradation rate constants
photolysis
Pa mg/I I/kg
biodegradation in surface water s-' abiotic degradation in sediment s-' anaerobic biodegradation in s-' sediment
Cibacron Rot LS-6G DTDMAC DAS1 DTPMP
(dyestuff) (softener) (optical brightener) (complexing agent;
sequestrant)
1473 529.5-585.5 925 573
n.a. (confidential) 68783-78-8 16090-02-1 15827-60-8
2.69 -1.1 - 3 . 4
1.00.10 -~ n.a. (very low) n.a. (very low) 1.0.10 -9
1.00-10 s < 10 1800 miscible 1.0.102 5.0~10' 1.0-10' 1.0.103 2.0.10 -4 0.1 2.0-10 -2 2.0.10 -3 0 0 2.20.10 -7 1.02.10 -7 0 1.60.10 -6 0 0 n.a. n.a. 4.40-10 -~~ 0 1.5.10-" 2.67.10 -7 0 1.78-10 -7
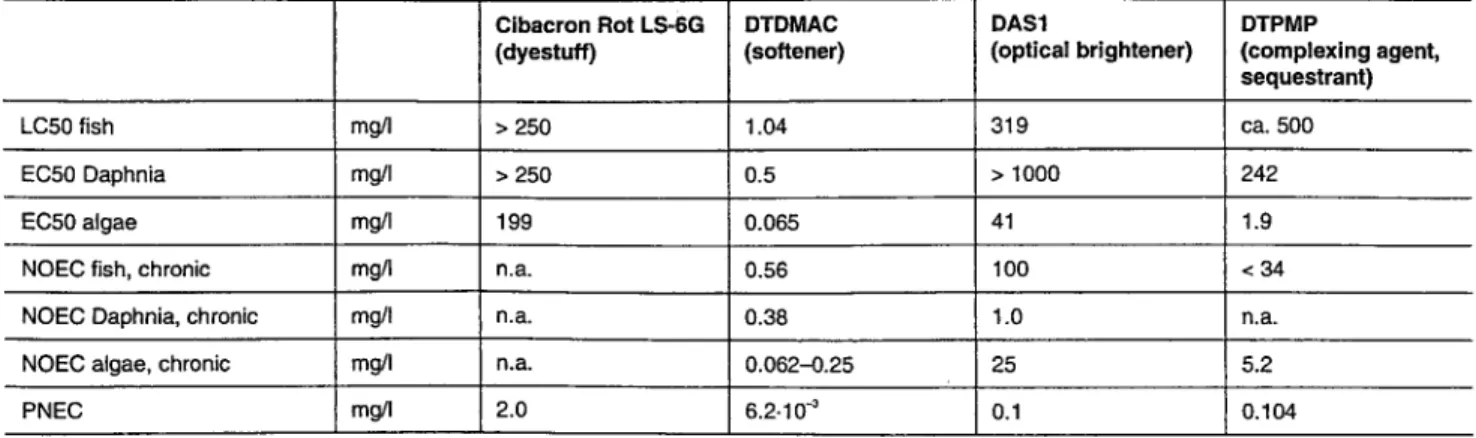
Table 2: Toxicity data of the textile chemicals. Data from Gledhill and Feijtel (1992), Ciba (1995), Kramer (1992), Boethling and Lynch (1992). n.a.: not available. The duration of the toxicity tests was onl,' available in some cases (mostly 72 h or 96 h). PNEC values calculated according to EC (1996).
Cibacron Rot LS-6G DTDMAC DAS1 DTPMP
(dyestuff) (softener) (optical brightener) (complexing agent,
sequestrant)
LC50 fish mg/I > 250 1.04 319 ca. 500
EC50 Daphnia mg/I > 250 0.5 > 1000 242
EC50 algae mg/I 199 0.065 41 1.9
NOEC fish, chronic mg/I n.a. 0.56 100 < 34
NOEC Daphnia, chronic mg/I n.a. 0.38 1.0 n.a.
NOEC algae, chronic mg/I
PNEC mg/I
n.a. 0.062-0.25 25 5.2
2.0 6.2-10 -3 0.1 0.104
LCA Methodology
Fate Modelling Within LCA
Fig. 5: Detailed LCA results obtained for the different operations of the finishing step (complete inventory and reduced inventory containing only energy- related flows). Values in points according to Heijungs et al. (1992), Guinee et al. (1996), Huijbregts et al. (2000), Hauschild and Wenzet (1997). STP: Sewage Treatment Plant.
As is easily visible, in all processing steps except sewage treat- ment (STP), all impact categories are dominated by energy production. This finding also applies to the scores for human toxicity and ecotoxicity, which are mainly due to toxic emis- sions from energy production. STP, in contrast, shows signifi- cant contributions to human toxicity, aquatic ecotoxicity and nutrification that are caused by the emissions from textile wet processing; other impact categories play a minor role in this processing step. Note that in all processing steps the relatively low contribution of ecotoxicity is due to the normalisation step, where the factor for human toxicity (8.16.10 -3 ) is three orders of magnitude higher than the one for ecotoxicity (5.22.10-6). These normalisation factors are the inverse values of the world-wide contributions to the respective impact cat- egories according to Heijungs et al. (1992).
This analysis shows (i) that, in the aggregating perspective of the LCIA methodology, the contribution of the textile chemicals to ecotoxicity is of minor importance compared to the high scores from the energy-related processes and (ii) that, to some extent, all impact categories are correlated through the contributions from the energy-related processes. Therefore, it should be investigated in life-cycle studies whether it is worthwhile to perform a complete LCA for drawing conclusions that could also be drawn from an en- ergy balance. In our case, process-caused emissions from the different life-cycle stages of the T-shirr are less impor- tant than those from energy-related 'background' processes and even optimal modelling and inventorising does not change this relationship.
However, on the local scale where textiles are processed, those specific emissions can cause relevant environmental impacts. Therefore, the emissions and impacts from a spe- cific system such as textile finishing should be investigated
separately from the emissions and impacts from energy-re- lated background processes. This means that energy-related contributions and contributions from the particular system under focus, here the textile ,vet processing, to the impact scores can be identified directly, which would clearly im- prove the transparency of LCIA results.
3 Fate Modelling Independent of LCA 3.1 Unknown impacts
Going beyond this problem with the emissions of specific chemicals vs. emissions from energy production, we come to the point that even if toxicity and fate analysis for all the chemicals involved are included in LCA, the impact assess- ment only considers known environmental impacts. This seems appropriate, but often the fact is neglected that the impacts considered are not all the impacts existing but all the impacts known up to now, while impacts of mechanisms unknown today cannot be included. This means that rather non-toxic substances, one of which is the red dyestuff, are not relevant within LCIA although such chemicals or their degradation products can lead to environmental impacts in future times. If extrapolation factors are not really a solution already for substances with data gaps, they are simply not applicable to substances with no toxicity or effect data at all. Instead, a new impact category for substances with unknown impacts would have to be created for substances with limited data available. However, it is rather difficult to define and quan- tify an 'unknown impact'. Unknown damages cannot be empirically measured, therefore prom" indicators must be used. Hofstetter
(1999)
discusses the problem of finding a proxy for unknown damage in detail. He chooses bio- accumulation as a proxy, whereas Soheringer(1996, 1999)
points which are independent of the effect a substance can have. Since the presence of a chemical in the environment is a good indicator for the threat it implies (KLOPFF~, 1994), we apply these indicators to the textile chemicals in a river model. Aiming to include such indicators into LCIA, one could weight between known and unknow~n impacts, in a similar way as the weighting between resource depletion, ecosystem impairment and health effects is performed in Eco- indicator 99 (GO~KOOP and SPPJ~'4sMa, 1999). However, rather than suggesting a proposal for that kind of aggrega- tion, we suggest here that the environmental fate of the 'non- energy' chemicals should be tracked beyond the scope of current LCIA methods. In the following section, we use a simple fate model that adds information on the regional fate of the textile chemicals to the LCIA results.
3.2 A simple river model
A simple box model, which has been described elsewhere ( S ~ c ~ et al., 2000a), is used for investigating the fate of the selected textile chemicals in rivers. In the present version, the model represents the Rhine river between Basle and the North Sea (700 krn) but it can easily be adapted to other situ- ations as well. The river is divided into 70 boxes of 10 krn length, as is visible in Fig. 6, a). Fig. 6, b) shows the cross sec- tion of the model with the different compartments of moving water (index w l ) , stagnant water (index w2), and sediment (s). The processes considered within each box are photolysis, sedimentation, and biodegradation (aerobic and anaerobic) in water and sediment ( S ~ c F _ a et al., 2000a). Since pho-
tolysis takes place only in the top I m layer, the photolysis rate constants given in Table 1 are reduced by the factor of I m/river_depth, which is equal to 0.204 in the model. From each box to the subsequent one, advective flow takes place at an average speed of 1 m/s (Rhine: 0.5 m/s to 1.3 m/s). The water flow is assumed to increase by a factor of 4 between Basle and the North Sea due to inflows from tributaries. The emission is supposed to happen at Basle.
The model is open so that persistent chemicals eventually leave the model. This means that accumulation of such chemicals in the receiving ocean water is not covered. Highly persistent chemicals have to be investigated with global fate models (ScHy_a~CF~ et al., 2000b). The model used here, in contrast, is intended to illustrate regional contamination and potential accumulation in river sediments. Chemicals pass- ing through the model can be identified as problematic.
3.3 Modelling results
With the river model, the fate of the four substances from the T-shirt life cycle is investigated. The chemical structures of the substances are given in Fig. 7; the chemicals' input data are listed in Table 1 above.
For these four chemicals, the steady-state concentrations in all boxes of the river model are calculated (Table 3). c,, i and c, denote the concentrations in moving water and sediment, respectively. Note that these concentrations reflect the situ- ation after a considerable time of continuous release when the steady state has been reached in all environmental me-
Fig. 6" Geometry of the box model for a river. Cross section reproduced from Scheringer et al, (2000a).
LCA Methodology
Fate Modelling Within LCA
( H O ) 2 O P - - C H 2 H2C ~ PO(OH)2
\ N - CH2CH2 - N - CH2CH2 - N /
/
[
\
(HO)2OP----CH2 (HO)2OP---~CH2 H 2 C - PO(OH)2
Complexing agent/sequestrant DTPMP NH - - Bridge ~ NH NH NH
/
\
Chromophore Chromophore Dyestuff~
--~ ~N~.__ SO 3 Na + C _ _ ~Optical brightener DAS1
-- ~--
CI
CHa
Softener DTDMAC; R = tallow alkyl (C16--C18)
Fig. 7: Chemical structures of the four textile chemicals investigated. DTPMP: diethylenetriamine penta(methylenephosphonic acid). The dyestuff is a homobifunctional reactive dyestuff of the LS type (the exact structure including the chromophore is confidential). The optical brightener DAS 1 (4,4'-bis[(4- anilino-6-morpholino-l,3,54riazin-2-yl)amino]stilbene-2,2'-disulfonate) is one of the two important laundry optical brighteners in Switzerland, DTDMAC: ditallowdimethylammonium chloride. Tallow denotes CI6 to C~8 alkyl chains as they are obtained from tallow as a natural product.
dia including the sediment. For all chemicals, the same rate of release is used because only a relative comparison of the chemicals is intended here. Since the rate of release and all concentrations are correlated linearly in the model, the ab- solute value of the release rate does not matter for a relative comparison of the chemicals. In addition, the indicators 'per- sistence' and 'spatial range' that are to be calculated from the concentration values are independent of the absolute magnitude of the concentrations.
The concentrations Owl,1 in the first box, which receives the emissions, vary by 15% between the softener and the complexing agent, depending on the rates of degradation and sedimentation. In the last box, the concentrations c~.,, have dropped to 25.5% (dyestuff), 22.S% (optical bright- ener), 21% (complexing agent), and 5% (softener) of the initial concentrations. Table 3 also contains the PEC values for water and sediment obtained with USES-LCA. These values are compared here with the concentrations in the last box of the river model where the differences in the environ- mental fate of the chemicals are best discernible. It shows that USES-LCA leads to a higher variability among the chemi- cals in the water concentrations and to a lower variability in the sediment concentrations. In USES-LCA, all sediment concentrations are higher than the corresponding water con- centrations. In both models, the softener has the lowest water concentration while the dyestuff has the highest water and the lowest sediment concentration. The optical brightener exhibits the highest sediment concentration in both models. Finally, from the concentrations in the two water compart- ments in all boxes of the river, the total mass contained in the water body under steady-state conditions, M~ st (in kg),
is derived and divided by the continuous inflow c/(in kg/ day), thus yielding the residence time % of the chemicals in the water body of the river:
) M~" tst
1 [ stst stst , w
"t'w = - - " ~ w l , j " VwI,j +Cw2,j' Vw2,j =
q j=l q
This residence time has an upper bound given by the flush- ing time of the river, which is directly proportional to the length of the river and the inverse of the flow velocity. With the assumptions used here, this maximum residence time in the water body is equal to 9.2 days. By adding the mass in the sediment to the mass in the water body, the overall resi- dence time in the river system, x .... is obtained:
Vw2,j+Cs,j ) /t~tst l /" stst , stst stst . gs,j l-~tot "tto t q j=l I ~ w l ' j ' r q
For chemicals not entering the sediment, this overall persist- ence xto t is equal to the residence time in the water body, %. Chemicals entering the sediment, however, can have persistences significantly higher than % because they are stored for some time in a non-mobile compartment. The optical brightener exhibits a rather high overall persistence of several years, which indicates a tendency for accumula- tion in sediments. The persistence of the softener is slightly above the flushing time of the river, which corresponds to a small amount entering the sediment. Only very small amounts of the complexing agent and the dyestuff reach the sediment and, accordingly, the overall persistences of these two chemicals are almost equal to their residence times in the water body. In addition to z w and Ztot, the spatial ranges
R of the chemicals are derived from the concentration values calculated with the model. The quantity R is defined as the share of the river length that contains 95% of the sum of all concentration values of a chemical (this is the 95th percentile of the spatial concentration distribution). The results for the residence time in water, % , and the spatial range, R, are shown in combination in Fig. 8. The dyestuff, the complexing agent, and the optical brightener have residence times in water close to the flushing time of 9.2 days and travel over almost the entire length of the river. The softener has an intermediate residence time and a spatial range of about 65% of the river length. Analytical investigation of the model shows that the relationship between the residence time in water, %, and the spatial range, R, is linear for residence times below 1.5 days. However, since the maximum spatial range is given by 95% of the river length, the function R(%) approaches this upper bound with increasing residence time %, see Fig. 8. The % values of the chemicals investigated are 3 days and higher, and fall in the non-linear interval of the function R(%).
It should be kept in mind that these results are based on a very simple model with uncertain input data. In particular, the deg- radation rate constants and the adsorption coefficients of the chemicals as well as the concentration of suspended particles are crucial but uncertain model parameters. Therefore, the results should only be understood as a semi-quantitative illus- tration of the exposure pattern that emerges from the release of these four textile chemicals. Nevertheless, it can be con- cluded that persistence z and spatial range R are suitable for the assessment of chemical substances additionally to LCIA results. They provide a possibility to include persistent sub- stances, which are not covered by LCIA but could cause ef- fects to the environment not yet known. However, persistence is a double-edged criterion in a domain such as textile finish- ing since, e.g. for a dyestuff, it is necessary that it is not readily degradable- otherwise the fastness requirements against sweat, light, alkali, etc. could not be met.
c - t - O
g
v c - o o 9 dyestuff 0.8 opt. brightenersoftener compl, agent
0.6 i , 0 4 t ' i / t 0.2 / s t , r9 r e s i d e n c e time in w a t e r "Cw (days)
Fig. 8: Relationship between spatial range R (in % of the river length) and residence time in water, "c. (in days), in the river model.The maximum spa- tial range is 95% of the river length (SCHERINGER, 1999; SCHERINGER et al., 2000a); for low residence times, the relationship is linear.
4 C o n c l u s i o n s and Outlook
The comparative investigation of the LCA and fate model- ling results supports the following conclusions: (i) The local
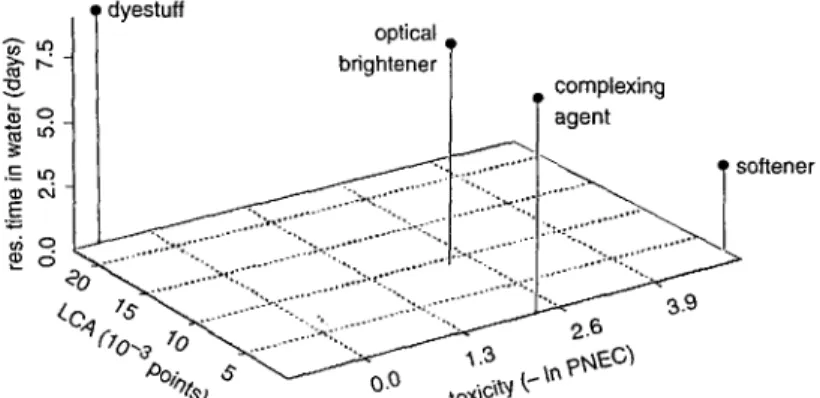
fate and effects of chemicals that are not released during energy supply and consumption are not sufficiently repre- sented by LCIA results. Fate modelling with models such as USES-LCA does not change this situation. (ii) The effect orientation of LCA and the precautionary principle in envi- ronmental chemistry are not compatible. Fate models do not solve this problem unless their results are interpreted without reference to toxicity thresholds, which can be done in terms of persistence and spatial range. This means that viable ways for a parallel application rather than a merging of LCA and fate analysis should be looked for. If the chemi- cals' energy demand, exposure potential and toxicity are chosen as three relevant dimensions (with LCA scores, resi- dence time in water, and PNEC values as the corresponding indicators), the assessment results can be depicted as shown in Fig. 9. In this three-dimensional plot, the three indicators are combined: 'LCA points of the production of the chemical' (from the reduced inventory, i.e. without the emissions from the application of the chemicals), 'residence time in water' (in days, from Table 3) and 'toxicity' (depicted as-log PNEC with PNEC values in mg/l from Table 2). To calculate com- parable PNECs for all the substances, the data-handling rules of USES-LCA, i.e. of the EU risk assessment proce- dure (EC, 1996) have been applied here: the fewer test data is at hand, the higher an extrapolation factor has to be used. The problems of this method have already been discussed above in section 2; however, using extrapolation factors seems less critical in a procedure without aggregation than incorporated into LCIA. Note that the scales of the axes represent a kind of weighting. The LCA scores indicate a high energy demand for the dyestuff and an intermediate energy demand for the optical brightener, which is in agree- ment with the fact that the production of such speciality chemicals is energy intensive. Furthermore, the results show that the dyestuff has low toxicity but is so persistent that the entire river is exposed. Possible effects of such an expo- sure are not known. Consequently, the dyestuff should be given a higher emphasis in the evaluation of impacts to aquatic systems than is the case in existing LCIA methods. The optical brightener and the complexing agent exhibit intermediate toxicity; both chemicals are sufficiently per- sistent to cause widespread exposures. The softener is most toxic to aquatic organisms while energy consumption in the production of the softener (and the complexing agent) is relatively low. The presentation introduced here is not a complete, ready-to-use method. We rather want to point out the shortcomings of LClA concerning chemicals, the boundaries set to the usefulness of models within LCIA, and a possible solution to the problem. The solution is de- liberately open: There are several dimensions which could be included in a multi-dimensional analysis, e.g. overall persistence as well as data availability and uncertainty, and the number of these dimensions could well exceed three, which would mean the choice of a spider diagram rather than a Cartesian coordinate system (RANKE and JasToRrr, 1999). The main point is to develop simple indicators which cover, in a transparent way, the relevant information for the environmental assessment of substances, leaving the final weighting and decision to the user.
LCA M e t h o d o l o g y Fate Modelling Within LCA dyestuff optical ~ brightener complexin9 o. agent -'~Lo tn ~ ,: ... ~ ir softener
nrz.
1o ... ...-1%:::22 ... 2.Fig. 9: A three-dimensional presentation of the results from the LCIA (impact scores for the production of the chemicals, representing the energy demand), the exposure-based assessment (residence times in water) and the effect*based assessment (PNEG values).
Table 3: Calculated steady-state concentrations of the textile chemicals in the moving water (c~: river model; PECaq: USES-LCA) and in the sediment (c s and PEC~d), residence time in water (x.), overall persistence ('qot), and spatial range (R). Water concentrations in the river model are in relative units of mass/volume; sediment concentrations are in corresponding units of mass/mass_sediment (based on a sediment density of 2.5 g/cm3). The PEC values from USES-LCA correspond to an inflow of 1000 t/a.
Cibacron Rot LS-6G DTDMAC DAS1 DTPMP
(dyestuff) (softener) (optical brightener) (complexing agent; sequestrant) c .... mg/I 7.93.10 -~ 7.67.10 -~ 8.71.10 .~ 8.70.10 -G c. ~ mg/I 2.02.10 -" 1.88.10 '~ 1.96.10 ~ 1.82.10 " 4.90.10 ' 3.24.10 ~ 0.173 4.5.10 -~ c~ PEC,,, PEC~o,, mg/kg mg/kg mg/I g/kg days 1.25.10-' 3.93.10' 9.14.10 -~ 9.00 7.95.10 -~ 1.65,10 -' 1.65.10 ~ 3.31 0.039 1.28.10" 0.488 8.43 9.4.10 -" 9.56.10 -~ 1.30.10 -~ 8.13 '[w days 9.01 22.8 2.3.10 ~ 8.71 Z,o, R boxes 62.9 48.9 62.5 62.2
I Acknowledgement. We thank Thomas Hofstetter for valuable discus- ] sions and two anonymous reviewers for their comments.
References
BARNTHOUSE, L.; FAVA, J.; HUMPHREYS, K.; HUNT, R.; LAIBSON, L.; NOESEN, S.; NORRIS, G.; OWENS, J.; TODD, J.; VIGON, B.; WEITZ, K.; YOUNG, J. (1997): Life-Cycle Impact Assessment: The State- of-the-Art. Pensacola, Florida, USA
BAUGHMAN, G.L. (1995): Fate of Dyes in Aquatic Systems -Part 3: The Role of Suspended Sediments in Adsorption and Reaction of Acid and Direct Dyes. Dyes and Pigments 27, 197-210 BAUMANN, U.; ENGLER, U.; KELLER, W.; KORSTEINER, W.; SCHEFER, W.
(1995): Die Beurteilung der Wassergef~ihrdung (BEWAG) am Beispiel der Textilhilfsmittel (THM). Melliand Textilberichte BOETHLING, R.S.; LYNCH, D.G. (1992): Quaternary Ammonium
Surfactants. In: de Oude, N.T. (Ed.) Handbook of Environmen- tal Chemistry 3 IF), Heidelberg, Germany
BUA (1997): BUA-Stoffbericht 191, Dioctadecyldimethylamm- oniumchlorid/Dialkyl(%6-C18)dimethylammoniumchlorid , Beratergremium fiir umweltrelevante Altstoffe, Stuttgart, Germany Ciba (1995): Sicherheitsdatenblatt Cibacron Rot LS-6G HC, Basel,
Switzerland
CLiff, C.; RANSOME, T. (1999): 'Domestic Washing of Clothes' Case Report. In: CHAINET (Ed.): Analytical tools for environmen- tal design and management in a systems perspective. Part II. CML, Leiden, The Netherlands (draft)
DALL'ACQUA, S.; FAWER, M.; FRITSCHI, R.; ALLENSPACH, C. (1999): Life-Cycle Inventories for the Production of Detergent Ingredi- ents. EMPA Report No. 244. EMPA, St. Gallen, Switzerland
EC (1996): Technical Guidance Documents in Support of Direc- tive 93/67/EEC on Risk Assessment of New Notified Substances and Regulation (EC) No. 1488/94 on Risk Assessment of Exist- ing Substances. 4 parts, EC catalogue numbers CR-48-96-(001- 004)-EN-C, Office for Official Publications of the European Community, Luxembourg
EEA (1998): Chemicals in the European Environment: Low Doses, High Stakes? The EEA and UNEP Annual Message 2 on the State of Europe's Environment, Copenhagen, Denmark Enquete-Kommission 'Schutz des Menschen und der Umwelt' des
Deutschen Bundestages (1995): Umweltvertr~igliches Stoffstrom- management, Band 4, Anwendungsbereich Textilien. Bonn, Germany
FRISCHKNECHT, R.; KNOEPFEL, I.; HOFSTETI'ER, P.; WALDFR, E.; DONES, R.; ZOLLINGER, E. (1994): Okoinventare fiir Energiesysteme. Laboratorium fiir Energiesysteme, ETH, Ziirich, Switzerland GLEDH]LL, W.E; FEIJTEL, T.C.J: (1992): Environmental Properties and
Safety Assessment of Organic Phosphonates Used for Detergent and Water Treatment Applications. In: de Oude, N.T. (Ed.) Hand- book of Environmental Chemistry 3 (F), Heidelberg, Germany GOEmKOOP, M.; SV~ENSMA, R. (1999): The Eco-indicator 99. A Dam-
age Oriented Method for Life-Cycle Impact Assessment. Meth- odology Report. PR~ Consultants, Amersfoort, The Netherlands GUINt~E~ J.B.; HEI3trNGS, R.; OE~, L. v.; WEGENER SLEESW1JK, A.; VAN
DE MEE~r, D.; VE~'4EmE, T.; RIKKEN, M. (1996): USES - Uniform System for the Evaluation of Substances: Inclusion of Fate in LCA Characterisation of Toxic Releases. Int. J. LCA 1, 133-138 HAUSCHILD, M.; WENZEL, H. (1997): Environmental Assessment of
Products. Scientific Background. Chapman & Hall, London, England
HHJUNCS, R.; GUINs G.; HUPPES, R.; LANKREIJER, H.; UDO DE HAES, U.; WEGENER SLEF~SWIJK, A.; ANSEMS, P.; EGGELS, P.; VAN DUIN, R.; DE Gore1:., H. ( 1992): Environmental Life-Cycle Assessment of Prod- ucts. Guide and Backgrounds. CML, Leiden, The Netherlands Hol:srEvm~, P. (1999): Perspectives in Life-Cycle Impact Assess-
ment. Kluwer, Dordrecht, The Netherlands
HUllER, L; NITSCHKE, L. (1994): Auswirkungen yon Textilhilfsmitteln auf die Abwasserreinigung. Tenside, Surfactants, Detergents 31, 372-376
HUIJBI{I.'.GTS, M.; THISSEN, U.; GUINEr J.B.; JAGER, T.; KALF, D.; VAN DE MEEN'r, D.; RAGAS, A.M.J.; WEGENER-SLEESWIJK, A.; REIJNDERS, L. (2000): Priority Assessment of Toxic Substances in the Frame of LCA. Part h Calculation of Toxicity Potentials for 181 Sub- stances with the Nested Multi-Media Fate, Exposure and Ef- fects Model USES-LCA. Chemosphere 41,541-573
ISO (1997): ISO/DIS 14040: Environmental Management- Life- Cycle Assessment
ISO (1998): ISO/DIS 14042: Environmental Management- Life- Cycle Assessment - Life-Cycle Impact Assessment
KLOI'FFER, W. ( 1994): Environmental Hazard - Assessment of Chemi- cals and Products, Part lh Persistence and Degradability of Or- ganic Chemicals. ESPR- Environ. Sci. & Pollut. Res. 1, 108-116 KI',AMrI',, J.B. (1992): Fluorescent Whitening Agents. In: de Oude, N.T. (Ed.) Handbook of Environmental Chemistry 3 (F), Heidel- berg, Germany
PO'ITING, J.; HAUSCI41LD, M. (1997): Spatial Differentiation in Life- Cycle Assessment via the Site-Dependent Characterisation of Environmental Impact from Emissions. Int. J. LCA 2, 209-216 PO'FrlNG, J.; SCHOH', W.; BLOK, K.; HAUSCHII.I), M. (1998): Compari-
son of the Acidifying Impact from Emissions with Different Re- gional Origin in Life-Cycle Assessment. Journal of Hazardous Materials 61,155-162
PULU, R. (1997): Okobilanz eines BaumwolI-T-Shirts mit Schwer- punkt auf den verwendeten Chemikalien. Diploma work ETH Ziirich, Switzerland
RANKE, J.; JASTORVF, B. (1999): Multidimensional Risk Analysis of Antifouling Biocides. ESPR - Environ. Sci. & Pollut. Res. 7, 105-114. DOh http://dx.doi.org/10.1065/espr199910.003
RELI.ER, A.; GERSTENBERG, J. (1997): Weifles Gold, wohin? Stand und Aussichten der Baumwollnutzung. GAIA 6, 35-51 RIVM (National Institute of Public Health and Environmental Pro-
tection); VROM (Ministry of Housing, Spatial Planning and the Environment); WVC (Ministry of Welfare, Health and Cul- tural Affairs) ( 1994): Uniform System for the Evaluation of Sub- stances (USES), version 1.0. Distribution No. 111441150. Min- istry of Housing, Spatial Planning and the Environment, The Hague, The Netherlands
SCHERINGER, M.; BERG, M. (1994): Spatial and Temporal Range as Measures of Environmental Threat. Fresenius Environmental Bulletin 3,493-498
SCHErUNGER, M. (1996): Persistence and Spatial Range as Endpoints of an Exposure-Based Assessment of Organic Chemicals. Envi- ronmental Science and Technology 30, 1652-1659
SCHERINGER, M. (1999): Persistenz und Reichweite von Umwelt- chemikalien. Wiley-VCH, Weinheim, Germany
SCHERtNGEIq M.; HALDER, D.; HUN(~ntBOHLER, K. (2000a): Compar- ing the Environmental Performance of Fluorescent Whitening Agents with Peroxide Bleaching of Mechanical Pulp. Journal of Industrial Ecology 3, 77-95
SCHERINGER, M.; WEGMANN, E; FENNER, K.; HUNGI".RBUHI.ER, K. (2000b): Investigating the Cold Condensation of Persistent Or- ganic Pollutants with a Global Multimedia Fate Model. Envi- ronmental Science and Technology 34, 1842-1850
STOLL, J.M.; ULRICH, M.M.; GIGER, W. (1998): Dynamic Behavior of Fluorescent Whitening Agents in Greifensee. Field Measure- ments Combined with Mathematical Modeling of Sedimenta- tion and Photolysis. Environmental Science and Technology 32, 1857-1861
VAN DE MF.ENT, D.; D~ BRUIJN, J.H.M. (1995): A Modeling Proce- dure to Evaluate the Coherence of Independently Derived Envi- ronmental Quality Objectives for Air, Water and Soil. Environ- mental Toxicology and Chemistry 14, 177-186
Received: Nov. 1 lth, 1999 Accepted: April 27th, 2000 Online-First: September 7th, 2000
Referees 2000
We would like to express our sincere gratitude to all referees who have evaluated the articles published in 2000, both in print and online (online-first articles), and likewise to all referees of the past years who were not listed by name. The peer reviewers are invited primarily from the editors and their colleagues of Int. J. LCA, but also from the authors and their colleagues of the journal. The professionalism and wisdom of the referees form the backbone of the scientific quality of a journal. We feel ourselves especially privileged as the peer-reviewers of Int. J. LCA are outstanding with regard to their knowledge and experience. They provide their rare spare time for the sake of a high-standard quality journal.
Andersson, Karin Finkbeiner, Matthias Huybrechts, Diane Renner, Isa
Azapagic, Adisa Finnveden, G6ran Itsubo, Norihiro Rizzo, Gianfranco
Baldo, Gian Luca Fleischer, Giinter Jensen, Allan Astrup Rubik, Frieder
Bare, Jane Franke, Marina Jungbluth, Niels Saur, Konrad
Boustead, Ian Frischknecht, Rolf Kasai, Junichi Schmidt, Wulf-Peter
Brady, Kevin Galliard, G&ard Kl6pffer, Walter Seppelt, Rolf
Braunschweig, Arthur Geldermann, Jutta Kli~ppel, Hans-Jiirgen Sharma, Vinod
Bretz, Rolf Goedkoop, Mark Krewitt, Wolfram Tukker, Arnold
Broberg, Ole Graedel, Thomas Lave, Lester Udo de Haes, Hellas
Ceuterick, Dirk Hansson, Per-Anders Lindfors, Lars-Gunnar
Hatori, Yukiyoshi Matsuno, Yasunari Vigon, Bruce
Consoli, Frank Hauschild, Michael Miiller-Wenk, Ruedi Vinod, Sharma
Cowell, Sarah Heijungs, Reinout Norris, Gregory Volkwein, Stephan
Curran, Mary Ann Hofstetter, Patrick Owens, William Weidema, Bo P.
Ekvall, Tomas Hunt, Robert Pennington, David Werner, Frank
Fava, Jim Huppes, Gjalt Ranke, Johannes White, Peter
Feijtel, Tom Hur, Tak Rebitzer, Gerald Yasui, Itaru