f
Computer-based lung sound
simulation
M. Kompis E . W . Russi
Pulmonary Division, Department of Internal Medicine, University Hospital of Zurich, 8091 Zurich, Switzerland
A b s t r a c t - - A n algorithm for the simulation of normal and pathological lung sounds is developed. The simulation algorithm is implemented on a personal computer as well as on a digital signal processor system in real time. Normal, bronchial and tracheal breathing sounds can be generated, and continuous and discontinuous adventitious lung sounds can be added. The attributes of the individual sound components, such as loudness, frequency, duration or number of occurrences within one breathing cycle, are controlled by the user. The quality of the simulations is evaluated by sending audio tapes to 15 experienced pulmonary physicians for a formal assessment. Each tape contains five simulated lung sounds and five real lung sounds from a commercially available teaching tape, presented in random order. Simulated lung sounds are slightly better rated in terms of realism and signal quality when compared to the recordings from the teaching tape. The differences are, however, not significant. 13 out of the 15 physicians feel that computer- based lung sound simulators would be a useful and desirable teaching tool for ausculta- tion courses.
Keywords--Auscultation, Computer simulation, Computer-aided instruction, Respiratory sounds, Teaching materials
Med, Biol. Eng. Comput., 1997, 35, 231-238
/
1 IntroductionCHEST AUSCULTATION is all important part of clinical patient assessment. The skills required to interpret the auscultatory findings are traditionally learned by listening to the lung and heart sounds of many different patients. Although this method is excellent in terms of a comprehensive approach to the patient, it is afflicted with some inherent disadvantages. It tray be difficult for a student to compare actual tung or heart sounds with similar findings, since they may not be accessible at the same time. Also, rare auscultatory findings are seldom available for demonstration.
For lung sounds, tape recordings of real auscultatory find- ings solve only a part of the above-mentioned problems. The instructor has to rely on a limited collection of lung sounds, whereby the duration of each sound is itself limited. For comparing different auscultatory findings, tape recordings are not a satisfactory solution, since the recordings often differ in several parameters in concert such as loudness, location in the breathing cycle and timbre, and hardly ever only in that one aspect which is in the focus of interest.
Computer-aided instructional programs (RuSso, 1991) based on digital signal presen.tation (PASTERKAMP et al.,
1989) are superior to tape recordings in a nttmber of aspects, such as speed of access to any desired recording or the availability of airflow information. However, some of the drawbacks persist, most notably the inability to vary a single aspect of a lung sound while keeping all others unchanged.
First received 19 April and in final form 13 November 1996 Correspondence should be addressed to Erich W. Russi
~) tFMBE: 1997
Heart sound simulators (TRAN et al., 1995) have been used for many years and are able to overcome many of these problems. The use of these devices for teaching purposes has been investigated systematically and shown to be bene- ficial (HARREL et al., 1990). To our knowledge, no similar device exists for the simulation of lung sounds. Apart from their use as a teaching tool, lung sound simulators might be useful in all applications which require well-defined and easily reproducible lung sounds, such as the evaluation of compu- terised lung sound analysis systems (COHEN and LANDSBERG,
1984; KAISLA et al., 1991; NISSAN and GAVP~ELY, 1993;
SANKUR et al., 1994).
We aimed to assess the feasibility and potential usefulness of a computer-based lung sound simulator. This was accom- plished by developing a new flexiblesimutation algorithm followed by a blinded study to compare the quality of the simulated sounds to those recorded on a commercially avail- able teaching tape (BAEDEKER et al., 1991).
2 Lung sound simulation algorithm
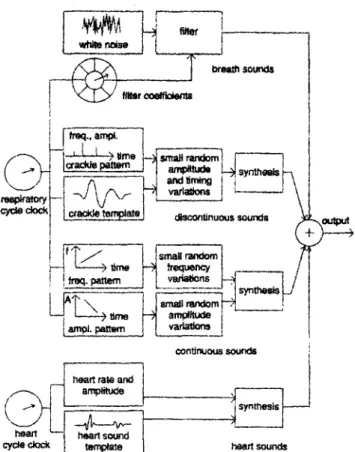
Fig. t shows a block diagram of the lung sound simulation algorithm. Simulated signals are generated as sequences of samples at a constant sampling rate of 2500 l:Iz. This rate is low when compared to the rates usually used in lung sound analysis (COHEN and LANDSBERG, 1984; KA[SLA et al., 1991; SAt, aCUR et al., 1994; PASTERKAMP, 1992), but is sufficient to represent most of the signal energy of the majority of all lung sounds. In contrast to lung sound analysis, no unexpected high-frequency components can occur, and computing time can be economised. In principle, the presented algorithm can generate simulated lung sounds at any sampling rate, where
[
tr~l., am~. |m ~ ~ L ~a~le ~ I ~ sound.
)
'
~ t ' ~ - - - - ~ i--'A ~ ' ~ I ~ 1
conlJr~ous s o u n ~ i heart ral~ and
I
Fig. I Schematic representation of lung sound simulation algorithm
low values will mainly limit the reproduction of the high- frequency components of tracheal sounds.
When analysing lung sound recordings, several sound categories can be discriminated. The presented simulation algorithm can generate signals containing sounds from four different sound categories, as shown in Fig. 1. Three cate- gories of lung sounds, namely breath sounds, continuous adventitious sounds and discontinuous adventitious sounds, as well as heart sounds, can be generated. Breath sounds, discontinuous and continuous adventitious lung sounds are linked by a common respiratory cycle clock. Other than that, each category is generated independently, and any or all of them can be deactivated by the user.
2.1 Breath sounds
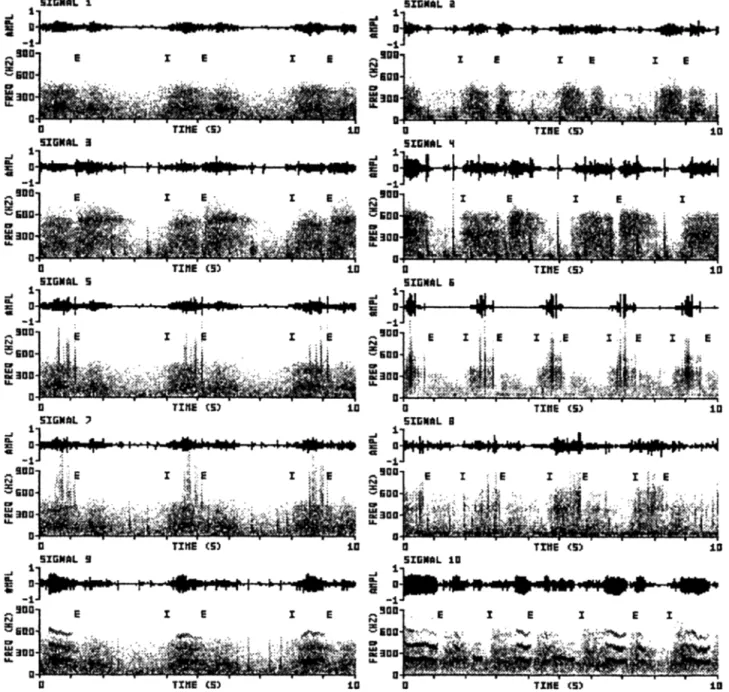
Breath sounds can be characterised as band-limited noise, the amplitude and spectrum of which changes in a character- istic manner as a function of the air-flow rate over a respira- tory cycle. Depending on the auscultation site and the underlying pathology (if any), breath sounds e~a be normal, bronchial, or tracheal, and are classified according to their spectral characteristics (GAV~mLY, 1995; KOMPIS, 1995). Signal 1 in Fig. 2 shows an example of a normal breath sound, whereas signal 4 shows a tracheal breath sound along with some heart sounds. As a linear grey-scale is used in Fig. 2, there seems to be a relatively sudden drop in the spectra above 450 Hz and 650 I/z, respectively.
Breath sounds are imitated by filtering white noise produced
by a random number generator (W~gOW and S ~ S , 1985)
with an all-pole infinite impulse response filter. The filter coefficients are averaged estimates of auto-regressive (AR) parameters of real lung smmds. The characteristics of the simulated sound is similar to the real sound used for analysis, so filter-sets for normal, bronchial and tracheal breath sounds were generated. It was observed previously that at the given sampling rate the information of no more than four AR-
coefficients can be found in successive breath cycles. (KOMPIS, 1995), Thus a filter order o f four was used, which is in the lower range when compared to the extreme values of 3-4 (VANDERSCrtOOT et al., 1992) and 6-8 (GAV~ELV and HERZBERG, 1992) found in the literature with different sam- pling rates and quality, criteria.
Although frequency spectra have been found to change little for certain airflow ranges and recording sites (K~MAN, 1986; GAVamLV and CUGELL, 1996), our own findings and pub- lished data (GAVmELY and CUGELL, 1996, Figs. 2B and 5) suggest that amplitudes increase faster with airflow at fre- quencies above 300 Hz than at lower frequencies. This makes the use of multiple sets of coefficients advisable. 16 sets of filter coefficients, stored in a cyetic table, are used to model a single respiratory cycle; 8 each for inspiration and expiration. This number of sets was selected as it was found that fiarther segmentation of real breath sounds does not increase the stationarity within the segments (Reverse arrangement test: GAVRIELY and HERZBERG (1992); BENDAT and PIERSOL, (1986)). The actual filter coefficients are taken from the cyclic table according to the momentary state of the respira- tory cycle clock. Transitions between successive filter sets are smoothed by linear interpolation of the filter coefficients. Inspiration is assumed to take up 30% of the total respiratory cycle time, expiration 70%. However, this ratio can be changed by the user.
2.2 Discontinuous adventitious tung sounds
Discontinuous adventitious lung sounds or crackles are short acoustic events of tess than 20 ms duration, consisting of an initial deflection followed by a number of oscillations. Crackles can be heard in a variety of pathologic conditions. They can be classified as coarse or fine according to their temporal and spectral characteristics (MU~AKATA et al., 1991). Often the distribution of the crackles within the respiratory cycle follows a pattern which can be found in several successive breaths.
To model discontinuous adventitious sounds, a crackle pattern table is generated under the control of a random number generator. The table contains the timing and the coarseness of the number of crackles chosen by the user. The template of a single coarse crackle from a real lung sound recording (five half cycles, total duration 7.2 ms, initial deflection width IDW 1.5 ms, two cycle duration 2CD 6.2 ms, see MUNAKATA et a/., (1991) for definitions) is stored in a table. Crackles with different degrees of coarseness are produced by compression of the crackle template in the time domain. Table 2 in the text of MUNAKATA et al., (1991) supports the underlying assumption that fine and coarse crackles can be modelled with a reasonable accuracy using a single, accordingly compressed or stretched waveform. The resulting waveform is added to the simulated signal. As 99% of the signal energy of the crackle template can be found below 650 Hz, compression factors of up to 1.9 can be used at the given sampling rate of 2500 Hz. For enh,-mced realism, small random variations in amplitude (4-20%) and timing (4-20 ms) o f the individual c r a c k l e s make the patterns in successive breath cycles similar, but not identical.
2.3 Continuous adventitious lung sounds
Continuous adventitious lung sounds can be heard in various pathologic conditions, most notably in asthma. They are almost periodic with a fundamental frequency of usually between I00 and 800Hz and durations mostly between 0.3 and 2 s (KOMPIS, 1995). Signals 9 and 10 in Fig. 2 show two
Fig. 2 Representative sections of 10 s of the ten signals used in the evaluation study. The upper trace in each signal representation shows the
amplitude (AMPL) in arbitrary units vs. time, The lower portion shows the corresponding sonogram; i.e. the magnitude (arbitrary units, same linear greyscale for all signals) plotted against tfme and frequency. I and E denote the beginning of inspiration and expiration, respectively
examples of lung sounds containing ccmtinuous adventitious sounds.
To simulate continuous adventitious lung sounds, manually generated tables containing the coarse amplitud~ and fre- quency pattern are used. These basic patterns contain only the relative pitches and amplitude levels at the beginning and at the end of a given continuous adventitious lung .sound and are modified by the user in absolute pitch, absolute loudness, duration, as well as by small random amplitude and frequency variations under the control of a random number generator. It was found that small variations of both amplitude and fie- queney are necessary to obtain a reasonably natural sound. Continuous adventitious sounds s(t) (t denotes time) are synthesised by evaluating the formula
s(t) = A(t). (sin(og(t). t) + A t 9 sin(2co(t) 9 t)
+ A2. sin(3co(t), t)) (1)
with fixed values At =0.5 and As=0.1. The amplitude A(t) and the momentary indian frequency co(t) are calculated as
A(0 = &(0- G ( 0
(2)
and
co(t) = 2~ .fo(t) . CF(t)
(3)
respectively. Ao(t) denotes the coarse amplitude pattern and
fo(O the frequency pattern from the above-mentioned tables.
CA(t) and CF(t) are slowly fluctuating functions with an expected value of 1, each evaluated separately using the formula
C ( t + T s ) = l + ( C ( t ) - l ) . 1--~R + AR'R"
(4)
where T, denotes the sampling period and R is a different number from a zero-mean random-number sequence each time eqn. 4 is evaluated. C(t) shows slow random variations around
1 with a time constant of Tn and a standard deviation of An times the standard deviation of the random number sequence from which R is taken. In our simulation, R has a uniform probability density distribution between - 1 and + 1. AR is 0.1 for the frequency variations and 0.4 for amplitude variations. A time constant Tn of 0.25 s is used for all calculations. 2.4 Heart sounds
To simulate heart sounds, two tables holding the template of a first heart sound and a second heart sound are stored. Versions of the templates, scaled in amplitude, are added to the simulated signal according to the heart rate and loudness desired by the user. This simple procedure does not turn the lung sound simulator into a heart sound simulator, but it can add an astonishingly realistic touch to the simulated output signal.
3 Implementation
The lung sound simulation algorithm was implemented on two different platforms. In the version used for the evaluation study in Section 4, the simulator is a FORTRAN program for personal computers. Signals of up to 30 s in length can be created off-line, i.e. the signal is available only after the entire process of simulation has been completed. In a second version, a slightly simplified form of the algorithm was implemented on a ADS P2101 digital signal processor system*, in real time using assembly language. Changes of the simulation para- meters during the simulation process are immediately effec- tive and determine the properties of the continuously generated lung sound.
4 Evaluation study of quality of simulations: materials and methods
The primary goal of lung sound simulation is to produce a clear and realistic subjective impression in the learning pro-
tess. Therefore, the evaluation of the simulation must be based on the subjective judgement of human listeners. Although objective criteria such as the frequency spectra must be similar for similar real and simulated signals, they do not by them- selves guarantee an adequate subjective impression in a human listener.
To evaluate the quality of the simulated sounds, audio tapes with real and simulated lung sounds were sent to 15 pulmon- ary physicians for a formal assessment. Their clinical experi- ence at the time of the investigation ranged from 14 to 30 years (mean 18.6 years).
4.1 Test signals
For the recording of the audio tapes, a personal computer equipped with a 12 bit digital-to-analogue converter was used. The sampling rate was 2500 Hz. The signals were passed through a low-pass filter with a cutoff frequency o f 1160 Hz and 72 riB/octave roll off, prior to recording on attdio tapes'['. Each tape contained the same ten lung sounds, but their order was varied randomly. Table I shows a list of these
* Espresso-board, Saddle Point Systems, Oakland CA, USA f Sony C60 UX-S tapes, Technics RS-X101 tape recorder
sounds. Five real lung sounds from a commercially available teaching tape (BAEDEKER et al., 1991) were recorded along
with five simulated sounds. The duration of each sound was 30 s. The signal-to-noise ratio (SNR) was estimated from the signals which do not contain adventitious lung sounds (signals 1 to 4) by evaluating the total signal variance in consecutive segments of 0.1 s. The variance of those 10% of all segments with the lowest variance (end-expiratory segments considered to contain background noise only) was then compared with the variance of the loudest 10%. The SNRs were 16.5 dB and 17.1 dB (simulated and real sound, respectively) for normal breath sounds and 19.8 dB and 19.4 riB, respectively, for tracheal sounds. Fig. 2 shows a representative portion of 10 s of each sound in the time domain and in a sonogram representation. For the simulations, we attempted to maintain the highest possible grade of realism, while matching the acoustic impression of the teaching tape examples. For all simulated sounds, an entire respiratory cycle was 4 s long, the inspiratory part being 30% thereof. Signal 5 (coarse crackles), was simulated with five crackles per inspiration (compression of the crackle template in the time domain by 0.9), signal 7 (fine crackles) with 50 crackles (time compression factor 0.6). In signal 9, each continuous adventitious sound lasted for 0.85 s. The underlying coarse frequency pattern was a con- stant fundamental frequency )~ of 180 Hz, and the relative amplitude pattern function Ao(t) was a linearly decreasing
slope starting at 1.0 and ending at 0.5 within each continuous sound.
4.2 Questionnaire
The physicians were informed that real and simulated signals were recorded on the tapes, but not how many of which category and in which order. They had to judge each signal using a multiple choice questionnaire on the following aspects:
(i) the clinical finding
(ii) the realism of the signal and the assumed origin (simula- tion or real signal)
(iii) the overall quality of the signal
As a minimal requirement, the output signal of a useful lung- sound-simulator must be clearly and unequivocally recognised by a trained physician. To describe the clinical finding the physicians were asked to rate the breath sound either as normal, tracheal or of unclear quality. Discontinuous and
Table I Signals recorded o n the audio tapea used in the evaluation
study
simulated sounds
real sounds from the teaching tape
signal no. description signal no. description
1 normal breath 2 normal b~ath
sound sound
3 tracheal breath 4 tracheal breath
sound with loud sound with loud
heart sounds heart sounds
5 coarse late 6 coarse late
inspiratory crackles inspiratory crackles
7 fine late irmpiratory 8 fine late inspiratory
crackles with soft crackles with soft
heart sounds heart sounds
9 inspiratory rhonchi 10 ins- and expiratory
with soft heart rhonchi and
sounds wheezes with soft
heart sounds
continuous adventitious sounds had to be categorised either as present or absent. In addition, if discontinuous sounds were perceived, it was asked whether they were fine or coarse.
To determine the realism o f the presented lung sounds the participants were asked to judge the realism and the assumed origin of each signal by choosing one of the following: ---natural sound/probably real lung sound
--intermediate realism/undecided about the source ---artificial sound/probably simulated lung sound
The answers were formulated in such a way that the realism o f each sound was linked explicitly to the assumed source. This measure was taken to avoid puzzling combinations.
The physicians rated the overall signal quality either as good, intermediate or poor. To answer this question, they were asked to rely on their subjective judgment only. No additional criteria were given, as how to judge the rather vague term of signal quality. This approach was chosen to obtain a sensitive parameter, where the participants could show their uneasiness if they felt that there was 'something wrong' with a signal, possibly without being able to be more specific. In an addi- tional question, the participants were asked whether they thought that using a lung sound simulator for teaching pur- poses would be useful and desirable.
4.3 Statistical analysis
The statistical significance of the differences between real and simulated lung sounds was evaluated on a 5% level by one-sided Wilcoxon-Mann-Whitney test.
5 Evaluation study of quality of simulations: results 5.1 Clari O, of the findings
To assess the clarity o f the findings, the distribution of serious mistakes in the judgments of the findings was ana- lysed. A serious mistake was assumed, when either:
(i) an adventitious continuous or discontinuous lung sound was not heard, although it was present in the signal or (ii) an adventitious continuous or discontinuous lung sound was perceived, although there was none in the signal or (iii) an adventitious continuous sound was perceived as a discontinuous sound or vice versa.
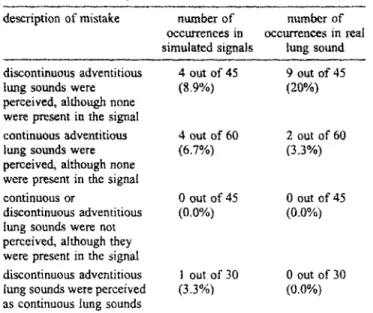
In the judgement of the 75 presented simulated signals, nine serious mistakes occurred, whereas in the 75 real signals from the teaching tapes, 11 serious mistakes occurred. Table 2 shows the distribution of these mistakes.
5.2 Realism and signal quality
On the left of Fig. 3, the rating of sound realism is shown for 147 of the 150 presented signals. Three answers (one each o f the signals 2, 3 and 4 in Table t) were not usable, i.e. no or several answers were given. The simulated signals were rated as slightly more natural than the signals from the teaching tape, however, the difference was not statistically significant. The fight side o f Fig. 3 shows a similar representation for rating of the sound quality for 148 of the 150 presented signals. Two answers were not usable. The signal quality of 66.7% o f the real and 70.7% of the simulated signals was rated as good. The simulated signals were perceived as slightly better in quality, although again the difference was not statistically significant.
Medical & Biological Engineering & Computing May 1997
Table 2 Distribution of serious mistakes
description of mistake number of number of occurrences in occurrences in real simulated signals lung sound discontinuous adventitious 4 out of 45 9 out of 45
tung sounds were (8.9%) (20%)
perceived, although none
w e r e present in the signal
continuous adventitious 4 out of 60 2 out of 60
lung sounds were (6.7%) (3.3%)
perceived, although none were present in the signal
continuous or 0 out of 45 0 out of 45
discontinuous adventitious (0.0%) (0.0%) lung sounds were not
perceived, although they were present in the signal
discontinuous adventitious I out of 30 0 out of 30 lung sounds were perceived (3.3%) (0.0%) as continuous lung sounds
5.3 Realism and discernibility of individual sound compo- nents
The perceived realism was also analysed as a function of the individual sound components contained in the presented signals. Fig. 4 shows the results for the breath sounds only (signals 1, 2, 3, and 4), for the signals with discontinuous adventitious lung sounds (signals 5, 6, 7, and 8), and for the signals with continuous adventitious lung sounds (signals 9 and 10). For all three categories, the simulated sounds were rated as slightly more natural. Again, none of the differences was statistically significant.
Besides realism, the discernibility between normal and tracheal breath sounds as well as between fine and coarse crackles was analysed. For the discernibility between normal and tracheal breath sounds, only the answers concerning signals 1, 2, 3, and 4 were used. Although all signals contained breath sounds, its quality was not explicitly stated for those teaching-tape examples, which contained adventitious lung sounds. Furthermore, it was assumed that the palXicipants might have been distracted by adventitious lung sounds. The results in Table 3a show that 80% o f the simulated breath sounds and 67% of the real breath sounds were rated correctly. The analysis of discernibility between fine and coarse crackles was performed with signals 5, 6, 7, and 8. The results
a r e summarised in Table 3b. In 80% of the simulated signals and 60% o f the real signal the crackles were classified correctly.
5.4 Usefulness of lung so,rod simulator for teaching purposes
T h e participants were asked whether they thought that using a lung sound simulator for teaching purposes would be useful and desirable. The four possible answers were 0) yes, (ii) no, (iii) I don't know; I am not sure, and (iv) I do not feel competent enough to answer this question. 13 out o f the 15 physicians (86.7%) thought that lung sound simulators would be useful (yes) and two o f them (13.3%) were not sure (answer iii).
6 Discussion
A flexible tung sound simulation algorithm was developed and implemented. The quality o f the simulations was evalu- ated in a blinded study. Our findings suggest that simulated
Fig. 3 Rating of presented signals in terms of realism (left) and signal quality (righ 0
Fig. 4 Rating of the realism of individual signal components. Breath sound data summarises the ratings of signals 1 to 4 in Table 1; discontinuous sounds signals 5 to 8, and continuous sounds signals 9 and 10
lung sounds can be as discernible and natural as their real counterparts. In all aspects which were evaluated by experi- enced chest physicians, the simulated tung sounds were perceived as slightly superior to the real ones, though none of these differences were statistically significant.
In the evaluation study, a commercially available teaching tape was used. This choice was motivated as follows. The tape is v, qdely used by students and thus takes a similar position in learning auscultation as the simulator is planned to do. The recordings are very typical for a variety of specific ausculta-
Table 3a Discernibility between normal and tracheal breath sounds
rating answers for simulated answers for real lung
signals sounds
normal tracheal normal tracheal
breath breath breath breath
normal 12 1 8 1
tracheal 0 12 3 12
unclear 3 2 4 2
Table 3b Discernibility between fine and coarse crackles
rating answers for simulated answers for real lung
signals sounds
fine coarse free coarse
crackles c r a c k l e s c r a c k l e s crackles
fine 12 2 9 6
coarse 2 t2 6 9
no answer 1 1 0 0
tory findings, and their quality (i,e. background noise, arti- facts, timbre when compared to auscultation by stethoscope) is excellent when assessed in informal listening tests. One draw- back of the teaching tape is that detailed information on the recording apparatus is not readily available. However, we feel that for a subjective comparative study the excellent reprodu- cibility of the sounds themselves more than outweighs the limited reproducibility of the original recording conditions.
When analysing the clarity of the findings (Table 2), it is noteworthy that out of a total of 20 serious mistakes, 19 involved an adventitious lung sound which was heard where none was present. Most of the errors concentrated on only a few signals. Six out of the 15 physicians believed they heard crackles in the normal breath sound from the teaching tape (signal 2), and three o f them heard a continuous adventitious sound in the simulated tracheal breath sound (signal 3). 15 of the non-existing adventitious sounds were heard in signals without a pathological finding (signals 1 to 4). We believe that these serious mist~.es can partly be explained as a systematic bias c~used by the study design. Some of the participants might have suspected that a pathological finding is present in most of the presented sigmds. We analysed ~gnal 1 by visual inspection (time domain and sonogram) as well as by listening to it through high- as well as low-quality tape recorders. No evidence was found for the presence o f crackles. Soft heart sounds are present, but to our judgement, they' cannot be confused with crackles. Nevertheless, it is impossible to reject the possibility that any given real lung sound contains abso- lutely no very soft adventitious lung sounds.
The continuous sounds heard in signal 3 can be explained by the prominent frequency band around 500 Hz (see Fig~ 2). Possibly, this undesired feature in our simulations could be diminished by choosing a different tracheal breath sound for the calculation of the filter coefficients or by using a higher
filter order for tracheal sounds, as suggested by GAVRIELY and HERTZBERG, (1992), Tracheal sounds are known to contain signal energy even above 1500 Hz. Although we think that the spectral maximum around 600-700 Hz may be the key feature by which human listeners discriminate between normal and tracheal breath sounds, there are other maxima, namely around 1500 Hz (KRAMAN et al., 1996) which are not reproduced with the sampling rate o f 2500 Hz. As the required computing power is by now very affordable, we suggest that future implementations o f the lung sound simulator use sampling rates well above 3 kHz.
The initial deflection width IDW was 1.4 ms for the simulated coarse crackles, and 0.9 ms for the simulated fine crackles. The two cycle duration for these signals was 5.6 ms and 3.7 ms, respectively. In the corresponding real signals, these values varied slightly, but were bound to be very similar on average, as the choice o f the simulation parameters was based upon them. The coarse and free crackles in our test material sound distinctly different, and the misclassification rate of 20 to 40% between coarse and fine crackles is probably due to the different personal interpretations of the terms 'coarse' and 'fine'. Note that the impression o f a relative lack o f low-frequency signal energy in signal 8 (real coarse crackles, Fig. 2) results from the combination o f soft breath sounds and loud crackles with their inherent bandpass char- acteristics.
When comparing continuous adventitious lung sounds (dia- gram on the right hand side in Fig. 4), the difference between test signals 9 and 10 was greater than in the other examples, signals 1 to 8. The real signal contained several inspiratory and expiratory continuous sounds, whereas in the simulated signal a single inspiratory wheezing sound per breathing cycle was present. This single sound was similar in pitch to those in the real signal. Although several adventitious lung sounds could have been easily simulated, we chose not to overload the signal as the result seemed more natural to us. It is possible and even likely that the participants felt the same way when they judged the two signals. I f this is true, then it was the composition of the signal that was favoured in the simulation rather than the naturalness of the individual signal compo- nents. The capability o f composing a lung sound according to individual needs is a unique and desirable feature of a simulator.
While some o f the parameters used for simulation are based on previous research or our systematic investigations (KOMPIS, 1995), many o f the parameters represent what we consider to be reasonable estimates. This is especially true for the simula- tion of continuous adventitious lung sounds, where much of the required data is not readily available today. We do not claim to have found or used the best algorithms or parameters for lung sound simulation. However, we believe that they are sufficient to prove the feasibility of computer-based lung sound simulators and to show their potential.
With the given simulation algorithm, it is possible to simulate lung sounds wkich are comparable to actual sounds with respect to realism. It is also possible to create quite unnatural sounds, e.g. by exaggerating one o f the simulating parameters. This m a y be a risk of the simulator, and in a clinical teaching module, a warning mechanism might be useful to alert the user about unrealistic parameters settings. However, the possibility of exaggerating parameters is a major advantage o f the simulator. When used as a teaching tool, any aspect can be emphasised, until it is clearly audible and discernible from other acoustic elements, even to the inexper- ienced listener.
13 out of the 15 physicians indicated that a lung sound simulator would be a useful instrument for teaching purposes. This result emphasises one potential application. Lung sounds
simulators might be used in auscultatory classes or as one o f the features in computer-aided instruction (CAI) programs (e.g. MANGIONE et al., 1992). They can be easily embedded into multimedia presentation settings (SESTINI et al., 1995). Apart from their use as a teaching aid, lung sound simulators might be useful for other applications where well-defined and easily reproducible lung sounds are required. These applica- tions might include investigations into the capabilities and limits o f individual listeners for lung sound discrimination, or testing and evaluation of automatic lung sound analysis systems (COHEN and LANDSBERG, 1984; KAISLA et al., 1991; N~S~N and GAVRIELY, 1993; SAYKUR et at., 1994). As the simulator was designed and tested only as a source of signals for human listeners, it is possible that the simulations would not show the same degree of naturalness when analysed by complex computer programs.
Acknowledgements--This work was supported by the Roche
Research Foundation, Basle (Switzerland), the Janggen-Prhn Foun- dation, St. Gallen (Switzerland), and the Ernst-Hadorn Foundation, Zurich (Switzerland). The authors wish to thank the publishing house Urban mad Schwarzenberg, Munich (Germany), for their permission to use their teaching tape (BAEDEKER et al., 1991) for our study, and Prof. G. R. Wodicka and Dr. K. Bloch for their critical advice and help in preparing this text.
References
BAEDEKER, W., I~R.OKER, P. B., SYBRECI-IT, G. W., and STRUFE, R. (1991): 'Herzt6ne und LungengerSusche' (Urban Schwarzenberg, Munich, Germany)
BENDAT, J., and PIERSOL, A. (1986): "Random Data' (Wiley, 2rid Edn.) pp. 97-99
COHEN, m., and LANDSBERG. D. (1984): 'Analysis and automatic classification of breath sounds', IEEE Trans. Bio-Med. Eng., 33, pp. 585590
GAVRIELY, N., and HERZBERG, M. (1992): 'Parametric representation
of normal breath sounds', J. Appl. Physiol., 73, pp. 1776-1784 GAVI~IELY, N. (1995): 'Breath sounds methodology' (CRC Press,
Florida, USA)
GAVRIELu N., and CUGELL, D. W. (1996): 'Airflow effects on amplitude and spectral content of normal breath sounds', J. Appl.
Physiol., 80, pp. 5--13
HARREL, J. S., CH/uMPAGNE, M. T., JARR, S., and MIYAYA, M.
(1990): 'Heart sound simulation: how useful for critical care nurses?', Heart Lung, 19, pp. 197-202
KAISLA, T., SOVIJARVI, A., PIIRL~,, P., RAJALA, H. M., HALTSONEN,
S., and ROSQVIST. T. (1991): 'Validated method for automatic detection of lung sound crackles', Med. Biol. Eng. Comput_, 29, pp. 517-521
KOMPtS, M. (1995): 'Entwicklung mad Evaluation eines elektro- nischen Lungenger~iuschsimulators' (Doctoral thesis, School of Medicine, University of Zurich. Switzerland)
KR~MA/q, S. S. (1986): 'Effects of lung volume and airflow on the frequency spectrum of vesicular lung sounds', Respir. PhysioL, 66, pp. 1-9
KRAMAN, S. S., PASTERKAMP, H., K.OMPIS, M., TAKASE, M., and
WODICKA, G. R. (1996): 'Origin and significance of tracheal sound spectral analysis'. Proc. Int. Lung Sound Conf. Chester, UK, p. 2 MANGIONE, S., NIEMANN, L. Z., and GRACELEY, E. A. (1992): 'A
comparison of computer-based learning (CBL) and small group teaching of pulmonary auscultation to first year medical students'.
Proc. Int. Lung Sound Conf., Helsinki, Finland, p. 39
MLrNAKATA, M., UKITA, H., DOI, 1., OHTSLrKA, Y., MASAKI, Y., HOMMA, Y., and KAWAKAMI, Y. 0991): "Spectral and waveform characteristics of fine and coarse crackles', Thorax, 46, pp. 651- 657
NlSSAN, M., and GAVRII-.LY, N. (I 993): 'A microcomputer based lung sounds analysis', Comp. Methods Programs Biomed., 40, pp. 7-13 PASTEP, KAMP, H., CARSON, C., DAMN, D., and OH, Y. (1989): 'Digital respirosonography---new images of lung sounds', Chest, 96, pp. 1405-1412
PASTERKAMP, H. (I 992): 'Netm Entwickltmgen und Erkenntnisse bei der Erforschung yon Atemger~usehen', Pneumologie, 4a, pp. 602- 611
RUSSO, A, G. (1991): 'RALE (respiration acoustics laboratory envir- onmem)', Focus Crit. Care, lg, pp. 527
SANKU1L B., KAVHA, Y. P., GOLER, E. C., and ENGL~, T. (I 994): 'Comparison of AR-based algorithm for respiratory sounds classi- fication', Comput. Biol. Meal, 14, pp. 67-76
SESTIN1, P., RENZONI, E., ROSS1, M., BELTRAMI, V., and VAGLIA- SINOT, M. (1995): 'Multimedia presentation of lung sounds as a learning aid for medical students', Eur. Respir. J., 8, pp. 783- 788
TUN, T., JO,~'ES, N. B., and FOTHEROILL, J. C. (1995): 'Heart sound simulator', &led. Biol. Eng. Comput., 33, pp. 357-359
VANDERSCI-tOOT, J., NILS, G. J., VAN DE COPELLO, K., and SCHREUR, H. J. W. (1992): 'AR model orders of lung sounds'. Proc. dnnu. Int. Conf. IEEE. Eng. Med. Biol. Soc., 14, pp. 2531-2532
WIDROW, B., and STEAr%'~S, S. D. (1985): 'Adaptive signal proces- sing" (Prentice-Hall) pp. 459-467
Author's biography
Martin Kompis received his diploma and doctoral degree in Electrical Engineering from tl'r Swiss Federal Institute of Technology (ETH), Zurich, in 1989 and 1993, and his diploma in Medicine and MD-degree from the University of Zurich in 1994 and 1995, respectively. He is currently with the ENT deparmlent of the University Hospital of Berne, Switzerland. His research interests include biomedical acoustics and signal processing.