HAL Id: hal-00682413
https://hal.archives-ouvertes.fr/hal-00682413
Submitted on 26 Mar 2012HAL is a multi-disciplinary open access archive for the deposit and dissemination of sci-entific research documents, whether they are pub-lished or not. The documents may come from teaching and research institutions in France or abroad, or from public or private research centers.
L’archive ouverte pluridisciplinaire HAL, est destinée au dépôt et à la diffusion de documents scientifiques de niveau recherche, publiés ou non, émanant des établissements d’enseignement et de recherche français ou étrangers, des laboratoires publics ou privés.
structural alphabet
Alexandre de Brevern, Agnel Praveen Joseph, Hélène Valadié
To cite this version:
Alexandre de Brevern, Agnel Praveen Joseph, Hélène Valadié. Species specific amino acid sequence - Protein local structure relationships: An analysis in the light of a structural alphabet. Journal of Theoretical Biology, Elsevier, 2011, 276 (1), pp.209. �10.1016/j.jtbi.2011.01.047�. �hal-00682413�
www.elsevier.com/locate/yjtbi
Species specific amino acid sequence – Protein local structure relationships: An analysis in the light of a structural alphabet
Alexandre G. de Brevern, Agnel Praveen Joseph, Hélène Valadié
PII: S0022-5193(11)00073-7 DOI: doi:10.1016/j.jtbi.2011.01.047 Reference: YJTBI 6359
To appear in: Journal of Theoretical Biology
Received date: 9 July 2010 Revised date: 28 January 2011 Accepted date: 31 January 2011
Cite this article as: Alexandre G. de Brevern, Agnel Praveen Joseph and Hélène Val-adié, Species specific amino acid sequence – Protein local structure relationships: An analysis in the light of a structural alphabet, Journal of Theoretical Biology, doi:10.1016/j.jtbi.2011.01.047
This is a PDF file of an unedited manuscript that has been accepted for publication. As a service to our customers we are providing this early version of the manuscript. The manuscript will undergo copyediting, typesetting, and review of the resulting galley proof before it is published in its final citable form. Please note that during the production process errors may be discovered which could affect the content, and all legal disclaimers that apply to the journal pertain.
Species Specific Amino Acid Sequence – Protein Local
Structure Relationships: an analysis in the light of a
structural alphabet.
Alexandre G. de Brevern1,2,3,§,*, Agnel Praveen Joseph1,2,3 and Hélène Valadié4,*
1 Dynamique des Structures et Interactions des Macromolécules Biologiques (DSIMB), INSERM, U665, Paris,
6, rue Alexandre Cabanel, F-75015, France.
2 Université Paris Diderot - Paris 7, UMR-S665, Paris, F-75015, France. 3 Institut National de la Transfusion Sanguine (INTS), Paris, F-75015, France.
4Unité mixte de recherche 5168 CNRS-CEA-INRA-Université Joseph Fourier, Institut de Recherches en
Technologies et Sciences pour le Vivant, 17 rue des Martyrs, 38054 Grenoble Cedex 9, France.
§ Corresponding author: Alexandre G. de Brevern, INSERM UMR-S 665, DSIMB, Université Paris Diderot – Paris 7, Institut National de Transfusion Sanguine (INTS), 6, rue Alexandre Cabanel, 75739 Paris cedex 15, France
Email addresses : alexandre.debrevern@univ-paris-diderot.fr, agnel.praveen@univ-paris-diderot.fr, hvaladie@yahoo.fr.
*These authors contributed equally to this work
Abstract
Protein structure analysis and prediction methods are based on non-redundant data extracted from the available protein structures, regardless of the species from which the protein originates. Hence, these datasets represent the global knowledge on protein folds, which constitutes a generic distribution of amino acid sequence – protein structure (AAS-PS) relationships. In this study, we try to elucidate whether the AAS-PS relationship could possess specificities depending on the specie.
For this purpose, we have chosen three different species: Saccharomyces cerevisiae, Plasmodium falciparum and Arabidopsis thaliana. We analyzed the AAS-PS behaviors of the proteins from these three species and compared it to the “expected” distribution of a classical non-redundant databank. With the classical secondary structure description, only slight differences in amino acid preferences could be observed. With a more precise description of local protein structures (Protein Blocks), significant changes could be highlighted.
Saccharomyces cerevisiae’s AAS-PS relationship is close to the general distribution, while striking differences are observed in the case of Arabidopsis thaliana. Plasmodium falciparum is the most distant one.
This study presents some interesting view-points on AAS-PS relationship. Certain species exhibit unique preferences for amino acids to be associated with protein local structural elements. Thus, AAS-PS relationships are species dependant. These results can give useful insights for improving prediction methodologies which take the species specific information into account.
Key-words: amino acids, protein folds, secondary structure, structural alphabet, Protein Blocks, malaria.
1. Introduction
The knowledge of three dimensional structures of proteins gives valuable insights into their functions. Prediction of different features of protein structure like secondary structures (Jones, 1999; Madera et al., 2010; Pollastri et al., 2002), protein disorder (Madera et al., 2010; Xue et al., 2010), transmembrane regions (Illergard et al., 2010; Pylouster et al., 2010), phosphorylation sites (Biswas et al., 2010), protein flexibility (Bornot et al., 2011) or the generation of structural models (de Brevern, 2010; Kelley and Sternberg, 2009), are mainly based on machine learning algorithms (Brylinski and Skolnick, 2008; Rangwala et al., 2009; Xu et al., 2008). Protein structure analyses and prediction methods derive information from non-redundant databanks that represent the state-of-the-art of available data (i.e., solved protein structures). In a way, they reflect a generic (‘expected’) distribution of amino acid sequence – protein structure (AAS-PS) relationship. Though the term “protein sequence-structure relationships” have been used extensively in literature, to avoid confusion with a few discussions on genomic data and to add clarity, we use the abbreviation AAS-PS here.
The number of protein sequences available is enormous and rapidly growing. Indeed, the number of completely sequenced genomes currently available is more than 1,250 (Kyrpides, 1999; Liolios et al., 2008). On the other hand, due to technical difficulties, the number of protein structures available is highly limited (Berman et al., 2003; Berman et al., 2000; Lattman, 2004; Service, 2008) and these prediction approaches can help in narrowing down the gap between the sequence and structure space.
Though the AAS-PS relationships observed across different proteins in a databank follow similar patterns, it is not known whether there could be variations based on the species from which the proteins are derived. Analyses of genomic data have given some interesting insights in this direction. Considerable variation in the composition of nucleotides has been observed
in some genomes, e.g., Plasmodium falciparum (Gardner et al., 2002; Singer and Hickey, 2000). This compositional bias can be attributed to species-specific and/or environmental specific preferences (Dumontier et al., 2002; Wang and Lercher, 2009). Nucleotide bias is also reported to have an effect on the codon usage and hence, the amino acid composition of encoded proteins (Paila et al., 2008; Singer and Hickey, 2000). An interesting work has been carried out on the comparison of protein structural properties in Bacillus subtilis and Escherichia coli (Marashi et al., 2007). The main focus was on the amino acid solvent accessibilities and helix propensities and they could identify specificities in the properties observed in each species. Considering these observations, we base our work on the hypothesis that differences in the AAS-PS behaviors could be observed across species.
Indeed, a few research studies on similar grounds have been reported recently. Out of the sequences available for P. falciparum proteins, the functions of 5,460 are predicted and 3,200 are of unknown function (www.plasmodb.org). Sequence annotation methods work mainly by analogy, i.e., by aligning the protein sequences. Improvement in the quality of sequence alignment could be achieved with the help of information on the amino acid compositional bias or with the use of composition adjusted substitution matrices (Brick and Pizzi, 2008; Paila et al., 2008; Yu et al., 2003). Asymmetric substitution matrices were also derived from proteomes with biased amino acid distributions (Bastien et al., 2005).
These studies reflect the fact that different species are marked with variations in their genomes and this is reflected at the level of amino acids that build proteins. Nevertheless, structural researches rely equally on the information from all the proteins, without taking into account the species they come from. Considering these points, we have analyzed whether the proteins originating from different species exhibit different AAS-PS relationships. For this purpose, we have analyzed protein structures with two main view points: (i) classical secondary structure and (ii) a finer description of local fold based on a structural alphabet
named Protein Blocks. The secondary structure description based on regular structural elements, i.e., α-helix and β-sheet (Pauling and Corey, 1951; Pauling et al., 1951), is widely used to describe and visualize 3D structures. Nevertheless, these regular structures do not provide a complete description of the local protein structure; more than 50% of the structure is described as coil which is defined to represent highly variable backbone conformations. However, regular local folds could be traced in the segments assigned as coils.
Hence, local protein structure libraries that are able to give a complete approximation of protein structures, without any a priori knowledge of secondary structure assignments, have been developed. The complete set of local structure prototypes defines a structural alphabet (Karchin et al., 2003; Offmann et al., 2007). The number of prototypes in a library is important for characterizing the local fold (Hunter and Subramaniam, 2003; Martin et al., 2008; Sander et al., 2006; Tung et al., 2007; Unger et al., 1989). The structural alphabet used in this study, is composed of 16 local structure prototypes that are 5 residues long, called Protein Blocks (PBs, see Figure 1) (de Brevern et al., 2000; Joseph et al., 2010a; Joseph et al., 2010b). They efficiently approximate every part of protein structures (de Brevern, 2005) From different eukaryotic kingdoms, three species namely Arabidopsis thaliana (At), Plasmodium falciparum (Pf) and Saccharomyces cerevisiae (Sc) were chosen for the study. The genomes of At and Sc have similar AT content (~62-64%) while Pf is highly diverged (82%).With the availability of complete genome sequences, sufficient data on the proteome could be also extracted for analyzing the compositions. For these three species, we characterize the amino acid preferences associated with different local folds. These behaviors were then compared with the general or ‘expected’ AAS-PS distribution. This will help to put into evidence the interest and importance of considering the species of origin to refine the knowledge on AAS-PS relationship. Moreover, from a methodological point of view, this
study highlights the interest of using a more detailed local structure description with a structural alphabet, to improve and refine the analysis of sequence-structure relationships.
2. Materials and Methods
2.1. Data sets.
In the same way, we have generated three species-specific non-redundant databanks. The Protein Data Bank was searched for structures from three species namely Arabidopsis thaliana, Plasmodium falciparum and Saccharomyces cerevisiae. Only X-ray crystallography structures were selected and the sequence identity cutoff of 90% was chosen. In September 2008, 68 crystallographic structures of P. falciparum (i.e., 36,175 amino acids), 123 of A. thaliana (i.e., 173,450 amino acids) and 427 of S. cerevisiae (i.e. 202,410 amino acids), were available (see the Supplementary material 1 for the list of identifiers). These three databases are referred as Pf, At and Sc respectively in the text. To analyze the effect of redundancy on the results, new non-redundant databanks have been generated for the three species at 50 and 25% sequence identity cutoffs.
To compare the composition of the proteome and sequences of structures available in the PDB, proteome sequences were obtained from publically available databases. The A. thaliana proteome was downloaded from the National Center for Biotechnology Information database (ftp://ftp.ncbi.nih.gov/genomes/Arabidopsis_thaliana/). About 33,711 annotated sequences were available (version of January 2008). The P. falciparum proteome was obtained from the PlasmoDB database (http://plasmodb.org/common/downloads/release-5.4/Pfalciparum/). From the database release 5.4, 5,460 automatically annotated sequences were downloaded.
2.2. Secondary structure assignments
Secondary structure assignment has been carried out using DSSP (Kabsch and Sander, 1983) (CMBI version 2000). DSSP assignment is based on the hydrogen bond lengths between backbone atoms of amino acids describing the 3D structure. As the assignment of more than 3 basic states is given by DSSP, we have grouped the results in three states: the α-helix contains α, 3.10 and π - helices, the β-strand contains only the β-sheet assignment and the coil includes the other assignments (β-bridges, turns, bends and coil), as done in earlier studies (Fourrier et al., 2004; Tyagi et al., 2009a). Default parameters have been used.
2.3. Protein Blocks
Protein Blocks (PBs) correspond to a set of 16 local prototypes, labeled from a to p (cf. Figure 1), described as a series of (Φ, Ψ) dihedral angles corresponding to 5 residues (Joseph et al., 2010a; Joseph et al., 2010b). They were obtained using an unsupervised classifier similar to Kohonen Maps (Kohonen, 2001) and Hidden Markov Models (Rabiner, 1989). The PBs m and d can be roughly described as prototypes for the central region of α-helix and β-strand, respectively. PBs a through c primarily represent the N-cap of β-strand while e and f correspond to C-caps; PBs g through j are specific to coils, PBs k and l correspond to N cap of α-helix while PBs n through p to C-caps. This structural alphabet allows a reasonable approximation of local protein 3D structures (de Brevern et al., 2000) with a root mean square deviation (rmsd) of about 0.42 Å (de Brevern, 2005). PB assignment has been made using an in-house tool (available at http://www.dsimb.inserm.fr/DOWN/LECT/), similar assignment is also made by PBE web server (http://bioinformatics.univ-reunion.fr/PBE/) (Tyagi et al., 2006). They have been used to describe the 3D protein backbones (de Brevern, 2005) and to perform local structure prediction (Benros et al., 2009; de Brevern et al., 2000; de Brevern et
al., 2004; Dong et al., 2008; Etchebest et al., 2005; Rangwala et al., 2009; Zimmermann and Hansmann, 2008). PB based approaches have been proved to be effective in prediction based on protein sequence-structure relationships (de Brevern et al., 2007; Li et al., 2009; Tyagi et al., 2009b). Several other applications based on the PB structural alphabet have also given successful results (de Brevern et al., 2009; Dudev and Lim, 2007; Faure et al., 2009; Thomas et al., 2006; Tyagi et al., 2008). The characteristics of our structural alphabet have been compared with those of 8 other structural alphabets. This comparative study clearly shows that our PB alphabet is highly informative, with the best predictive ability of those tested (Karchin, 2003; Karchin et al., 2003).
2.4. Z-score
The Z-score quantifies the preference for each amino acid to occur in a local structural element (secondary structures and PBs). The amino acid occurrences in each secondary structure and PB have been normalized into a Z-score:
with
n
iobs,j the observed occurrence number of amino acid i in position j for a given secondary structure or PB andn
ijth, the expected number. The product of the occurrences in position j with the frequency of amino acid i in the entire databank equalsn
ith,j. Positive Z-scores correspond to over-represented amino acids and vice versa; threshold values of 4.42 and 1.96 were chosen to indicate the level of significance (probability less than 10-5 and 5.10-2 respectively). On the Figures, a color code is used to highlight and easily compare the behavior in different databanks; only the preferences corresponding to the central positions are presented. This approach was earlier used to analyze the amino acid representativeness inZ n
( )
i, j =ni, jobs− n i, j th
Protein Blocks in our earlier works (Benros et al., 2009; Benros et al., 2006; de Brevern and Hazout, 2001; de Brevern and Hazout, 2003; de Brevern et al., 2000; de Brevern et al., 2002; de Brevern et al., 2007; de Brevern et al., 2004; Etchebest et al., 2005; Etchebest et al., 2007; Ghozlane et al., 2009).
3. Results
3.1. Analysis of the Databanks
The species specific databanks contain only structures from the species: Saccharomyces cerevisiae (noted as Sc in the text), Arabidopsis thaliana (At) and Plasmodium falciparum (Pf). A classical non-redundant databank (NR) was also obtained from the PDB (Berman et al., 2000). The three specialized databanks (Sc, At and Pf) represents 202,410, 173,450 and 36,175 amino acid residues respectively. With regards to our previous studies (Bornot et al., 2009; de Brevern, 2005; de Brevern et al., 2000; de Brevern et al., 2002; de Brevern et al., 2004; Etchebest et al., 2005; Fourrier et al., 2004), the number of amino acids in each databank is sufficient to analyze the sequence – structure relationships in terms of secondary structure and Protein Blocks (Tyagi et al., 2009b).
Amino acid frequencies observed in each databank are reported in Table 1. As explained earlier, the NR is considered as the reference dataset. It corresponds to the “expected” distribution of amino acids. The amino acid frequencies of the At databank are most similar to those of the NR databank. Only one amino acid, i.e., Methionine, is under-represented by about 40%, when compared to its frequency in the NR databank. For the other 19 amino acids, the variation is below 10%. For the Sc databank, only 3 out of the 20 amino acids exhibit notable changes in their relative occurrence frequencies. Isoleucine and Lysine are over-represented, with an increase of about 30% in the occurrence frequency, while Alanine is
under-represented with a decline in the frequency by 30%. For the other 17 amino acids, the variations are below 10%. The amino acid frequencies associated with the Pf databank has profound differences. Half of the amino acids exhibit variations of more than 30%. Five amino acids namely (Isoleucine, Tyrosine, Cysteine, Asparagine and Lysine) have significantly higher frequencies, and on the other hand, four others (Alanine, Tryptophan, Glutamine and Arginine) have lower frequencies compared with those observed for the NR databank.
3.2. Comparison with the proteome sequence dataset
As a first step, we performed a precise analysis of the protein structure databanks to ensure that they reflect the amino acid distribution observed in the proteome of the respective species. These differences observed with respect to the NR databank could be due to the amino acid composition of each species. Figure 2 shows the distribution of amino acids observed within the proteomes of Arabidopsis thaliana and Plasmodium falciparum (indicated as Atp and Pfp) and also in the structural databanks At and Pf. Thus, the amino acid
composition of protein structure databanks mainly reflects the proteomic composition of the organisms. Nevertheless, particular behaviors can be observed for two amino acids while comparing the compositions of Pf and Pfp. The frequency of Asparagine (N) and Lysine (K)
in Pfp is significant, i.e., 14.4% and 11.7% respectively, and these are higher than those
observed in the structural Pf databank. The increase is about two times for N and 25% for K. These amino acids mainly characterize the low-complexity regions which are largely absent in the solved structures (see Supplementary material 2 for more details and also refer to (Aravind et al., 2003; DePristo et al., 2006; Joubert and Joubert, 2008)).
The amino acid distributions differ between species (and this is remarkable for Pf) and our structure datasets present a good reflection of the proteome content. Hence they can be used as representative datasets. Moreover, even if the amino acid frequencies vary between species (see Table 1), we can observe that the frequencies of regular secondary structures and Protein Blocks (PBs), are quite similar, as indicated in Table 2. Hence, all the datasets can be compared in terms of local protein structures.
3.3. Secondary structure contents
In order to analyze the variation in AAS-PS relationship between species in terms of secondary structures, the Z-scores distribution of amino acids associated with α-helix, β-strand and coil have been computed for the 4 databanks. As Z-score follows a χ-square distribution, a statistical threshold can be used to quantify the significance of the under or over-representation of an amino acid in the secondary structural element. Z-scores were computed on a sequence window of 5 residues (corresponding to PB length). Figures 3a to 3c show amino acid frequency (in terms of Z-score) associated with α-helix, β-strand and coil for At, Pf, Sc and NR databanks. We perform a precise analysis per state to explore specific behaviors within species. Methionine is seen to have a high preference to be associated with α-helices, this over-representation is not observed in Pf alone (see Figure 3a). The distribution of Histidine and Cysteine in At and Pf databanks, show significant differences. The amino acid distribution in β-strands of Pf shows striking variation when compared to the other datasets, especially the preference for Tryptophan is not seen (see Figure 3b). For the coil state, the amino acid distribution in At shows some differences, marked with a higher preference for Phenylalanine, Tyrosine, Tryptophan, Glutamine, Glutamate and Arginine while in the case of Pf, only the over-representation for Tryptophan is absent (see Figure 3c).
Figure 3d shows a hierarchical clustering of different species based on the amino acid distributions. As expected, the secondary structures contents show similarities across the 4 databanks; the 3 states (α-helix, β-strand and coil) cluster separately, each state localized on a specific branch. We can notice that the distribution in Sc is close to NR for all states, while amino acid preferences in At has similarity with Pf. Though a few variations are noted, a detailed picture of species specific behavior in terms of amino acid distribution cannot be obtained using the secondary structure description alone.
3.4. Protein Block contents in terms of species
The 16-state description of local structures in terms of Protein Blocks (PBs) is expected to highlight finer differences in the amino acid preferences in each species (Joseph et al., 2010b). We can categorize the amino acid preferences for different PBs into 3 classes while comparing At, Pf and Sc with NR: (i) new over- or under-representation, i.e., a higher or lower amino acid preference not seen in NR, but found in the other datasets, (ii) absence of over- or under-representation, i.e., an over- or under-representation seen in NR but missing in other datasets, and (iii) the most important variation, inversion in the preference, i.e., an amino acid which has high preference for association with a PB in NR, is poorly represented in one or more of the other datasets and vice – versa (see the Supplementary material 3 ).
For the 16 different PBs, Sc has 32 new and significant amino acid over- or under-representations, only 4 amino acid preferences are missing and no inversion is observed. This roughly corresponds to a change affecting about 2.25 amino acids per PB (11.25%). Pf has a more complex behavior as it has 16 new significant associations, but 27 preferences are missing and 3 have been inverted. These modifications affect an average of 2.87 amino acids per PB (14.35%). Finally, At shows 52 new significant over- or under- amino acid
representations, 15 are missing and 6 inversions are observed, this corresponds to a change of about 4.5 amino acids per PB (22.50%). However, the extent of variation depends strongly of the kind of PB. Some have none or only a few differences when compared to NR. For instance, the distribution of PB f’s amino acid preferences is similar for all the datasets; PB m has only one new over or under-representation in Sc and two in Pf and At.
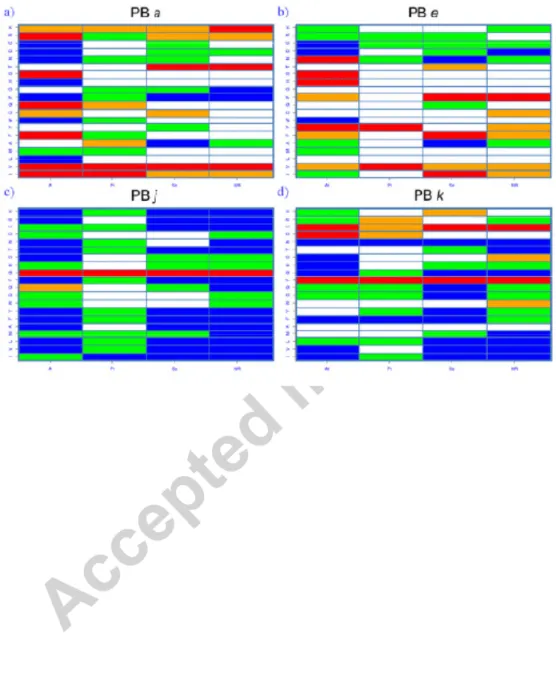
3.5. Some characteristic Protein Blocks
Figure 4 gives a visual representation of the amino acid preferences for 4 representatives PBs. PBs j and k exhibit few variations with respect to NR, while PB e shows more changes and PB a is the most variant (see Table 3). PB j (see Figure 4c) is quite determinant as it shows a strong over-representation of Glycine and all the other amino acids are under-represented. So, the over-representation of Glutamine observed for At is a surprising inversion. For Sc, the strong under-representation of Asparagine is not observed, Alanine and Arginine are highly under-represented in Pf and other significant variations can be observed. For PB k (see Figure 4d), the distribution is more complex with 4 over-represented and 13 under-represented amino acids. An inversion is observed for Arginine in the case of Pf and for Serine in At. A new over-representation is seen in Sc and At, two preferences are missing for At and three are absent in the case of Pf.
For PB e (see Figure 4b), 14 differences were observed: (i) two inversions (both in the case of At), (ii) three new over-representation for Sc, five for At and one for Pf, and (iii) one missing amino acid preference for At and 2 for Pf. PB a (see Figure 4a) exhibits the most striking variations that are species specific. Out of the 25 major changes observed, 4 are found in Sc, 12 in At and 9 in Pf. Importantly, PB a is characterized by 5 over- and 4 amino acid under-representations unique for the species. Interestingly, even if PB a connects repetitive
structures (PBs m to PB d see (de Brevern et al., 2002)), it has weak preferences for Proline and Glycine. New preferences dominate the majority of changes; 4 are observed in Sc, 10 in At and 5 in Pf. These specificities are further strengthened with 2 missing amino acids observed in At and Pf and also the inversion of 2 amino acid preferences in Pf.
3.6. Global comparison in terms of PBs
As mentioned earlier, slight differences can be observed while analyzing secondary structures, but still same states are clustered together. With PB description, strong differences have been detected across species. The hierarchical clustering of the associated amino acid distributions (see Figure 5) shows that AAS-PS relationship of PBs from different species could be really different. Indeed, three kinds of behaviors could be observed (see the Supplementary material 4). Firstly, the amino acid distributions associated with a PB are clustered together, for the four different databanks, e.g., PBs g, n and o. Secondly, three amino acid distributions (for different databanks) are clustered and the amino acid distribution of At is associated with another cluster. This behavior is observed for PBs e and h. Thirdly, the most common case (11 out of 16 BPs), three amino acid distributions are clustered and the amino acid distribution corresponding to Pf is not associated with them. The latter behaviors are due to two major factors: (i) the difference in informativity of AAS-PS relationship and (ii) the specific amino acid preferences which are species -dependent.
The informativity can be quantified as the sum of absolute values of Z-scores. At has an additional informativity of 16% compared to NR. This value decreases to +4% for Sc. For Pf, a very weak informativity is observed, i.e., 45% lower than that of NR. Thus, Pf exhibits weak AAS-PS relationships compared to other datasets. It must be also noted that some PBs
of At have more informative distributions, e.g. PB a: +72%, PB: e +60%, PB: h +39% and PB: g +20%, but still the clustering show variations.
4. Discussion
4.1. Global view
In this study, we have analyzed protein AAS-PS relationships existing in A. thaliana, Plasmodium falciparum and S. cerevisiae. We have shown that non-redundant protein structure databanks specific for these species can be compared without systematic bias, even if the P. falciparum specific databank has compositional disequilibrium in terms of certain amino acids.
For the four databanks, the analysis of AAS-PS relationships associated with the secondary structures highlights only a few differences. At the light of Protein Block description, striking specie specific behaviors are observed. The AAS-PS relationship of Sc is quite close to that of NR (i.e., expected distribution). Only slight differences are seen, e.g., no inversion is observed. A. thaliana has both an AT-content and proteome composition similar to S. cerevisiae. Nevertheless, At exhibits very distinct AAS-PS relationships. Though the informativity associated with the distributions in Sc can be compared to that of NR, At is clearly more informative, having an average variation of 5 amino acid preferences per PB which is quite striking. As seen in Table 3, these differences could result in very different amino acid signatures when compared to NR. These precise details on amino acid preferences were not highlighted in their study of Marashi and co-workers (Marashi et al., 2007). In the same way, it is expected that P. falciparum with 82% AT content and strong biases in amino acid composition, shows strong divergence in terms of amino acid usage. Its AAS-PS preferences are quite surprising. Clustering of these amino acid signatures (see Figure 5)
shows that Pf is quite far from the other species, and also from the expected view of AAS-PS (NR, see Supplementary material 5).
The last remark is promising indeed. The extensive genetic diversity of blood stage antigens is one of the key challenges for vaccine development against malaria. A recent approach proposed for antigen discovery is based on the bioinformatic selection of heptad repeat motifs corresponding to α-helical coiled coil structures (Kulangara et al., 2009). Considering the fact that the AAS-PS seen in Pf is diverged when compared to the expected / observed values (NR), such approaches could be refined or improved. For At, the differences with respect to the expected amino acid distributions are mainly due to new amino acids preferences (52), coupled with the absence of certain amino acid preferences observed in NR (15), some inversions of preferences are also observed (6). Indeed, this can be considered as a specialization unique for the species. This ratio of significant new and missing amino acid preferences is about 3.47 for At, whereas this is not the case for Pf where the ratio is only 0.59.
4.2. Specific case of P. falciparum
The sequence – structure relationship of Pf is weaker than that of the other databanks. In the hierarchical clustering shown in Figure 5, the PBs of Sc, NR and At are spread all over the dendogram, while the PBs of Pf are seen to cluster in group located in the central part of the dendogram. For proteomic approaches also, the results of our study could be of interest. The variation in the amino acid preferences associated with the local folds can have an implication in the conservation or substitutions of amino acids observed in the sequences of the species. 58% of predicted proteins of P. falciparum available in PlasmoDB have no known function (Aurrecoechea et al., 2009). As P. falciparum proteins have diverged extensively during the
course of evolution, it is difficult to find homologues for many of these proteins e.g., protein kinases (Anamika et al., 2005). Dedicated amino acid substitution matrix that is biased towards the amino acid distribution observed in P. falciparum, could help in better homology detection and functional annotation of P. falciparum proteins (Bastien et al., 2005; Brick and Pizzi, 2008; Nidhi et al., 2009; Paila et al., 2008).
Indeed, it is possible to propose equivalent (easily exchangeable) amino acids, for the species under consideration in order to obtain a reduced amino acid alphabet (Etchebest et al., 2007). This can be followed by simpler pairwise alignments, with a limited number of combinations. The detection of putative or/and new homologues would be easier and particularly interesting for Plasmodium falciparum, as its proteins represent potential therapeutic drug targets to combat malaria (Salzemann et al., 2009).
4.3. Pilot study
A pilot study has been carried out to assess the possible influence of species AAS-PS in local structure prediction. A classical Bayesian approach (Altschul et al., 1997) has been used to predict Protein Blocks from sequence (Joseph et al., 2010a). The principle was to train and validate one species specific databank and assess the prediction on the other databanks. It gives an idea of the influence of species specific preferences on prediction efficiency. 100 independent simulations have been carried out, as in one of our earlier works (Tyagi et al., 2009b). Figure 6 summarizes the results of this analysis.
For the training based on the amino acid preferences observed in the NR databank, the average prediction rate was higher for the non-redundant set (~34%) when compared to the species specific validation sets. The least prediction rate was obtained in the case of Pf (~30%) for which highly diverged sequence-structure relationships were observed, as
explained above. Predictions for Sc and At are slightly lower than the NR prediction rate (~32%).
When species specific training sets were used for the prediction, better prediction rates were obtained for the test sets from the same species (see supplementary material 6). The prediction rates were highly sensitive to the random choice of protein sequences, underlining the need for more protein structures for Plasmodium falciparum or Arabidopsis thaliana. Even though these preliminary results need to be assessed in-depth, they give good insights on the idea that the knowledge of species specific sequence-structure relationship can be used to improve the efficiency of prediction algorithms.
5. Conclusion
Our work sheds light into the fact that the sequence-structure relationship observed within a species can have considerable degree of variation when compared to the global preferences. This idea can have a positive implication in prediction and threading approaches, many of which make use of sequence alignments (Yang et al., 2008; Zhang, 2008). Here, we have shown the importance of specie dependence on protein sequence-structure relationship. Adjustments could be made in regards to the species under consideration, our future works will mainly focus in this direction. As the knowledge of the three dimensional structures of proteins has the potential to accelerate drug discovery (Congreve et al., 2005; Doppelt-Azeroual et al., 2009), recent developments in bioinformatics that mainly aim in filling the gap between sequence and structure space, have greatly transformed this research area (Doppelt et al., 2007; Hajduk, 2006; Moriaud et al., 2009). Thus, our work could be supportive in such approaches.
Hence this study puts emphasis on the fact that variations in protein sequence-structure relationships could exist between species with biased or unbiased amino acid compositions, demonstrated by the comparative analysis of A. thaliana, S. cerevisiae and P. falciparum. The efficiency of using a precise local structure description with the Protein Block approach is also underlined, and this approachappears to be more informative in the particular case of the P. falciparum. In addition, our preliminary results enable the consideration of other interesting tracks either in optimizing prediction methods or in homology modeling (Birkholtz et al., 2008).
Acknowledgments
This work was supported by grants from the Atomic Energy Commission (CEA), Ministère de la Recherche, Université Paris Diderot – Paris 7, the Institute of Blood Transfusion (INTS) and the Institute for Health and Medical Research (INSERM). APJ has a grant from CEFIPRA number 3903-E. HV had a post-doctoral fellowship from CEA. AdB acknowledges to CEFIPRA for collaborative grant (number 3903-E).
References
Altschul, S. F., Madden, T. L., Schaffer, A. A., Zhang, J., Zhang, Z., Miller, W., Lipman, D. J., 1997. Gapped BLAST and PSI-BLAST: a new generation of protein database search programs. Nucleic Acids Res 25, 3389-402.
Anamika, Srinivasan, N., Krupa, A., 2005. A genomic perspective of protein kinases in Plasmodium falciparum. Proteins 58, 180-9, doi:10.1002/prot.20278.
Aravind, L., Iyer, L. M., Wellems, T. E., Miller, L. H., 2003. Plasmodium biology: genomic gleanings. Cell 115, 771-85, doi:S0092867403010237 [pii].
Aurrecoechea, C., Brestelli, J., Brunk, B. P., Dommer, J., Fischer, S., Gajria, B., Gao, X., Gingle, A., Grant, G., Harb, O. S., Heiges, M., Innamorato, F., Iodice, J., Kissinger, J. C., Kraemer, E., Li, W., Miller, J. A., Nayak, V., Pennington, C., Pinney, D. F., Roos, D. S., Ross, C., Stoeckert, C. J., Jr., Treatman, C., Wang, H., 2009. PlasmoDB: a functional genomic database for malaria parasites. Nucleic Acids Res 37, D539-43, doi:gkn814 [pii]10.1093/nar/gkn814.
Bastien, O., Roy, S., Marechal, E., 2005. Construction of non-symmetric substitution matrices derived from proteomes with biased amino acid distributions. C R Biol 328, 445-53. Benros, C., de Brevern, A. G., Hazout, S., 2009. Analyzing the sequence-structure
relationship of a library of local structural prototypes. J Theor Biol 256, 215-26, doi:S0022-5193(08)00465-7 [pii]10.1016/j.jtbi.2008.08.032.
Benros, C., de Brevern, A. G., Etchebest, C., Hazout, S., 2006. Assessing a novel approach for predicting local 3D protein structures from sequence. Proteins 62, 865-80.
Berman, H., Henrick, K., Nakamura, H., 2003. Announcing the worldwide Protein Data Bank. Nat Struct Biol 10, 980, doi:10.1038/nsb1203-980 nsb1203-980 [pii].
Berman, H. M., Westbrook, J., Feng, Z., Gilliland, G., Bhat, T. N., Weissig, H., Shindyalov, I. N., Bourne, P. E., 2000. The Protein Data Bank. Nucleic Acids Res 28, 235-42.
Birkholtz, L., van Brummelen, A. C., Clark, K., Niemand, J., Marechal, E., Llinas, M., Louw, A. I., 2008. Exploring functional genomics for drug target and therapeutics discovery in Plasmodia. Acta Trop 105, 113-23, doi:S0001-706X(07)00262-8 [pii]10.1016/j.actatropica.2007.10.013.
Biswas, A. K., Noman, N., Sikder, A. R., 2010. Machine learning approach to predict protein phosphorylation sites by incorporating evolutionary information. BMC Bioinformatics 11, 273, doi:1471-2105-11-273 [pii]10.1186/1471-2105-11-273.
Bornot, A., Etchebest, C., de Brevern, A. G., 2009. A new prediction strategy for long local protein structures using an original description. Proteins 76, 570-87, doi:10.1002/prot.22370.
Bornot, A., Etchebest, C., de Brevern, A. G., 2011. Predicting protein flexibility through the prediction of local structures. Proteins, in press, doi:10.1002/prot.22922.
Brick, K., Pizzi, E., 2008. A novel series of compositionally biased substitution matrices for comparing Plasmodium proteins. BMC Bioinformatics 9, 236, doi:1471-2105-9-236 [pii]10.1186/1471-2105-9-236.
Brylinski, M., Skolnick, J., 2008. A threading-based method (FINDSITE) for ligand-binding site prediction and functional annotation. Proc Natl Acad Sci U S A 105, 129-34, doi:0707684105 [pii]10.1073/pnas.0707684105.
Congreve, M., Murray, C. W., Blundell, T. L., 2005. Structural biology and drug discovery. Drug Discov Today 10, 895-907, doi:S1359-6446(05)03484-7 [pii]10.1016/S1359-6446(05)03484-7.
de Brevern, A. G., 2005. New assessment of a structural alphabet. In Silico Biol 5, 283-9. de Brevern, A. G., 2010. 3D structural models of transmembrane proteins. Methods Mol Biol
654, 387-401, doi:10.1007/978-1-60761-762-4_20.
de Brevern, A. G., Hazout, S., 2001. Compacting local protein folds with a "hybrid protein model". Theo Chem Acc 106, 36-47.
de Brevern, A. G., Hazout, S., 2003. 'Hybrid protein model' for optimally defining 3D protein structure fragments. Bioinformatics 19, 345-53.
de Brevern, A. G., Etchebest, C., Hazout, S., 2000. Bayesian probabilistic approach for predicting backbone structures in terms of protein blocks. Proteins 41, 271-87.
de Brevern, A. G., Valadie, H., Hazout, S., Etchebest, C., 2002. Extension of a local backbone description using a structural alphabet: a new approach to the sequence-structure relationship. Protein Sci 11, 2871-86.
de Brevern, A. G., Etchebest, C., Benros, C., Hazout, S., 2007. "Pinning strategy": a novel approach for predicting the backbone structure in terms of protein blocks from sequence. J Biosci 32, 51-70.
de Brevern, A. G., Autin, L., Colin, Y., Bertrand, O., Etchebest, C., 2009. In silico studies on DARC. Infect Disord Drug Targets 9, 289-303.
de Brevern, A. G., Benros, C., Gautier, R., Valadie, H., Hazout, S., Etchebest, C., 2004. Local backbone structure prediction of proteins. In Silico Biol 4, 381-6.
DeLano, W. L. T., 2002. The PyMOL Molecular Graphics System DeLano Scientific, San Carlos, CA, USA. http://www.pymol.org.
DePristo, M. A., Zilversmit, M. M., Hartl, D. L., 2006. On the abundance, amino acid composition, and evolutionary dynamics of low-complexity regions in proteins. Gene 378, 19-30, doi:S0378-1119(06)00253-8 [pii] 10.1016/j.gene.2006.03.023.
Dong, Q., Wang, X., Lin, L., 2008. Prediction of protein local structures and folding fragments based on building-block library. Proteins 72, 353-66, doi:10.1002/prot.21931.
Doppelt-Azeroual, O., Moriaud, F., Delfaud, F., de Brevern, A. G., 2009. Analysis of HSP90 related folds with MED-SuMo classification approach. Drug Design, Development and Therapy 3, 59–72.
Doppelt, O., Moriaud, F., Bornot, A., de Brevern, A. G., 2007. Functional annotation strategy for protein structures. Bioinformation 1, 357-9.
Dudev, M., Lim, C., 2007. Discovering structural motifs using a structural alphabet: application to magnesium-binding sites. BMC Bioinformatics 8, 106.
Dumontier, M., Michalickova, K., Hogue, C. W., 2002. Species-specific protein sequence and fold optimizations. BMC Bioinformatics 3, 39.
Etchebest, C., Benros, C., Hazout, S., de Brevern, A. G., 2005. A structural alphabet for local protein structures: improved prediction methods. Proteins 59, 810-27.
Etchebest, C., Benros, C., Bornot, A., Camproux, A. C., de Brevern, A. G., 2007. A reduced amino acid alphabet for understanding and designing protein adaptation to mutation. Eur Biophys J 36, 1059-69.
Faure, G., Bornot, A., de Brevern, A. G., 2009. Analysis of protein contacts into Protein Units. Biochimie 91, 876-87, doi:S0300-9084(09)00106-0 [pii] 10.1016/j.biochi.2009.04.008.
Fourrier, L., Benros, C., de Brevern, A. G., 2004. Use of a structural alphabet for analysis of short loops connecting repetitive structures. BMC Bioinformatics 5, 58.
Gardner, M. J., Hall, N., Fung, E., White, O., Berriman, M., Hyman, R. W., Carlton, J. M., Pain, A., Nelson, K. E., Bowman, S., Paulsen, I. T., James, K., Eisen, J. A., Rutherford, K., Salzberg, S. L., Craig, A., Kyes, S., Chan, M. S., Nene, V., Shallom, S. J., Suh, B., Peterson, J., Angiuoli, S., Pertea, M., Allen, J., Selengut, J., Haft, D., Mather, M. W., Vaidya, A. B., Martin, D. M., Fairlamb, A. H., Fraunholz, M. J., Roos, D. S., Ralph, S. A., McFadden, G. I., Cummings, L. M., Subramanian, G. M., Mungall, C., Venter, J. C., Carucci, D. J., Hoffman, S. L., Newbold, C., Davis, R. W., Fraser, C. M., Barrell, B., 2002. Genome sequence of the human malaria parasite Plasmodium falciparum. Nature 419, 498-511, doi:10.1038/nature01097 nature01097 [pii].
Ghozlane, A., Joseph, A. P., Bornot, A., de Brevern, A. G., 2009. Analysis of protein chameleon sequence characteristics. Bioinformation 8.
Hajduk, P. J., 2006. Puzzling through fragment-based drug design. Nat Chem Biol 2, 658-9, doi:nchembio1206-658 [pii] 10.1038/nchembio1206-658.
Hunter, C. G., Subramaniam, S., 2003. Protein local structure prediction from sequence. Proteins 50, 572-9.
Illergard, K., Callegari, S., Elofsson, A., 2010. MPRAP: an accessibility predictor for a-helical transmembrane proteins that performs well inside and outside the membrane. BMC Bioinformatics 11, 333, doi:1471-2105-11-333 [pii] 10.1186/1471-2105-11-333. Jones, D. T., 1999. Protein secondary structure prediction based on position-specific scoring
matrices. J Mol Biol 292, 195-202.
Joseph, A. P., Bornot, A., de Brevern, A. G., 2010a. Local Structure Alphabets. In: Rangwala, H., Karypis, G., Eds.), Protein Structure Prediction wiley, pp. in press.
Joseph, A. P., Agarwal, G., Mahajan, S., Gelly, J.-C., Swapna, L. S., Offmann, B., Cadet, F., Bornot, A., Tyagi, M., Valadié, H., Schneider, B., Cadet, F., Srinivasan, N., de Brevern, A. G., 2010b. A short survey on Protein Blocks. Biophysical Reviews 2, 137-145.
Joubert, Y., Joubert, F., 2008. A structural annotation resource for the selection of putative target proteins in the malaria parasite. Malar J 7, 90, doi:1475-2875-7-90 [pii] 10.1186/1475-2875-7-90.
Kabsch, W., Sander, C., 1983. Dictionary of protein secondary structure: pattern recognition of hydrogen-bonded and geometrical features. Biopolymers 22, 2577-637.
Karchin, R., 2003. Evaluating local structure alphabets for protein structure prediction (PhD). Vol. PhD, pp. 301.
Karchin, R., Cline, M., Mandel-Gutfreund, Y., Karplus, K., 2003. Hidden Markov models that use predicted local structure for fold recognition: alphabets of backbone geometry. Proteins 51, 504-14.
Kelley, L. A., Sternberg, M. J., 2009. Protein structure prediction on the Web: a case study using the Phyre server. Nat Protoc 4, 363-71, doi:nprot.2009.2 [pii] 10.1038/nprot.2009.2.
Kohonen, T., 2001. Self-Organizing Maps (3rd edition). Springer.
Kulangara, C., Kajava, A. V., Corradin, G., Felger, I., 2009. Sequence conservation in Plasmodium falciparum alpha-helical coiled coil domains proposed for vaccine development. PLoS One 4, e5419, doi:10.1371/journal.pone.0005419.
Kyrpides, N. C., 1999. Genomes OnLine Database (GOLD 1.0): a monitor of complete and ongoing genome projects world-wide. Bioinformatics 15, 773-4.
Lattman, E., 2004. The state of the Protein Structure Initiative. Proteins 54, 611-5, doi:10.1002/prot.20000.
Li, Q., Zhou, C., Liu, H., 2009. Fragment-based local statistical potentials derived by combining an alphabet of protein local structures with secondary structures and solvent accessibilities. Proteins 74, 820-36, doi:10.1002/prot.22191.
Liolios, K., Mavromatis, K., Tavernarakis, N., Kyrpides, N. C., 2008. The Genomes On Line Database (GOLD) in 2007: status of genomic and metagenomic projects and their associated metadata. Nucleic Acids Res 36, D475-9.
Madera, M., Calmus, R., Thiltgen, G., Karplus, K., Gough, J., 2010. Improving protein secondary structure prediction using a simple k-mer model. Bioinformatics 26, 596-602, doi:btq020 [pii] 10.1093/bioinformatics/btq020.
Marashi, S. A., Behrouzi, R., Pezeshk, H., 2007. Adaptation of proteins to different environments: a comparison of proteome structural properties in Bacillus subtilis and Escherichia coli. J Theor Biol 244, 127-32, doi:10.1016/j.jtbi.2006.07.021.
Martin, J., de Brevern, A. G., Camproux, A. C., 2008. In silico local structure approach: a case study on outer membrane proteins. Proteins 71, 92-109, doi:10.1002/prot.21659. Moriaud, F., Doppelt-Azeroual, O., Martin, L., Oguievetskaia, K., Koch, K., Vorotyntsev, A.,
Adcock, S. A., Delfaud, F., 2009. Computational Fragment-Based Approach at PDB Scale by Protein Local Similarity. J Chem Inf Model, doi:10.1021/ci8003094 [pii]. Nidhi, T., Swapna, L. S., Mohanty, S., Agarwal, G., Gowri, V. S., Anamika, K., Priya, M. L.,
Krishnadev, O., Srinivasan, N., 2009. Evolutionary divergence of Plasmodium falciparum: Sequences, protein-protein interactions, pathways and processes. Infectious Diseases - Drug Targets 3.
Offmann, B., Tyagi, M., de Brevern, A. G., 2007. Local Protein Structures. Current Bioinformatics 3, 165-202.
Paila, U., Kondam, R., Ranjan, A., 2008. Genome bias influences amino acid choices: analysis of amino acid substitution and re-compilation of substitution matrices exclusive to an AT-biased genome. Nucleic Acids Res 36, 6664-75, doi:gkn635 [pii] 10.1093/nar/gkn635.
Pauling, L., Corey, R. B., 1951. The pleated sheet, a new layer configuration of polypeptide chains. Proc Natl Acad Sci U S A 37, 251-6.
Pauling, L., Corey, R. B., Branson, H. R., 1951. The structure of proteins; two hydrogen-bonded helical configurations of the polypeptide chain. Proc Natl Acad Sci U S A 37, 205-11.
Pollastri, G., Przybylski, D., Rost, B., Baldi, P., 2002. Improving the prediction of protein secondary structure in three and eight classes using recurrent neural networks and profiles. Proteins 47, 228-35.
Pylouster, J., Bornot, A., Etchebest, C., de Brevern, A. G., 2010. Influence of assignment on the prediction of transmembrane helices in protein structures. Amino Acids 39, 1241-54, doi:10.1007/s00726-010-0559-6.
Rabiner, L. R., 1989. A tutorial on hidden Markov models and selected application in speech recognition. Proceedings of the IEEE 77, 257-286.
Rangwala, H., Kauffman, C., Karypis, G., 2009. svmPRAT: SVM-based protein residue annotation toolkit. BMC Bioinformatics 10, 439, doi:1471-2105-10-439 [pii] 10.1186/1471-2105-10-439.
Salzemann, J., Botha, M., Dacosta, A., Degliesposti, G., Isea, R., Kim, D., Maass, A., Kenyon, C., Rastelli, G., Hofmann-Apitius, M., Breton, V., 2009. WISDOM-II: Screening against multiple targets implicated in malaria using computational grid infrastructures. Malar J 8, 88.
Sander, O., Sommer, I., Lengauer, T., 2006. Local protein structure prediction using discriminative models. BMC Bioinformatics 7, 14.
Service, R. F., 2008. Structural biology. Protein structure initiative: phase 3 or phase out. Science 319, 1610-3, doi:319/5870/1610 [pii] 10.1126/science.319.5870.1610.
Singer, G. A., Hickey, D. A., 2000. Nucleotide bias causes a genomewide bias in the amino acid composition of proteins. Mol Biol Evol 17, 1581-8.
Thomas, A., Deshayes, S., Decaffmeyer, M., Van Eyck, M. H., Charloteaux, B., Brasseur, R., 2006. Prediction of peptide structure: how far are we? Proteins 65, 889-97.
Tung, C. H., Huang, J. W., Yang, J. M., 2007. Kappa-alpha plot derived structural alphabet and BLOSUM-like substitution matrix for rapid search of protein structure database. Genome Biol 8, R31.
Tyagi, M., de Brevern, A. G., Srinivasan, N., Offmann, B., 2008. Protein structure mining using a structural alphabet. Proteins 71, 920-37, doi:10.1002/prot.21776.
Tyagi, M., Bornot, A., Offmann, B., de Brevern, A. G., 2009a. Analysis of loop boundaries using different local structure assignment methods. Protein Sci 18, 1869-81, doi:10.1002/pro.198.
Tyagi, M., Bornot, A., Offmann, B., de Brevern, A. G., 2009b. Protein short loop prediction in terms of a structural alphabet. Comput Biol Chem 33, 329-33, doi:S1476-9271(09)00051-6 [pii] 10.1016/j.compbiolchem.2009.06.002.
Tyagi, M., Sharma, P., Swamy, C. S., Cadet, F., Srinivasan, N., de Brevern, A. G., Offmann, B., 2006. Protein Block Expert (PBE): a web-based protein structure analysis server using a structural alphabet. Nucleic Acids Res 34, W119-23, doi:34/suppl_2/W119 [pii] 10.1093/nar/gkl199.
Unger, R., Harel, D., Wherland, S., Sussman, J. L., 1989. A 3D building blocks approach to analyzing and predicting structure of proteins. Proteins 5, 355-73.
Wang, G.-Z., Lercher, m. J., 2009. Biased amino acid composition in warm-blooded animals. Nature Proceedings.
Xu, J., Jiao, F., Yu, L., 2008. Protein structure prediction using threading. Methods Mol Biol 413, 91-121, doi:1-59745-574-1:91 [pii].
Xue, B., Dunbrack, R. L., Williams, R. W., Dunker, A. K., Uversky, V. N., 2010. PONDR-FIT: a meta-predictor of intrinsically disordered amino acids. Biochim Biophys Acta 1804, 996-1010, doi:S1570-9639(10)00013-0 [pii] 10.1016/j.bbapap.2010.01.011. Yang, Y. D., Park, C., Kihara, D., 2008. Threading without optimizing weighting factors for
scoring function. Proteins 73, 581-96, doi:10.1002/prot.22082.
Yu, Y. K., Wootton, J. C., Altschul, S. F., 2003. The compositional adjustment of amino acid substitution matrices. Proc Natl Acad Sci U S A 100, 15688-93, doi:10.1073/pnas.2533904100 2533904100 [pii].
Zhang, Y., 2008. Progress and challenges in protein structure prediction. Curr Opin Struct Biol 18, 342-8, doi:S0959-440X(08)00034-1 [pii] 10.1016/j.sbi.2008.02.004.
Zimmermann, O., Hansmann, U. H., 2008. LOCUSTRA: accurate prediction of local protein structure using a two-layer support vector machine approach. J Chem Inf Model 48, 1903-8, doi:10.1021/ci800178a.
Figures
Figure 1 – Protein Blocks. From left to right and top to bottom, PyMol images (DeLano, 2002) of the 16 Protein Blocks of the structural alphabet (de Brevern et al., 2000). Each prototype is five residues long and corresponds to a series of eight dihedral angles (φ,ψ). The PBs m and d can be roughly described as prototypes for the central α-helix and the central β-strand, respectively. For each PB, the preferred N terminal conformation is on the left and the C-terminal on the right.
Figure 2 - Comparison of amino acid distributions. Amino acid distributions observed for P. falciparum and A. thaliana proteomes (noted Pfp and Atp) and also in the available structures
of P. falciparum and A. thaliana (noted Pf and At). Amino acids are ranked on the basis of their frequencies in the P. falciparum proteome.
Figure 3 – Amino acid preferences of classical secondary structures. (a-c) Z-scores associated with the central positions of α-helix, coil and β-strand as assigned by DSSP, for the At, Pf, Sc and NR databanks. Each color indicates a Z-Score range; (blue): Z-scores < (−4.4), (green): (−4.4) < Z-scores < (−1.96), (white): (−1.96) < Z-scores < (1.96), (orange): (1.96) < Z-scores < (4.4), and (red): Z-scores > (+4.4). A legend for color scale is also provided. The amino acids are labeled on the vertical axis in the following order: IVLMAFYWCPGHSTNQDERK. (d) Hierarchical clustering of the preferences (3a-3c) associated with the secondary structures in At, Pf, Sc and NR databanks .
Figure 4 – Amino acid preferences of PBs. (a-d) Z-scores associated with the central positions of PB a, PB e, PB j and PB k respectively, for At, Pf, Sc and NR (see Figure 3 legend for details).
Figure 5 – Clustering of the amino acid sequence – protein structure relationships associated with PBs. Hierarchical clustering of preferences of PB central positions, seen in At (red), Pf (blue), Sc (pink) and NR (black) databanks. The PBs are noted by their respective alphabets (from a to p).
Figure 6 – PBs prediction and influence of specie context. 100 independent simulations have been carried out to predict PBs using a Bayesian prediction procedure (de Brevern et al., 2000; Etchebest et al., 2005; Tyagi et al., 2009b). From left to right (x axis), each label (NR, Sc, At and Pf) indicates databank on which the training is carried out. For each of the trainings, the prediction rates on on all databanks are plotted. The 100 prediction rates are shown in grey while a selected prediction for NR is in red, for Sc in blue, for At in orange and for Pf in black (see Supplementary data 6).
Tables
Table 1 – Amino acid frequencies of the four databanks. In bold red are highlighted the amino acids which have a variation in frequency, greater than 25%, when compared to the NR databank. Variations between 10-25% are shown in italics.
Table 2 – Secondary structures and Protein Block frequencies of the four databanks. Secondary structure and Protein Block frequencies were calculated for each of the 3 databases specific for S. cerevisiae, A. thaliana and P. falciparum, noted as Sc, At and Pf respectively; and for the non-redundant databank, noted as NR. The secondary structures were defined by DSSP, and classified in 3 states -corresponding to α-helix, β-sheet and coil (see material and methods).
Table 3 – Significant amino acid preferences in Protein Blocks. Amino acid preferences of central positions of (a) PB a, (b) PB e, (c) PB j and (d) PB k, respectively, for the NR, Sc, At and Pf databanks. Under “miss” column is given the list of amino acids whose preference is absent, compared to the NR databank. (+) and (-) correspond to over-representations (Z-score > 1.96) and under-representation (Z-score < -1.96) of the amino acids. If the amino acid is in uppercase, the Z-score is higher than 4.4 (or lower than -4.4). Amino acids in blue are over-represented (or under-over-represented) and not found over-over-represented (or under-over-represented) in the NR databank. Amino acid in red indicates inversion, i.e., the amino acid that is over-represented in the NR databank is under -over-represented in the specialized databank or vice-versa.
Supplementary Material
Supplementary material 1 – PDB identifiers for the 3 databanks. List of identifiers for the three databanks, for A. thaliana, P. falciparum and S. cerevisiae. These identifiers correspond to X-ray crystallographic structures with less than 90% pairwise sequence identity.
Supplementary material 2 – The high propensities of amino acids N and K in the Pf genome.
Supplementary material 3 – Significant amino acids in Protein Blocks. (central) Amino acid preferences of five positions of all the 16 PBs, for the NR, Sc, At and Pf databanks – see legend of Table 3 for details.
Supplementary material 4 – Clustering of the sequence – structure relationship of PBs. Each of the 16 PB s (from PB a to PB p) is highlighted in the hierarchical clustering based on the amino acid preferences of PB central positions, of the 4 databanks, as depicted on the Figure 5.
Supplementary material 5 – Hierarchical clustering of preferences at the central positions of the PBs for At, Pf, Sc and NR.
NR Sc At Pf I 5.50 6.99 6.18 8.26 V 7.04 6.58 8.11 6.77 L 8.87 9.81 9.40 9.22 M 2.05 1.58 1.28 1.73 A 8.71 6.39 7.50 5.03 F 4.09 4.46 4.55 4.50 Y 3.54 3.77 2.97 4.46 W 1.52 1.18 1.42 0.94 C 1.35 1.28 1.43 2.23 Q 3.81 3.54 3.16 2.63 P 4.68 4.16 4.86 3.53 G 7.75 5.88 7.65 6.13 H 2.38 2.19 2.50 2.08 S 5.76 6.86 6.94 6.02 T 5.60 5.48 4.91 4.70 N 4.33 5.20 3.85 7.23 D 5.94 6.11 5.71 5.80 E 6.52 6.80 6.62 6.59 R 4.97 4.25 4.81 2.84 K 5.59 7.41 6.15 9.33
NR Sc At Pf secondary structures α-helix 37.37 40.77 36.37 39.48 coil 42.72 40.96 39.96 41.16 β-sheet 21.54 19.85 23.67 20.91 Protein Blocks a 3.90 3.28 3.42 3.39 b 4.15 3.84 4.19 4.23 c 7.91 7.53 7.93 7.70 d 18.23 17.37 17.69 16.93 e 2.34 1.64 1.88 2.07 f 6.50 6.48 6.55 6.76 g 1.10 1.02 1.17 1.10 h 2.29 1.71 1.94 1.97 i 1.79 1.30 1.50 1.57 j 0.79 0.57 0.56 0.76 k 5.40 5.41 5.38 5.47 l 5.38 5.63 5.79 5.75 m 31.63 36.03 33.61 34.18 n 2.16 2.05 2.15 2.23 o 2.88 2.73 2.68 2.59 p 3.54 3.40 3.55 3.31
central miss central miss PB a (+) NR iVTrK PB e (+) NR ivfycP Sc iVcTrk Sc IvFPt At IVFcQSRk T At vfYpHSN P Pf IVaqk TR Pf VY P (-) NR aPGd (-) NR anDek Sc AyPgnde Sc AqNder At LmWPHNDE G At imaWDErk Pf mfwpgnr Pf ner D
central miss central miss
PB j (+) NR G PB k (+) NR wPsE Sc G Sc PEk At qG At PDE Pf G Pf Pder (-) NR IVLMAFYwcQPhsTNdERK (-) NR IVLMfycqGhTNr Sc IVLmAFYqPhsTERK N Sc IVLmFYCQGhtN At iVLmAFYwcPhSTNdeRK Q At IVlFcqGHSNrk MT Pf Ivlmfyqptnek AR Pf ilFycqgN VMT