HAL Id: hal-03041577
https://hal.archives-ouvertes.fr/hal-03041577
Submitted on 6 Jan 2021
HAL is a multi-disciplinary open access
archive for the deposit and dissemination of
sci-entific research documents, whether they are
pub-lished or not. The documents may come from
teaching and research institutions in France or
abroad, or from public or private research centers.
L’archive ouverte pluridisciplinaire HAL, est
destinée au dépôt et à la diffusion de documents
scientifiques de niveau recherche, publiés ou non,
émanant des établissements d’enseignement et de
recherche français ou étrangers, des laboratoires
publics ou privés.
Distributed under a Creative Commons Attribution - NoDerivatives| 4.0 International
to atmospheric dryness
J. Green, J. Berry, P. Ciais, Y. Zhang, P. Gentine
To cite this version:
J. Green, J. Berry, P. Ciais, Y. Zhang, P. Gentine. Amazon rainforest photosynthesis increases in
response to atmospheric dryness. Science Advances , American Association for the Advancement of
Science (AAAS), 2020, 6 (47), pp.eabb7232. �10.1126/sciadv.abb7232�. �hal-03041577�
E N V I R O N M E N T A L S T U D I E S
Amazon rainforest photosynthesis increases
in response to atmospheric dryness
J. K. Green1,2*, J. Berry3†, P. Ciais2†, Y. Zhang1,4†, P. Gentine1,5
Earth system models predict that increases in atmospheric and soil dryness will reduce photosynthesis in the Amazon rainforest, with large implications for the global carbon cycle. Using in situ observations, solar-induced fluorescence, and nonlinear machine learning techniques, we show that, in reality, this is not necessarily the case: In many of the wettest parts of this region, photosynthesis and biomass tend to increase with increased atmo-spheric dryness, despite the associated reductions in canopy conductance to CO2. These results can be largely explained by changes in canopy properties, specifically, new leaves flushed during the dry season have higher photosynthetic capacity than the leaves they replace, compensating for the negative stomatal response to in-creased dryness. As atmospheric dryness will increase with climate change, our study highlights the importance of reframing how we represent the response of ecosystem photosynthesis to atmospheric dryness in very wet regions, to accurately quantify the land carbon sink.
INTRODUCTION
Land surface models, as used in Earth system models (ESMs), assume static vegetation biogeochemistry during periods of stress. They em-pirically represent vegetation water stress (1, 2) on the basis of the principle that increasing air dryness [vapor pressure deficit (VPD)] and decreasing soil moisture reduce ecosystem conductance (the exchange of gases between the vegetation and the atmosphere) and gross primary production (GPP) (3, 4). This response is well char-acterized: During periods of low soil moisture, most plants partially close their stomata (small pores at the leaf surface), limiting photo-synthesis and transpiration (5) to prevent the risk of cavitation and hydraulic failure (6). Similarly, high levels of VPD also induce sto-matal closure and photosynthesis reduction (3, 5). As a result, mod-eled GPP shows a systematic negative sensitivity to increases in VPD, and positive sensitivity to increases in rainfall (Figs. 1 and 2). In nature, however, it is possible that the convolved dynamical changes in canopy structure and biogeochemistry efficiency may partially or entirely compensate this dryness response originating from a leaf- level understanding.
With global warming, VPD will markedly increase throughout the globe, as saturation water vapor pressure follows an exponential increase with temperature. In addition, relative humidity over con-tinents is expected to decrease (7), further increasing VPD, while changes in soil moisture are substantially smaller (8). It is predicted that during the 21st century, the core of the carbon-rich Amazon rainforest (9) will become warmer, with higher VPD, while there is less consensus on how precipitation regimes will shift (10). As a re-sult, some earlier studies have suggested that the Amazon rainforest may severely dieback by mid-century (11) or is already functioning near its optimal temperature (12, 13), Topt. If and when Topt is
ex-ceeded, photosynthesis rates will likely decline due to reductions in maximum rates of carboxylation (Vcmax) or electron transport rate
(Jmax). Increases in VPD could further limit photosynthesis because
of its reductive effect on stomatal conductance (14). It is believed that the carbon uptake of this large carbon sink would then decrease, thus accelerating the atmospheric CO2 growth rate (15) and global
warming. Accurately predicting the response of GPP to VPD and soil moisture in models is therefore crucial for reliable climate projections.
Despite the urgency to verify that models are correctly simulating the GPP sensitivity of tropical rainforests to rainfall and atmospheric dryness, there are still many unknowns regarding the vegetation re-sponse to changes in water availability. First, data are very sparse and limited in time; tropical rainforests have relatively few flux towers monitoring carbon and water fluxes due to the remoteness of the area and the logistical complications that come with installing and maintaining a site in those harsh conditions. Second, tropical climates and ecosystems are highly biodiverse and heterogeneous (16), and thus, site-level studies may not be representative of larger regions: The relationship between GPP, soil moisture, and atmospheric VPD can vary greatly between sites. Satellite proxies of GPP with full spa-tial and temporal coverage are valuable to characterize those re-gional differences. Yet, while some studies have reported increases in satellite measurements of canopy greenness (17, 18), and other studies have indicated counterintuitive increases in photosynthesis during the dry season (19), it is still unclear whether these results translate to general increases in photosynthesis throughout the basin, whether these increases are connected to dryness in addition to light, and whether increases in GPP would still be observed during periods of drought.
RESULTS
K-means clustering
To evaluate observational GPP sensitivity to water stress in the Amazon rainforest (while overcoming the issues of data availability and site-to-site heterogeneity listed above), we first apply a k-means clustering analysis using 9 years of monthly remote sensing data to group the tropics into functionally and climatically consistent re-gions that share similar controls on photosynthesis in space and time (fig. S1). This allows for each cluster to be analyzed in terms of within-cluster space and time variations, increasing the amount of
1Department of Earth and Environmental Engineering, Columbia University, New York, NY, USA. 2Laboratoire des Sciences du Climat et de l’Environnement (LSCE), Gif-sur-Yvette, France. 3Carnegie Institution for Science, Stanford, CA, USA. 4Department of Earth and Environmental Sciences, Lawrence Berkeley National Laboratory, Berkeley, CA, USA. 5The Earth Institute, Columbia University, New York, NY, USA. *Corresponding author. Email: [email protected]
†These authors contributed equally to this work.
Copyright © 2020 The Authors, some rights reserved; exclusive licensee American Association for the Advancement of Science. No claim to original U.S. Government Works. Distributed under a Creative Commons Attribution NonCommercial License 4.0 (CC BY-NC). on January 6, 2021 http://advances.sciencemag.org/ Downloaded from
data for analysis (thus increasing robustness for nonlinear attribu-tion) and reducing issues of the strong temporal (anti)-correlation between VPD and precipitation present in a single pixel (fig. S2). It allows for the decomposition of the respective contributions of VPD and soil moisture (SM) on a proxy of GPP. The clustering analysis resulted in eight clusters to be analyzed separately and are ordered from wettest (cluster 1) to driest (cluster 8) (fig. S1).
Artificial neural network sensitivity analysis
Machine learning techniques have often been used as predictive tools, but they can also be used, as in this study, to assess the nonlin-ear contributions of input variables to target variables (20). Within each cluster identified by the k-means clustering algorithm above (fig. S1), the nonlinear sensitivity of solar induced fluorescence (SIF; used as a proxy for GPP) to soil moisture, VPD, and radiation is determined using artificial neural networks (ANNs) (Figs. 1 and 2). Although there is one ANN trained upon data per cluster, the sen-sitivity results can be reorganized back into time series of the origi-nal pixels to provide regioorigi-nal maps of sensitivity to each variable. A
similar ANN analysis is applied to the output from 10 ESMs (table S1) to capture whether the observations are representing the same sensitivity of photosynthesis that is represented in the models, al-though simulated GPP is used in lieu of SIF, and SW is used in lieu of PAR.
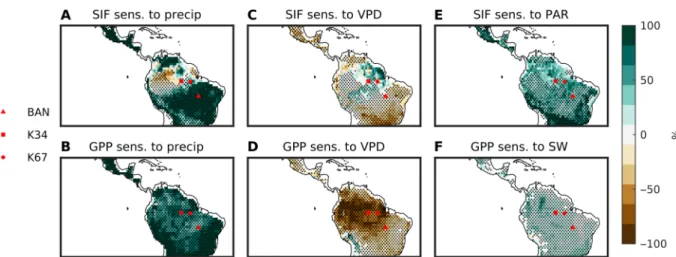
Observational results show that during the dry season (Fig. 1), while photosynthesis (SIF) has a positive sensitivity to precipitation and a negative sensitivity to VPD in tropical savannah and season-ally dry tropical forest regions, this sensitivity is reversed in some of the wet parts of the Amazon basin. That is, in these regions of the Amazon rainforest, photosynthesis tends to decrease with increases in rainfall and stay constant or increase with increases in air dryness. Unlike the absolute wettest regions, these regions have high seasonal variability in precipitation and higher light availability (figs. S3 and S4). Meanwhile, radiation has a positive impact on photosynthesis throughout the entire study area. During the wet season (Fig. 2), the negative sensitivity to precipitation and positive sensitivity to VPD in the wet parts of the basin are even stronger and wider spread, while the positive sensitivity to radiation remains. On the other
Fig. 2. ANN sensitivity analysis results: Wet season. Remote sensing results for the sensitivity of SIF to precipitation (A), VPD (C), and PAR (E). Stippling represents areas of a median r > 0.6. Model results for the sensitivity of GPP to precipitation (B), VPD (D), and surface downwelling shortwave radiation (SW) (F). Stippling represents re-gions where at least 6 of the 10 CMIP5 models agree on the sign of the feedback depicted. Sensitivities represent the percent change in SIF due to a perturbation of each predictor variable by 1 SD. The locations of three flux towers used for further analysis are also shown.
Fig. 1. ANN sensitivity analysis results: Dry season. Remote sensing results for the sensitivity (sens.) of SIF to precipitation (precip) (A), VPD (C), and photosynthetically active radiation (PAR) (E). Stippling represents areas of a median r > 0.6. Model results for the sensitivity of GPP to precipitation (B), VPD (D), and SW (F). Stippling rep-resents regions where at least 6 of the 10 CMIP5 models agree on the sign of the feedback depicted. Sensitivities represent the percent change in SIF due to a perturbation of each predictor variable by 1 SD. The locations of three flux towers used for further analysis are also shown.
on January 6, 2021
http://advances.sciencemag.org/
hand, modeled photosynthesis does not have the same sensitivity in this region. ESMs show that precipitation increases drive thesis upward, while increasing VPD decreases modeled photosyn-thesis throughout the Amazon basin, regardless of the season.
Flux tower analysis
To further examine the mechanisms behind this counterintuitive increase in GPP with decreased rainfall and increased VPD in these wet forests, hourly daytime data from three eddy-covariance flux tower sites in the Amazon rainforest (table S2) (Figs. 3 and 4) are used to look in detail at the relation between GPP, radiation, and ecosystem conductance calculated via Penman-Monteith inversion (21, 22), the estimated ratio of internal leaf to atmospheric CO2
par-tial pressures (ci/ca) (calculated via Fick’s law), VPD, VPD at the
leaf surface (22), and the degree of (de)coupling between the vegeta-tion and the atmosphere (23). Two of the sites [Manaus (K34) and Santarem (K67)] are located in wet regions that show positive SIF sensitivity to VPD and negative sensitivity to precipitation year-round according to our remote sensing analysis, while the third site [Bananal (BAN)] shows this response only in the wet season (Figs. 1 and 2).
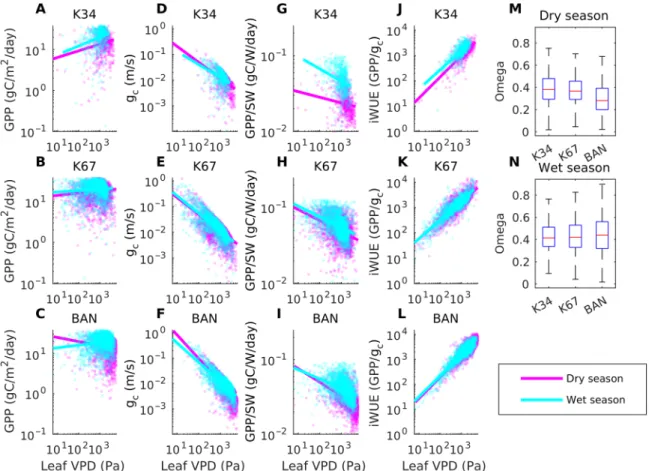
Flux tower results agree with remote sensing observations for the sensitivity of GPP. Unlike models, GPP at the flux sites increases alongside VPD at the leaf surface for all three sites during the wet season and for the two wettest sites in the dry season as well (Fig. 3, A to C). Meanwhile, ecosystem conductance decreases with
increas-ing VPD at all three sites regardless of the season (Fig. 3, D and F), confirming that stomata are always partially closing where the air gets dryer, and GPP normalized by radiation decreases as well with increasing leaf VPD (Fig. 3, G to I). Intrinsic water use efficiency (iWUE) increases at each flux tower site in both seasons (Fig. 3, J to L), and the atmospheric coupling factor, omega, hovers around 0.4 for K67 and K34 throughout the year, indicating a weak cou-pling, while BAN is more coupled to the environment in the dry season (~0.3) (Fig. 3, M and N).
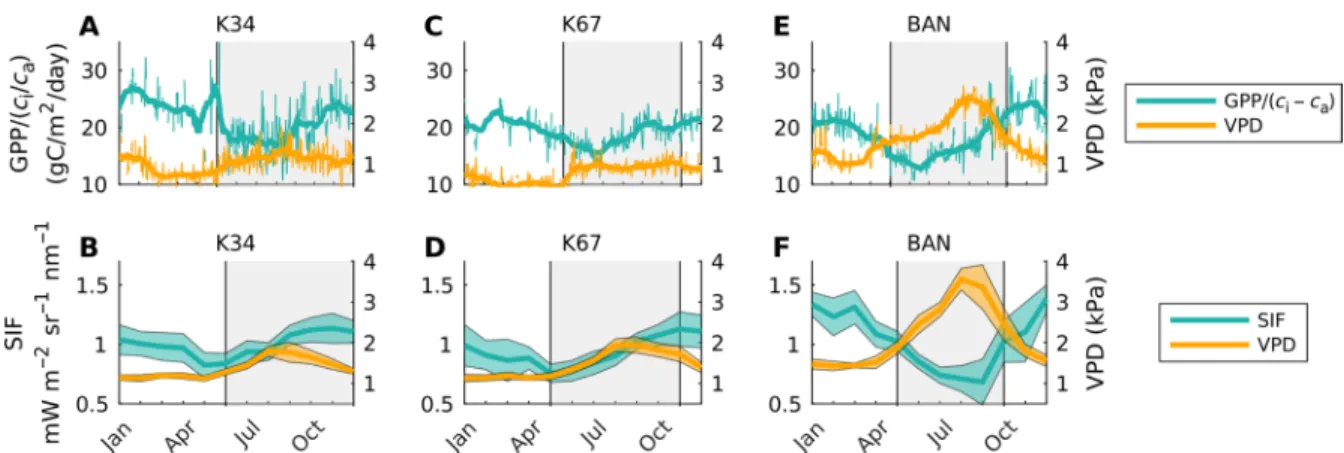
The ratio of GPP to ci/ca, a proxy for photosynthetic
biogeo-chemistry (photosynthetic rates), shows a distinct seasonality at all three sites. It peaks near the end of the dry season and stays elevated during the start of the wet season, emphasizing that photosynthetic biogeochemistry is becoming more efficient during these periods. These changes lag behind changes in VPD (Fig. 4, A, C, and E), and their seasonal cycles have very similar cycles to those of SIF and VPD from remote sensing (Fig. 4, B, D, and F).
DISCUSSION
Observational remote sensing results from the ANN sensitivity analysis confirm previous findings that the wettest, forested regions (fig. S3) of tropical America (the Amazon rainforest) are photosyn-thetically light limited (Figs. 1 and 2) (24–26). This is due to high rainfall rates and frequent cloud coverage, limiting light availability.
Fig. 3. VPD flux tower results. Flux tower data from K34, K67, and BAN in Amazonia showing GPP versus VPD at the leaf surface (leaf VPD) (A to C), ecosystem conduc-tance (gc) versus leaf VPD (D to F), GPP normalized by SW versus leaf VPD (G to I), GPP normalized by ecosystem conductance versus leaf VPD (J to L), and the decou-pling coefficient between ecosystem conductance and transpiration, omega (M and N). Omega ranges from 0 (strong coudecou-pling) to 1 (no coudecou-pling). Hourly daytime data with no precipitation are used for varying time periods between 2002 and 2006 based on data availability.
on January 6, 2021
http://advances.sciencemag.org/
While it is commonly accepted that high VPD decreases GPP (as depicted by the models, Figs. 1D and 2D), observational results show a positive or neutral SIF sensitivity to VPD in a large section of the Amazon rainforest. In the dry season, the strongest positive sensitivity is found in the wet northeastern section of the Amazon (Fig. 1C), a region with not only high levels of mean rainfall but also high seasonal rainfall variability (figs. S3 and S4), while during the wet season, the positive sensitivity expands to include the entire for-ested region (Fig. 2C and fig. S3). Meanwhile, too much precipita-tion can reduce photosynthesis, especially in the wet season (Figs. 1A and 2A), due to decreased CO2 diffusion in wet leaves (27, 28),
in-creased cloud coverage reducing incoming radiation, and the inin-creased prevalence of pathogens (29, 30). Pathogens and fungi, especially certain mildew, thrive in the most humid and wet environments and can devastate foliage (29, 30). On the other hand, periods of high VPD in the wet season dry out the environment, making it less habitable for pathogenic fungi, resulting in healthier, more photo-synthetically efficient leaves, as reflected by the extensive positive sensitivity of SIF to VPD, Fig. 2C. Contrary to these results, models systematically overestimate soil moisture stress on GPP in the Amazon (Figs. 1B and 2B) and show inaccurately that soil dryness is limiting photosynthesis and do not capture the observed pattern of higher VPD being associated with higher GPP (Figs. 1D and 2D). While models capture the positive impact of radiation (Figs. 1F and 2F), it is less strong than in the observations (Figs. 1E and 2E).
The flux tower observations confirm that increases in atmo-spheric dryness increase GPP at all three sites in the wet season and at the two wettest sites in the dry season (Fig. 3, A to C). This is con-sistent with the observational ANN analysis and opposite to the models (Figs. 1 and 2). This positive control of VPD on ecosystem GPP occurs despite the observed negative effect that VPD has on ecosystem conductance (Fig. 3, D to F). Thus, while the stomatal physiological stress response is consistent with the model predic-tions (31), ecosystem GPP continues to increase with VPD, contrary to leaf-level understanding. Dynamic leaf and canopy properties likely explain this behavior, as recently hypothesized to be triggered by radiation and predominantly VPD (32). In wet tropical forests, the beginning of the dry season coincides with the time of year when old leaves (with lower photosynthetic capacity) in the forest canopy are shed, while the understory biomass tends to increase
with increased light availability (33–37). The increased growth and photosynthesis rate of the understory compensate for the upper canopy drop in photosynthesis (from leaf shedding). As the dry sea-son progresses, the old leaves at the top of the canopy are replaced by young leaves that gradually mature to have higher photosynthetic capacity than the old leaves that they replaced. Thus, by the end of the dry season and transition to the wet season, younger mature leaves with higher light use efficiency become prevalent (33–37), increasing the ecosystem rate of photosynthesis (Fig. 4, A, C, and E), despite reductions in stomatal and ecosystem conductance (Fig. 3, D to F).
The varying ecosystem maximum rate of photosynthetic capacity, due to the shift between upper canopy and understory during the dry season, largely explains the seasonality of Amazon rainforest GPP at the site level (33–37). However, these processes are not rep-resented accurately in models (32, 38), contributing to inaccuracies in simulating Amazon rainforest GPP, and thus leading to discrep-ancies between model and observational ANN sensitivity. In one model study, VPD data were used to drive liter fall and canopy phe-nology in the Amazon rainforest, and model accuracy of the carbon cycle and its seasonality in this region greatly improved, even more so than when using radiation to drive canopy phenology (32). There is an upward or neutral trend between photosynthetic efficiency (lagged by 2 months, as this is found to lead to the highest correla-tion) and VPD in observations (fig. S5), further supporting the the-ory that VPD is driving phenological changes. In addition, factors related to canopy structure, such as leaf angle and clumping, which can also affect light availability in the canopy and understory, can also vary, leading to changes in SIF that would not be present in modeled GPP because these processes are simply not included (37).
These phenological changes ignored in most models contribute to the discrepancies between models and observations, but there are other biophysical mechanisms that could also contribute to the pos-itive SIF sensitivity to VPD and negative sensitivity to precipitation. For one, increased light availability in a radiation-limited environ-ment (also warms up the leaves, increasing VPD) can also contrib-ute to GPP increases with VPD (Fig. 3, G to I). Another factor may be vegetation-atmosphere decoupling. During both dry and wet seasons, the wet forests are not strongly coupled to the atmosphere (Fig. 3, M and N). In such less-coupled systems, the aerodynamic
Fig. 4. Flux tower climatology. Flux tower data from three sites (K34, K67, and BAN) in Amazonia showing the mean climatology of GPP normalized by the ratio of leaf internal CO2 partial pressure (ci) to atmospheric CO2 partial pressure (ca) (A, C, and E). Remote sensing data for these same three sites showing the mean climatology of SIF and VPD (B, D, and F). Daytime data (averaged from hourly data with no precipitation) are used for varying time periods between 2002 and 2006 based on data avail-ability for the flux tower data. For remote sensing data, monthly data from June 2007 to May 2016 are used.
on January 6, 2021
http://advances.sciencemag.org/
conductance (i.e., turbulence) in addition to the stomatal conduc-tance limits the exchange of CO2 and water vapor between canopy
leaves and the atmosphere. The implication is that an increase in VPD may strongly reduce the stomatal conductance while not ducing GPP to the same extent, thus having a smaller effect on re-ducing transpiration and iWUE (Fig. 3, J to L). Thus, even when atmospheric VPD is elevated, which often co-occurs with elevated temperatures, wet tropical forests in the Amazon may improve their photosynthesis by keeping transpiration and evaporative cooling rates high (39). A high transpiration rate helps mitigate the rise in VPD at the leaf surface and regulate leaf temperatures (40, 41), which could otherwise be pushed above Topt by the increased
short-wave radiation.
Last, the positive sensitivity of GPP to VPD observed at flux tow-ers (Fig. 3, A and B) and confirmed by remote sensing data in wet regions of the Amazon rainforest may also be contributed by the evaporation of morning dew [the SIF data are retrieved at 9:30 a.m. local time (42)] as well as by the evaporation of water droplets from leaves after rain events, which both impede photosynthesis when VPD is very low by slowing carbon diffusion (27, 28) and making vegetation more susceptible to fungi (29, 30). It has been shown that during light precipitation events, canopy interception can be up to 60% of total rainfall in tropical rainforests (43), and evaporation from intercepted canopy water in the tropics can represent up to 15% of total evapotranspiration (ET) (44). However, it should be noted that the evaporation of morning dew is not a major explanation for these results, as a separate analysis using contiguous SIF (45), a dataset based on a satellite observations at 1:30 p.m. (when VPD is higher), also reveals similar sensitivity to the morning time SIF. In contrast, models overestimate water stress due to both soil moisture and VPD as they include an incomplete representation of vegetation access to soil water via deep roots and do not include a physical representa-tion of water stress based on plant hydraulics, which more realisti-cally couples water stresses in the soil and atmosphere (VPD) (46).
On the basis of our results, the current modeled vulnerability of the Amazonian rainforest photosynthesis to increased air dryness appears to be overestimated, in part because models do not include dynamic vegetation biogeochemistry and, therefore, are too negatively sensitive to VPD and soil moisture. These findings also suggest that this region could be more resilient to changes in the baseline cli-mate from clicli-mate change (for instance, a slightly warmer environ-ment with drier air) than previously thought. Nevertheless, it should be noted that our observational results show an “average” sensitivity, and when we look explicitly at extreme events, which are expected to become stronger and more frequent (47), the positive sensitivity to VPD in the Amazon rainforest does decrease or reverse (fig. S6). In addition, the data do not yet include atmospheric VPD levels as extreme as predicted for climate change in the coming century. If VPD increases more markedly, demonstrated by an ANN perturba-tion of 2 SDs rather than 1 (figs. S7 and S8), the positive sensitivity of SIF to VPD during the dry season could change sign (fig. S7C). This will depend on the interplay between ecosystem phenology/ biochemistry and physiology/biophysics. The latter is fairly well un-derstood; the former is yet to be properly represented in models.
In addition, vegetation growth could decrease with increasing temperature (48, 49) due to increased respiration cost in tropical forests, and mortality could increase due to increased hydraulic fail-ure, especially for taller trees (50). These forests are acclimated to function only within a narrow range of temperature, which may be
exceeded even within the century. Therefore, because of the poten-tial for interacting disturbance effects resulting from increased at-mospheric dryness (i.e., increases in fire frequency) and a lack of site-level studies with imposed elevated VPD, it is still uncertain to deduce from current observations how the Amazon rainforests will fare as the 21st century progresses. Thus, in situ experiments with imposed high levels of VPD could be as important as experiments complementing the elevated atmospheric CO2 concentrations (51)
in increasing our knowledge of our future carbon and water cycles in the Amazon.
Our results show that land surface models used for climate pro-jections are overestimating atmospheric water stress in the tropical rainforests due in large part to the absence of dynamic vegetation biogeochemistry, thus misrepresenting the carbon uptake of these carbon-rich forests. It is possible that other factors could also be contributing to this discrepancy, such as incorrect parameterization of photosynthesis, an incomplete representation of plant hydraulics and deep rooting systems, or incorrectly representing climato-logical patterns such as rainfall and cloud coverage. Meanwhile, the observational results presented here show that increases in atmo-spheric dryness in the Amazon rainforest do not currently reduce GPP in the wettest tropical forests as previously thought; instead, they are correlated with a significant increase in photosynthesis, and not simply canopy greenness. These findings support the hypoth-esis that the positive effects of young, photosynthetically efficient leaves at different layers of the canopy combined with the cooling effect of transpiration on leaf temperature, the evaporation of water droplets on leaf surfaces, the reduction in the prevalence of fungi and pathogens, and the increase in radiation are more than able to compensate for the losses in GPP due to atmospheric (VPD) and soil moisture stress. On the other hand, ESMs are not capturing this VPD response, which has implications for projections of future hydro-logical and carbon cycles. We stress the importance of accurately modeling vegetation phenology, the seasonality in the photosynthetic capacity of forests, and the coupling between the vegetation and the atmosphere to reduce uncertainty in our climate projections. MATERIALS AND METHODS
K-means clustering
To group tropical regions into areas that share similar environmental characteristics to be analyzed independently, a k-means clustering analysis is used (fig. S1). Although the focus of this study is the tropics of South and Central America, the clustering was performed across the entirety of the tropics spanning Africa and Asia as well. We use 9 years of input data (June 2007 to May 2016) including precipita-tion from the Global Precipitaprecipita-tion Climatology Project (GPCP) (52), atmospheric VPD calculated from Atmospheric Infrared Sounder (AIRS) humidity and temperature (53), PAR from Clouds and the Earth’s Radiant Energy System (CERES) (54), temperature from ERA- Interim (55), and SIF (used as a proxy of GPP) from the Global Ozone Monitoring Experiment-2 (GOME-2) processed by NASA (42). Unlike vegetation optical indices, SIF is mechanistically linked to photo-synthesis, does not saturate in the tropics, and has been shown to have a near-linear relationship with ecosystem GPP at the monthly scale (56). Recent studies indicate that SIF is highly sensitive to can-opy structure and leaf display (57) and that this underlies, in part, the strong correlation between SIF and GPP (37). This also makes it possible both to identify the impact of droughts on GPP (58) and
on January 6, 2021
http://advances.sciencemag.org/
to determine the sensitivity of GPP to factors that would contribute to a canopy renewal hypothesis in the Amazon rainforest. All data are brought from their native resolution to a 1° by 1° resolution be-fore the analysis, and a monthly temporal resolution. The SIF data are averaged with the eight adjacent pixels surrounding the pixel of interest to smooth the dataset, which is inherently noisy. Although it is known that there has been GOME-2 SIF sensor degradation, here we assess seasonal to subseasonal scale responses, and thus, an interannual trend should not contribute to our findings.
For each pixel location, two inputs are used per each of the five datasets (to equal 10 predictors total) to represent both the mean value of each variable as well as its variability (both temporally and spatially). We use (i) the temporal mean minus the spatial tropic wide mean, divided by the temporal SD, and (ii) the temporal SD minus the spatial mean of the temporal SDs, divided by the SD of the temporal SDs.
Artificial neural networks
Within each cluster per the Americas, an ensemble of 10 ANNs per cluster is used (results were averaged for the 10 members) to disen-tangle the effects of environmental variables on the smoothed SIF and to account for nonlinearities. On the basis of tradeoff between model performance and overfitting, the models are initialized with five nodes and three hidden layers, while 60% of the data are used for the purpose of training the ANNs. ANNs are chosen for this application because they have nonlinear activation functions, which can effectively predict nonlinear effects and go beyond a simple light use efficiency model.
Each ANN uses monthly precipitation data from the GPCP (52), VPD calculated from AIRS (53), and PAR data from CERES (54) for all months between June 2007 and May 2016, as well as canopy height (16) and average Fraction of Absorbed Photosynthetic Ac-tive Radiation (FPAR) (45) per pixel as predictor variables. Smoothed monthly SIF (42) from June 2007 to May 2016 is used as a response variable. Because we are interested in the effects of soil moisture but are limited by the depth of measurement of microwave observations over the study period (a lack of remotely sensed root-zone soil mois-ture data), especially in dense tropical forests, precipitation data at different monthly lags are used instead. As additional predictor vari-ables, precipitation data 2 and 4 months ahead of the other datasets were used to incorporate memory in the system of earlier rainfall. We choose 2- and 4-month lags based on Humphrey et al. (59), where it was established that the Gravity Recovery and Climate Experiment (GRACE) terrestrial water storage has the highest correlation with precipitation data in the tropics for periods varying between 1 and 4 months. This is also confirmed using monthly in situ soil moisture profile and precipitation data from BAN, the only Amazonian flux tower site with soil moisture data publicly available and which displays a 2-month lag (fig. S9). Adding the lagged precipitation data improves model performance demonstrated by increases in r values. All datasets are normalized by the cluster mean and SD before run-ning the models.
Analyses are also performed with the addition of near-surface air temperature as a predictor variable, but r values do not improve and so these data were excluded from the analysis. As an additional check, analyses are also performed using the near-surface air tem-perature in lieu of VPD, but this degrades model performance throughout the study area, reducing r values by an average value of 0.1, showing that the sensitivity to VPD is not simply the response
of vegetation to temperature but that it provides additional predic-tive power. Performance is verified with r values and time series plots for locations within each cluster. This analysis was also per-formed using the contiguous SIF data (45) based on MODIS 1:30 p.m. overpass with very similar results.
Observational sensitivity analysis
A sensitivity analysis is used to understand the contribution of each predictor variable to the SIF signal. For each of the 10 trained ANNs for each cluster, one of the predictor variables is perturbed by 1 SD (a value of 1 due to the initial input data normalization), and SIF is predicted again using the existing ANN with the predictors including the perturbed variable; this process is repeated for each predictor variable. Although this process is run per cluster, the predictions with the ANN trained within each cluster can then be produced back into the time series of their original pixel locations, and the predicted SIF with the perturbation can be compared to the SIF with the unperturbed model and observations to determine the sen-sitivity values per pixel. A sample equation showing the calculation of the percent of variability in SIF that is explained by precipitation is shown (Eq. 1)
100 × mean( SIF (ANN precip+absval(stdev(precip)) ) − SIF (ANN all VAR) )
─────────────────────────────── stdev( SIF
OBS )
(1) Because each of the trial ANNs will provide slightly different re-sults, this analysis is performed for each trial, and median values are displayed and analyzed in this study to increase the robustness of the results (Figs. 1 and 2). Stippling in these figures for the observa-tional results represents regions that have a median r > 0.6. While figures displaying dry and wet season sensitivity are displayed (Figs. 1 and 2, and figs. S6 to S8), ANNs are run using the full year of data. Results are then divided into their corresponding dry and wet season figures for each pixel individually, by first calculating the pixel precipitation climatology, and then designating consecutive months greater than the mean value as the wet season, and consec-utive months below the mean value as the dry season.
To determine whether these results would differ during an extreme event, the sensitivity during the dry season of 2015 (a strong El Niño) is compared to the sensitivity of a nonanomalous year (2014) (fig. S6). To see whether these results would differ with larger perturbations, a second analysis using 2 SDs is also performed (figs. S7 and S8).
CMIP5 sensitivity analysis
Following the observational analysis, a similar analysis is carried out for a suite of CMIP5 models (bcc-csm1-1, CanESM2, CCSM4, CESM1-BGC, GFDL-ESM2M, inmcm4, IPSL-CM5A-LR, MIROC- ESM, MRI-ESM1, and NorESM1-M) (table S1) with GPP in place of SIF, leaf area index (LAI) in place of FPAR, incoming SW in place of PAR, precipitation, and calculated VPD (from temperature and rel-ative humidity) for the past 30 years of the CMIP5 historical run (1976–2005). Similar to the observational analysis, for each model, a k-means clustering analysis is first performed before creating ANNs for each cluster per continent with predictor variables normalized by their means and SDs. Sensitivity analyses are also performed, where each predictor variable is perturbed by 1 SD (a value of 1). Unlike the observational analysis, only one set of ANNs is used for each model, and instead, the median of the 10 model results is compared
on January 6, 2021
http://advances.sciencemag.org/
with the observational data results (Figs. 1 and 2). The wet and dry seasons for each of the models’ pixels are determined based on the climatology of each one’s individual precipitation dataset, where consecutive months above the mean climatology were nated as the wet season, and consecutive months below were desig-nated as the dry season. Stippling in these figures represents regions where at least 6 of the 10 ESMs agree on the sign of the sensitivity displayed.
Flux tower analysis
Flux tower data from three tropical forest sites (19, 60, 61) (table S2) in Brazil are used to confirm the sensitivity of GPP to VPD that is seen in the rainforest in the observational results (Figs. 1 and 2). Using the available hourly data between 2002 and 2006 (there are data gaps for each tower; table S2), ecosystem conductance, gs = 1/rc,
is obtained by inverting the Penman-Monteith equation (Eq. 2) (21, 22) and solving for the reciprocal of canopy resistance
LE = ∆_ ( R n − G ) + L v _ r a q ─ 1 + ∆_ + r _ r ca (2)
where LE is the latent heat flux, is the saturated vapor pressure as a function of temperature, is the psychometric constant, Rn is net
radiation, G is the ground heat flux, is the density of the moist air,
Lv is the latent heat of vaporization, ra is the aerodynamic resistance
to evaporation due to turbulent transport, q is the specific hu-midity deficit, and rc is the ecosystem resistance. The resistance to
evaporation due to turbulent transport (ra) is calculated following
Novick et al. (62) (Eq. 3), using the von Karman constant (K = 0.4) available wind speed data (U), measurement height (zm), as well as
the momentum roughness length (zo = 0.1h) and zero plane
dis-placement (zd = 0.67h), both based on calculated canopy height (h)
from near neutral conditions (Eq. 4) (63). Hours with a friction ve-locity (u*) <0.2 are not used, nor were hours with precipitation
r a = ln ( z m − z d _ z o ) 2 ─ U × k 2 (3) h = ──────────── z m 0.6 + 0.1 × exp ( k * u_ U * ) (4)
VPD of the leaf surface (the difference in vapor pressure inside the leaf stomata versus the vapor pressure of the leaf boundary layer) is used in lieu of atmospheric VPD because it acts more directly as the stressor of stomata and is thus more ecologically relevant for plant response (64). To obtain an estimate of the VPD at the leaf surface, Eq. 5 is used, utilizing rc obtained from the inverted Penman-
Monteith equation and the observed latent heat flux (assuming that soil evaporation is small—a fair assumption in those dense tropical forests). Leaf-level VPD can vary from atmospheric VPD because of aerodynamic coupling and acts more directly as the stressor of stomata; thus, it is more ecologically relevant for plant response and strongly influenced by radiation (64)
VPD l = ─LE c p _ r 1c
(5)
To assess the coupling between ecosystem conductance and evapo-transpiration, a decoupling constant, omega, developed by Jarvis
and McNaughton (23) is calculated (Eq. 6). Omega values range from 0 to 1 and characterize the degree of coupling between ecosys-tem conductance and transpiration, with values of 0 representing high degree of coupling with the atmosphere, and values of 1 repre-senting complete decoupling
= ─1 + ∆_
1 + ∆_ + ( r _c
r a )
(6)
The rate of photosynthetic assimilation can be related to stomatal conductance and plant biogeochemistry (Eq. 7) via Fick’s law, where
ci is the internal leaf CO2 partial pressure, ca is the atmospheric CO2
partial pressure, and rco2 is the ecosystem resistance to CO2 (1.6rc)
GPP = ─1
( r co2 + r a ) ( c a − c i ) (7)
To evaluate changes in biogeochemistry at the flux tower sites, the ratio of ci to ca, ci:ca, is calculated (Eq. 8), where H2O is the
den-sity of water. GPP normalized by this quantity is indicative of changes in leaf photosynthetic traits (Vcmax as well as the electron transport
rate, Jmax). We note that ci here is an estimate at the ecosystem scale
and should not directly be compared to leaf-level values c i
─
c a = 1 − ─GPP.( r c a . H2Oa + r co2 ) (8)
SUPPLEMENTARY MATERIALS
Supplementary material for this article is available at http://advances.sciencemag.org/cgi/ content/full/6/47/eabb7232/DC1
REFERENCES AND NOTES
1. J. T. Ball, I. E. Woodrow, J. A. Berry, A model predicting stomata conductance and its contribution to the control of photosynthesis under different environmental conditions, in Progress in Photosynthesis Research, J. Biggins, Ed. (Springer, 1987), pp. 221-224. 2. G. B. Bonan, M. Williams, R. A. Fisher, K. W. Oleson, Modeling stomatal conductance
in the earth system: Linking leaf water-use efficiency and water transport along the soil-plant-atmosphere continuum. Geosci. Model Dev. 7, 2193–2222 (2014). 3. G. D. Farquhar, I. R. Cowan, in Integration of Activity in the Higher Plant, D. H. Jennings, Ed.
(Cambridge Univ. Press, Cambridge, 1977), pp. 471–505.
4. Y.-S. Lin, B. E. Medlyn, R. A. Duursma, I. C. Prentice, H. Wang, S. Baig, D. Eamus, V. R. de Dios, P. Mitchell, D. S. Ellsworth, M. O. de Beeck, G. Wallin, J. Uddling, L. Tarvainen, M.-L. Linderson, L. A. Cernusak, J. B. Nippert, T. W. Ocheltree, D. T. Tissue,
N. K. Martin-St Paul, A. Rogers, J. M. Warren, P. De Angelis, K. Hikosaka, Q. Han, Y. Onoda, T. E. Gimeno, C. V. M. Barton, J. Bennie, D. Bonal, A. Bosc, M. Löw, C. Macinins-Ng, A. Rey, L. Rowland, S. A. Setterfield, S. Tausz-Posch, J. Zaragoza-Castells, M. S. J. Broadmeadow, J. E. Drake, M. Freeman, O. Ghannoum, L. B. Hutley, J. W. Kelly, K. Kikuzawa, P. Kolari, K. Koyama, J.-M. Limousin, P. Meir, A. C. Lola da Costa, T. N. Mikkelsen, N. Salinas, W. Sun, L. Wingate, Optimal stomatal behaviour around the world. Nat. Clim. Chang. 5, 459–464 (2015).
5. A. G. Konings, P. Gentine, Global variations in ecosystem-scale isohydricity. Glob. Chang.
Biol. 23, 891–905 (2017).
6. J. S. Sperry, D. M. Love, What plant hydraulics can tell us about responses to climate-change droughts. New Phytol. 207, 14–27 (2015).
7. M. P. Byrne, P. A. O’Gorman, Understanding decreases in land relative humidity with global warming: Conceptual model and GCM simulations. J. Climate 29, 9045–9061 (2016).
8. P. Greve, B. Orlowsky, B. Mueller, J. Sheffield, M. Reichstein, S. I. Seneviratne, Global assessment of trends in wetting and drying over land. Nat. Geosci. 7, 716–721 (2014). 9. M. Zhao, S. W. Running, Drought-induced reduction in global terrestrial net primary
production from 2000 through 2009. Science 329, 940–943 (2010).
on January 6, 2021
http://advances.sciencemag.org/
10. Y. Malhi, J. T. Roberts, R. A. Betts, T. J. Killeen, W. Li, C. A. Nobre, Climate change, deforestation, and the fate of the Amazon. Science 319, 169–172 (2008).
11. P. M. Cox, R. A. Betts, M. Collins, P. P. Harris, C. Huntingford, C. D. Jones, Amazonian forest dieback under climate-carbon cycle projections for the 21st century. Theor. Appl. Climatol. 78, 137–156 (2004).
12. C. E. Doughty, M. L. Goulden, Are tropical forests near a high temperature threshold?
J. Geophys. Res. Biogeosci. 114, 1–12 (2009).
13. M. Huang, S. Piao, P. Ciais, J. Peñuelas, X. Wang, T. F. Keenan, S. Peng, J. A. Berry, K. Wang, J. Mao, R. Alkama, A. Cescatti, M. Cuntz, H. De Deurwaerder, M. Gao, Y. He, Y. Liu, Y. Luo, R. B. Myneni, S. Niu, X. Shi, W. Yuan, H. Verbeeck, T. Wang, J. Wu, I. A. Janssens, Air temperature optima of vegetation productivity across global biomes. Nat. Ecol. Evol. 3, 772–779 (2019).
14. D. P. Kumarathunge, B. E. Medlyn, J. E. Drake, M. G. Tjoelker, M. J. Aspinwall, M. Battaglia, F. J. Cano, K. R. Carter, M. A. Cavaleri, L. A. Cernusak, J. Q. Chambers, K. Y. Crous, M. G. De Kauwe, D. N. Dillaway, E. Dreyer, D. S. Ellsworth, O. Ghannoum, Q. Han, K. Hikosaka, A. M. Jensen, J. W. G. Kelly, E. L. Kruger, L. M. Mercado, Y. Onoda, P. B. Reich, A. Rogers, M. Slot, N. G. Smith, L. Tarvainen, D. T. Tissue, H. F. Togashi, E. S. Tribuzy, J. Uddling, A. Vårhammar, G. Wallin, J. M. Warren, D. A. Way, Acclimation and adaptation components of the temperature dependence of plant photosynthesis at the global scale.
New Phytol. 222, 768–784 (2019).
15. O. L. Phillips, L. E. O. C. Aragão, S. L. Lewis, J. B. Fisher, J. Lloyd, G. López-González, Y. Malhi, A. Monteagudo, J. Peacock, C. A. Quesada, G. van der Heijden, S. Almeida, I. Amaral, L. Arroyo, G. Aymard, T. R. Baker, O. Bánki, L. Blanc, D. Bonal, P. Brando, J. Chave, Á. C. A. de Oliveira, N. D. Cardozo, C. I. Czimczik, T. R. Feldpausch, M. A. Freitas, E. Gloor, N. Higuchi, E. Jiménez, G. Lloyd, P. Meir, C. Mendoza, A. Morel, D. A. Neill, D. Nepstad, S. Patiño, M. C. Peñuela, A. Prieto, F. Ramírez, M. Schwarz, J. Silva, M. Silveira, A. S. Thomas, H. ter Steege, J. Stropp, R. Vásquez, P. Zelazowski, E. A. Dávila, S. Andelman, A. Andrade, K.-J. Chao, T. Erwin, A. D. Fiore, E. Honorio C, H. Keeling, T. J. Killeen, W. F. Laurance, A. P. Cruz, N. C. A. Pitman, P. N. Vargas, H. Ramírez-Angulo, A. Rudas, R. Salamão, N. Silva, J. Terborgh, A. Torres-Lezama, Drought sensitivity of the amazon rainforest. Science 323, 1344–1347 (2009).
16. M. Simard, N. Pinto, J. B. Fisher, A. Baccini, Mapping forest canopy height globally with spaceborne lidar. J. Geophys. Res. 116, G04021 (2011).
17. S. R. Saleska, J. Wu, K. Guan, A. C. Araujo, A. Huete, A. D. Nobre, N. Restrepo-Coupe, Dry-season greening of Amazon forests. Nature 531, E4–E5 (2016).
18. R. Doughty, P. Köhler, C. Frankenberg, T. S. Magney, X. Xiao, Y. Qin, X. Wu, B. Moore III, TROPOMI reveals dry-season increase of solar-induced chlorophyll fluorescence in the Amazon forest. Proc. Natl. Acad. Sci. U.S.A. 116, 22393–22398 (2019).
19. N. Restrepo-Coupe, H. R. da Rocha, L. R. Hutyra, A. C. da Araujo, L. S. Borma, B. Christoffersen, O. M. R. Cabral, P. B. de Camargo, F. L. Cardoso, A. C. Lolada Costa, D. R. Fitzjarrald, M. L. Goulden, B. Kruijt, J. M. F. Maia, Y. S. Malhi, A. O. Manzi, S. D. Miller, A. D. Nobre, C. Randow, L. D. Abreu Sá, R. K. Sakai, J. Tota, S. C. Wofsy, F. B. Zanchi, S. R. Saleska, What drives the seasonality of photosynthesis across the Amazon basin? A cross-site analysis of eddy flux tower measurements from the Brasil flux network.
Agric. For. Meteorol. 182–183, 128–144 (2013).
20. M. Paliwal, U. A. Kumar, Assessing the contribution of variables in feed forward neural network. Appl. Soft Comput. 11, 3690–3696 (2011).
21. H. L. Penman, Natural evaporation from open water, bare soil and grass. Proc. R. Soc.
A. Math. Phys. Sci. 193, 120–145 (1948).
22. J. L. Monteith, Evaporation and environment. Symp. Soc. Exp. Biol. 19, 205–234 (1965). 23. P. G. Jarvis, K. G. McNaughton, Stomatal control of transpiration: Scaling up from leaf
to region. Adv. Ecol. Res. 15, 1–49 (1986).
24. A. R. Huete, K. Didan, Y. E. Shimabukuro, P. Ratana, S. R. Saleska, L. R. Hutyra, W. Yang, R. R. Nemani, R. Myneni, Amazon rainforests green-up with sunlight in dry season.
Geophys. Res. Lett. 33, L06405 (2006).
25. R. R. Nemani, C. D. Keeling, H. Hashimoto, W. M. Jolly, S. C. Piper, C. J. Tucker, R. B. Myneni, S. W. Running, Climate-driven increases in global terrestrial net primary production from 1982 to 1999. Science 300, 1560–1563 (2003).
26. S. R. Saleska, K. Didan, A. R. Huete, H. R. Da Rocha, Amazon forests green-up during 2005 drought. Science 318, 612 (2007).
27. M. Ishibashi, I. Terashima, Effects of continuous leaf wetness on photosynthesis: Adverse aspects of rainfall. Plant Cell Environ. 18, 431–438 (1995).
28. M. G. Letts, M. Mulligan, The impact of light quality and leaf wetness on photosynthesis in north-west Andean tropical montane cloud forest. J. Trop. Ecol. 21, 549–557 (2005). 29. M. R. Speight, S. Woodward, Pest management in tropical forestry, in Tropical Forestry
Handbook, L. Pancel, M. Köhl, Eds. (Springer, Berlin, Heidelberg, 2015).
30. P. Holiday, Fungus diseases of tropical crops. Australas. Plant Pathol. 9, 120 (1980). 31. G. Katul, S. Manzoni, S. Palmroth, R. Oren, A stomatal optimization theory to describe
the effects of atmospheric CO2 on leaf photosynthesis and transpiration. Ann. Bot. 105,
431–442 (2010).
32. X. Chen, F. Maignan, N. Viovy, A. Bastos, D. Goll, J. Wu, L. Liu, C. Yue, S. Peng, W. Yuan, A. C. da Conceição, M. O’Sullivan, P. Ciais, Novel representation of leaf phenology
improves simulation of Amazonian evergreen forest photosynthesis in a land surface model. J. Adv. Model. Earth Syst. 12, e2018MS001565 (2020).
33. J. Wu, L. P. Albert, A. P. Lopes, N. Restrepo-Coupe, M. Hayek, K. T. Wiedemann, K. Guan, S. C. Stark, B. Christoffersen, N. Prohaska, J. V. Tavares, S. Marostica, H. Kobayashi, M. L. Ferreira, K. S. Campos, R. da Silva, P. M. Brando, D. G. Dye, T. E. Huxman, A. R. Huete, B. W. Nelson, S. R. Saleska, Leaf development and demography explain photosynthetic seasonality in Amazon evergreen forests. Science 351, 972–976 (2016).
34. L. P. Albert, J. Wu, N. Prohaska, P. B. de Camargo, T. E. Huxman, E. S. Tribuzy, V. Y. Ivanov, R. S. Oliveira, S. Garcia, M. N. Smith, R. C. O. Junior, N. Restrepo-Coupe, R. da Silva, S. C. Stark, G. A. Martins, D. V. Penha, S. R. Saleska, Age-dependent leaf physiology and consequences for crown-scale carbon uptake during the dry season in an Amazon evergreen forest. New Phytol. 219, 870–884 (2018).
35. A. P. Lopes, B. W. Nelson, J. Wu, P. M. L. de Alencastro Graça, J. V. Tavares, N. Prohaska, G. A. Martins, S. R. Saleska, Leaf flush drives dry season green-up of the Central Amazon.
Remote Sens. Environ. 182, 90–98 (2016).
36. H. Tang, R. Dubayah, Light-driven growth in Amazon evergreen forests explained by seasonal variations of vertical canopy structure. Proc. Natl. Acad. Sci. U.S.A. 114, 2640–2644 (2017).
37. B. Dechant, Y. Ryu, G. Badgley, Y. Zeng, J. A. Berry, Y. Zhang, Y. Goulas, Z. Li, Q. Zhang, M. Kang, J. Li, I. Moya, Canopy structure explains the relationship between
photosynthesis and sun-induced chlorophyll fluorescence in crops. Remote Sens. Environ. 241, 111733 (2020).
38. N. Restrepo-Coupe, N. M. Levine, B. O. Christoffersen, L. P. Albert, J. Wu, M. H. Costa, D. Galbraith, H. Imbuzeiro, G. Martins, A. C. da Araujo, Y. S. Malhi, X. Zeng, P. Moorcroft, S. R. Saleska, Do dynamic global vegetation models capture the seasonality of carbon fluxes in the Amazon basin? A data-model intercomparison. Glob. Chang. Biol. 23, 191–208 (2017).
39. B. Choat, S. Jansen, T. J. Brodribb, H. Cochard, S. Delzon, R. Bhaskar, S. J. Bucci, T. S. Feild, S. M. Gleason, U. G. Hacke, A. L. Jacobsen, F. Lens, H. Maherali, J. Martínez-Vilalta, S. Mayr, M. Mencuccini, P. J. Mitchell, A. Nardini, J. Pittermann, R. B. Pratt, J. S. Sperry, M. Westoby, I. J. Wright, A. E. Zanne, Global convergence in the vulnerability of forests to drought.
Nature 491, 752–755 (2012).
40. J. Urban, M. W. Ingwers, M. A. McGuire, R. O. Teskey, Increase in leaf temperature opens stomata and decouples net photosynthesis from stomatal conductance in Pinus taeda and Populus deltoides x nigra. J. Exp. Bot. 68, 1757–1767 (2017).
41. A. J. Crawford, D. H. McLachlan, A. M. Hetherington, K. A. Franklin, High temperature exposure increases plant cooling capacity. Curr. Biol. 22, R396–R397 (2012).
42. J. Joiner, L. Guanter, R. Lindstrot, M. Voigt, A. P. Vasilkov, E. M. Middleton, K. F. Huemmrich, Y. Yoshida, C. Frankenberg, Global monitoring of terrestrial chlorophyll fluorescence from moderate spectral resolution near-infrared satellite measurements: Methodology, simulations, and application to GOME-2. Atmos. Meas. Tech. 6, 3883–3930 (2013). 43. M. Schneebeli, S. Wolf, N. Kunert, W. Eugster, C. Mätzler, Relating the X-band opacity
of a tropical tree canopy to sapflow, rain interception and dew formation. Remote Sens.
Environ. 115, 2116–2125 (2011).
44. D. G. Miralles, J. H. Gash, T. R. H. Holmes, R. A. M. de Jeu, A. J. Dolman, Global canopy interception from satellite observations. J. Geophys. Res. Atmos. 115, D16122 (2010). 45. Y. Zhang, J. Joiner, S. H. Alemohammad, S. Zhou, P. Gentine, A global spatially continuous
solar induced fluorescence (CSIF) dataset using neural networks. Biogeosciences 15, 5779–5800 (2018).
46. D. Kennedy, S. Swenson, K. W. Oleson, D. M. Lawrence, R. Fisher, A. C. Lola da Costa, P. Gentine, Implementing plant hydraulics in the community land model, Version 5.
J. Adv. Model. Earth Syst. 11, 485–513 (2019).
47. W. Cai, S. Borlace, M. Lengaigne, P. van Rensch, M. Collins, G. Vecchi, A. Timmermann, A. Santoso, M. J. McPhaden, L. Wu, M. H. England, G. Wang, E. Guilyardi, F.-F. Jin, Increasing frequency of extreme El Niño events due to greenhouse warming. Nat. Clim.
Chang. 4, 111–116 (2014).
48. R. J. W. Brienen, J. Schöngart, P. A. Zuidema, in Tropical Tree Physiology, G. Goldstein, L. Santiago, Eds. (Springer International Publishing, Switzerland, 2016), pp. 439–461. 49. J. Huang, H. Yu, A. Dai, Y. Wei, L. Kang, Drylands face potential threat under 2°C global
warming target. Nat. Clim. Chang. 7, 417–422 (2017).
50. L. Rowland, A. C. L. Da Costa, D. R. Galbraith, R. S. Oliveira, O. J. Binks, A. A. R. Oliveira, A. M. Pullen, C. E. Doughty, D. B. Metcalfe, S. S. Vasconcelos, L. V. Ferreira, Y. Malhi, J. Grace, M. Mencuccini, P. Meir, Death from drought in tropical forests is triggered by hydraulics not carbon starvation. Nature 528, 119–122 (2015).
51. S. P. Long, E. A. Ainsworth, A. Rogers, D. R. Ort, Rising atmospheric carbon dioxide: Plants FACE the future. Annu. Rev. Plant Biol. 55, 591–628 (2004).
52. G. J. Huffman, R. F. Adler, M. M. Morrissey, D. T. Bolvin, S. Curtis, R. Joyce, B. McGavock, J. Susskind, Global precipitation at one-degree daily resolution from multisatellite observations. J. Hydrometeorol. 2, 36–50 (2001).
53. A. S. T. Teixeira, AIRS/Aqua L3 Monthly Standard Physical Retrieval (AIRS+AMSU) 1 degree x 1 degree V006, Greenbelt, MD, USA, Goddard Earth Sciences Data Information Services Center (GES DISC) (2013); doi:10.5067/Aqua/AIRS/DATA319.
on January 6, 2021
http://advances.sciencemag.org/
54. B. A. Wielicki, B. R. Barkstrom, E. F. Harrison, R. B. Lee III, G. L. Smith, J. E. Cooper, Clouds and the Earth’s Radiant Energy System (CERES): An Earth observing system experiment.
Bull. Amer. Meteor. Soc. 77, 853–868 (1996).
55. D. P. Dee, S. M. Uppala, A. J. Simmons, P. Berrisford, P. Poli, S. Kobayashi, U. Andrae, M. A. Balmaseda, G. Balsamo, P. Bauer, P. Bechtold, A. C. M. Beljaars, L. van de Berg, J. Bidlot, N. Bormann, C. Delsol, R. Dragani, M. Fuentes, A. J. Geer, L. Haimberger, S. B. Healy, H. Hersbach, E. V. Hólm, L. Isaksen, P. Kållberg, M. Köhler, M. Matricardi, A. P. McNally, B. M. Monge-Sanz, J.-J. Morcrette, B.-K. Park, C. Peubey, P. de Rosnay, C. Tavolato, J.-N. Thépaut, F. Vitart, The ERA-Interim reanalysis: Configuration and performance of the data assimilation system. Q. J. Roy. Meteorol. Soc. 137, 553–597 (2011).
56. L. Guanter, C. Frankenberg, A. Dudhia, P. E. Lewis, J. Gómez-Dans, A. Kuze, H. Suto, R. G. Grainger, Retrieval and global assessment of terrestrial chlorophyll fluorescence from GOSAT space measurements. Remote Sens. Environ. 121, 236–251 (2012). 57. Y. Zeng, G. Badgley, B. Dechant, Y. Ryu, M. Chen, J. A. Berry, A practical approach
for estimating the escape ratio of near-infrared solar-induced chlorophyll fluorescence.
Remote Sens. Environ. 232, 111209 (2019).
58. Y. Sun, R. Fu, R. Dickinson, J. Joiner, C. Frankenberg, L. Gu, Y. Xia, N. Fernando, Drought onset mechanisms revealed by satellite solar-induced chlorophyll fluorescence: Insights from two contrasting extreme events. J. Geophys. Res. G Biogeosciences. 120, 2427–2440 (2015).
59. V. Humphrey, L. Gudmundsson, S. I. Seneviratne, Assessing global water storage variability from GRACE: Trends, seasonal cycle, subseasonal anomalies and extremes.
Surv. Geophys. 37, 357–395 (2016).
60. S. R. Saleska, H. R. da Rocha, A. R. Huete, A. D. Nobre, P. Artaxo, Y. E. Shimabukuro, LBA-ECO CD-32 Flux Tower Network Data Compilation, Brazilian Amazon: 1999–2006. Data set. Available on-line [https://daac.ornl.gov] from Oak Ridge National Laborat, USA (2013); http://dx.doi.org/10.3334/ORNLDAAC/1174.
61. H. R. da Rocha, A. O. Manzi, O. M. Cabral, S. D. Miller, M. L. Goulden, S. R. Saleska, N. R.-Coupe, S. C. Wofsy, L. S. Borma, P. Artaxo, G. Vourlitis, J. S. Nogueira, F. L. Cardoso, A. D. Nobre, B. Kruijt, H. C. Freitas, C. von Randow, R. G. Aguiar, J. F. Maia, Patterns of water and heat flux across a biome gradient from tropical forest to savanna in brazil. J. Geophys.
Res. Biogeo. 114, G00B12 (2009).
62. K. A. Novick, D. L. Ficklin, P. C. Stoy, C. A. Williams, G. Bohrer, A. C. Oishi, S. A. Papuga, P. D. Blanken, A. Noormets, B. N. Sulman, R. L. Scott, L. Wang, R. P. Phillips, The increasing importance of atmospheric demand for ecosystem water and carbon fluxes. Nat. Clim.
Chang. 6, 1023–1027 (2016).
63. S. Pennypacker, D. Baldocchi, Seeing the fields and forests : Application of surface-layer theory and flux-tower data to calculating vegetation canopy height. Boundary Layer
Meteorol. 158, 165–182 (2016).
64. R. Pieruschka, G. Huber, J. A. Berry, Control of transpiration by radiation. Proc. Natl. Acad.
Sci. U.S.A. 107, 13372–13377 (2010).
Acknowledgments: We acknowledge the World Climate Research Programme’s Working Group on Coupled Modelling, which is responsible for CMIP, and we thank the climate modeling groups (listed in table S1 of this paper) for producing and making model output available. For CMIP, the U.S. Department of Energy’s Program for Climate Model Diagnosis and Intercomparison provides coordinating support and led development of software
infrastructure in partnership with the Global Organization for Earth System Science Portals. We thank A. Carioca de Araujo and S. Saleska for the Brazilian flux tower data. We thank all of the sources of freely accessible data listed under Data Availability. Funding: This research was supported by a NASA Earth and Space Science Fellowship (NNX16AO16). Author contributions: J.K.G. and P.G. wrote the main manuscript text. J.K.G. prepared figures. J.K.G. performed all analyses. J.K.G. and P.G. designed the study. All authors reviewed and edited the manuscript. Competing interests: The authors declare that they have no competing interests. Data and materials availability: All data needed to evaluate the conclusions in the paper are present in the paper and/or the Supplementary Materials. The following data were freely accessed from the following locations: http://iridl.ldeo.columbia.edu/ (GPCP precipitation), https://disc.gsfc.nasa.gov/ (AIRS relative humidity and 2m temperature), https://ceres-tool.larc. nasa.gov/ (CERES PAR), http://apps.ecmwf.int/ (ERA-Interim temperature), http://avdc.gsfc.nasa. gov/ (GOME-2 SIF), https://webmap.ornl.gov/ogc/dataset.jsp?dg_id=10023_1 (canopy height), http://doi.org/10.6084/m9.figshare.6387494 (CSIF, FPAR), https://modis.gsfc.nasa.gov/data/ dataprod/mod12.php (MODIS .05-degree land cover type), http://dx.doi.org/10.3334/ ORNLDAAC/1174 (flux tower data), and http://catalogue.ceda.ac.uk/ (CMIP5). Additional flux tower data can be requested from A. Carioca de Araujo ([email protected]). Additional data related to this paper may be requested from the authors.
Submitted 24 March 2020 Accepted 7 October 2020 Published 20 November 2020 10.1126/sciadv.abb7232
Citation: J. K. Green, J. Berry, P. Ciais, Y. Zhang, P. Gentine, Amazon rainforest photosynthesis increases in response to atmospheric dryness. Sci. Adv. 6, eabb7232 (2020).
on January 6, 2021
http://advances.sciencemag.org/
DOI: 10.1126/sciadv.abb7232 (47), eabb7232. 6
Sci Adv
ARTICLE TOOLS http://advances.sciencemag.org/content/6/47/eabb7232
MATERIALS
SUPPLEMENTARY http://advances.sciencemag.org/content/suppl/2020/11/16/6.47.eabb7232.DC1
REFERENCES
http://advances.sciencemag.org/content/6/47/eabb7232#BIBL
This article cites 58 articles, 9 of which you can access for free
PERMISSIONS http://www.sciencemag.org/help/reprints-and-permissions
Terms of Service
Use of this article is subject to the
is a registered trademark of AAAS.
Science Advances
York Avenue NW, Washington, DC 20005. The title
(ISSN 2375-2548) is published by the American Association for the Advancement of Science, 1200 New
Science Advances
License 4.0 (CC BY-NC).
Science. No claim to original U.S. Government Works. Distributed under a Creative Commons Attribution NonCommercial Copyright © 2020 The Authors, some rights reserved; exclusive licensee American Association for the Advancement of
on January 6, 2021
http://advances.sciencemag.org/