HAL Id: inserm-00086741
https://www.hal.inserm.fr/inserm-00086741
Submitted on 29 Jan 2008
HAL is a multi-disciplinary open access archive for the deposit and dissemination of sci-entific research documents, whether they are pub-lished or not. The documents may come from teaching and research institutions in France or
L’archive ouverte pluridisciplinaire HAL, est destinée au dépôt et à la diffusion de documents scientifiques de niveau recherche, publiés ou non, émanant des établissements d’enseignement et de recherche français ou étrangers, des laboratoires
Awareness of driving while sleepy and road traffic
accidents: prospective study in GAZEL cohort.
Hermann Nabi, Alice Guéguen, Marie Zins, Emmanuel Lagarde, Mireille
Chiron, Sylviane Lafont
To cite this version:
Hermann Nabi, Alice Guéguen, Marie Zins, Emmanuel Lagarde, Mireille Chiron, et al.. Awareness of driving while sleepy and road traffic accidents: prospective study in GAZEL cohort.. BMJ / BMJ (CLINICAL RESEARCH ED); Br Med J; British Medical Journal; Brit Med J, 2006, 333 (7558), pp.75. �10.1136/bmj.38863.638194.AE�. �inserm-00086741�
Awareness of driving while sleepy and road traffic accidents: prospective study in GAZEL cohort.
Hermann Nabi, Alice Guéguen, Mireille Chiron, Sylviane Lafont, Marie Zins, Emmanuel Lagarde
(1) Institut National de la Santé et de la Recherche Médicale, U687-IFR69, Saint-Maurice, F-94415 France Hermann Nabi PhD research student Alice Guéguen statistician Marie Zins physician epidemiologist Emmanuel Lagarde senior researcher
(2) Institut National de Recherche sur les Transports et leur Sécurité, UMRESTTE, Bron, F-69675 BRON, France Mireille Chiron senior researcher Sylviane Lafont statistician Correspondence to: Emmanuel Lagarde INSERM Unité 593
Université Victor Segalen Bordeaux 2, Case 11 146 rue Léo Saignat
33076 Bordeaux Cedex, France Tel: + (33) 5 57 57 15 80 Fax: + (33) 5 56 24 00 81
Abstract
Objectives: To examine the association between self-assessed sleepy driving and the risk of
serious Road Traffic Accidents (RTA).
Design: Prospective cohort study Setting: France
Participants: 13299 out of the 19894 living members of the GAZEL cohort, workers and
recent retirees of a French national utility company followed up since 1989.
Main outcome measures: Participants reported in 2001 their own frequency of sleepy driving
in the past 12 months. Their serious RTA were recorded over the succeeding 3 years. Rate Ratios (RRs) of serious RTA in the 2001-2003 period were estimated using generalized linear Poisson regression models with time-dependent covariates.
Results: The risk of serious RTA increased proportionally with the frequency of self-reported
sleepy driving. After controlling for sociodemographic characteristics, driving-behaviour variables, work conditions, retirement, medical conditions and treatments, depressive symptoms, and sleep disorders, the adjusted RRs of serious RTA for those who reported sleepy driving in the past 12 months “a few times” and “once a month or more often” were 1.5 (95% confidence interval: 1.2 to 2.0) and 2.9 (95% confidence interval: 1.3 to 6.3) respectively when compared to participants who reported no sleepy driving over the same period. These associations were not explained by any reported sleep disorders.
Conclusions: Self-assessed sleepy driving was a powerful predictor of serious RTA,
suggesting that drivers’ awareness of their sleepiness while driving is not sufficient to prevent them from having RTA. Prevention messages should therefore focus on convincing sleepy drivers to stop driving and sleep before resuming their journey.
What is already known on this topic
Retrospective studies suggest that sleepiness in drivers is an important factor contributing to the burden of traffic-related morbidity and mortality.
What this study adds
Self-assessed sleepy driving is a powerful predictor of serious road traffic accidents, suggesting that drivers’ are able to accurately assess sleepiness while driving but do not act accordingly.
Introduction
While sleepiness in drivers is increasingly recognized as an important factor contributing to the burden of traffic-related morbidity and mortality, 1-4 proper assessment of its contribution is still lacking. 2-4 Published estimates of the proportion of road traffic accidents attributable to sleepiness range from 3 to 33% according to studies conducted in France, 4 the United States (US) 5,6 and Australia. 7 In particular, little is known about the extent to which drivers are able to assess accurately that they are sleepy while driving. 5,8
Results from the 2005 Sleep in America poll 9 of the National Sleep Foundation (NSF) indicated that 60% of America’s adults who drive or have a license reported that, within the past year, they had driven a car or motor vehicle when feeling drowsy or sleepy. A survey recently conducted in France showed that 7 out of 10 French people report periods of sleepiness in the course of the day and about 6% admitted having driven while sleepy at least once during the previous three months. 10
We conducted a prospective study in a large cohort of French employees in order to examine the association between self-reported frequency of sleepy driving over the past 12 months and the risk of subsequent serious RTA over the following three-year period.
MATERIALS AND METHODS Participants
The participants are current employees or recent retirees of the French national electricity and Gas Company, who volunteered to participate in a research cohort, known as the GAZEL cohort. The GAZEL cohort was established in 1989 and originally included 20624 subjects working at Electricité De France–GazDe France (EDF-GDF), comprising men aged 40–50 and women aged 35–50 at baseline. Since 1989, this cohort has been followed up by means of yearly self-administered questionnaires and by data collection from the company’s personnel andmedical departments.
Materials
Data on sleepiness and other driving behaviours were collected in 2001 using a self-administered Driving Behaviour and Road Safety (DBRS) questionnaire. Data on incident accidents in the period 2001-2003 were collected from the yearly self-administered Annual
GAZEL Cohort (AGC) questionnaire. Finally, when an accident was reported in the AGC,
participants were sent a Complementary Accident Form (CAF) with 31 questions about the circumstances, injuries, reasons for the accident and the responsibility of the driver.
Data from the GAZEL cohort database
Sociodemographic and medical data including self-reported sleep disorders (treated or not) and alcohol consumption 11 were recorded each year in 2001-2003 period from the AGC. Questions on mobility and accidents of the past year were also added to the AGC questionnaire in this period. Drivers were asked how many kilometres they drove a 4- or 2-wheel vehicle in the last 12 months. The participants were also asked to report whether in the past 12 months they had been involved in one or more serious traffic accidents defined as an accident which required at least a medical consultation. In the January 2002 AGC questionnaire, participants were also
asked to record the date of reported accidents. This enabled us to exclude accidents that occurred before the completion of the 2001 DBRS questionnaire.
Driving Behaviour and Road Safety (DBRS) questionnaire 2001
In 2001, the DBRS questionnaire was mailed to the 19894 living members of the GAZEL cohort. 11 Driving whilst sleepy was assessed using the question: “in the 12 past months, have you ever driven while sleepy?” (1= never, 2 = a few times in the year, 3 = about once a month, 4 = about once a week, 5 = more than once a week). Other potential confounders were also recorded including reported drinking and driving, medication taken for anxiety, depression, another nervous disease, or sleeping problems and work conditions (overtime work, time constraints, changing work schedules and night shifts). Participants were also asked whether they had ever used connectionsto avoid paying the fine for a traffic violation. They were also asked to report their maximum speed in built-up areas, on rural roads, and on highways. Participants were also suspected to havea risky behaviour if they reported answering a phone call (with or without a car kit) whateverthe driving circumstances and/or if they reported not stopping the vehicle before starting a phone call. The type of principal vehicle owned in January 2001 was coded in five categories corresponding to increased maximum speed. Finally, the participant’s scores for the type-A behaviour pattern assessed in 1993 by the Bortner rating scale were also taken into account in the study .12
Statistical analysis
Answers to the questions related to sleepy driving frequency were regrouped into 3 categories (never; a few times in the year; once a month or more often). Univariate logistic regression models were fitted to identify factors associated with reporting sleepy driving, including medical conditions found to be associated with serious RTA in previous research 13. Factors
that were found to be associated with sleepy driving with a p value <20% in univariate analysis were all included in a multivariate logistic regression model.
Because the mean and variance of the number of serious RTA in the 2001-2003 period were not different in our study, we used generalized linear Poisson regression models 14 with timedependent covariates in order to estimate the rate ratios (RRs) of serious RTA in the 2001 -2003 period associated with reported sleepy driving in 2001. The impacts of potential confounders were tested using six nested Poisson regression models. In model 1, sleepy driving was the only independent variable. RRs in model 2 were further adjusted for age, gender, occupational category in 2001 and annual mileage (a time-dependent covariate). A logarithmic transformation was applied to annual mileage. In model 3, RRs were further adjusted for alcohol consumption (time-dependent covariate), reported maximum speed in built-up areas, on rural roads and on highways, risky use of mobile phone, drinking and driving, and traffic ticket fixing as reported in 2001.11 In model 4, potential confounders further included reported sleep disorders (a time-dependent covariate). RRs in model 5 were further adjusted for working overtime, time constraints at work and working night shifts. Finally, RRs in model 6 were additionally adjusted for depression, use of medication and treatment of medical conditions (a time-dependent covariate). We fitted the same 6 nested models to the sub-sample of those who did not report any sleep disorders or related treatment in the period.
A proportion of those who reported RTA in one of the three AGC questionnaires returned the CAF. This allowed us to compare accident characteristics between those who reported sleepy driving and others. In this complementary analysis we also included heavy material RTA in addition to serious RTA in order to achieve sufficient sample size.
The population attributable risk for driving while sleepy was computed using Levin’s method.15
RESULTS
We received responses to the 2001 Driving Behaviour and Road Safety (DBRS) questionnaire from 14226 of the 19894 living members of the GAZEL cohort. Some were excluded (n=26) because of data discrepancies with the general cohort database. Another 326 respondents were excluded because they did not drive in 2001 as were 200 respondents because their data on sleepy driving variables were missing. This left 13674 participants (10480 men, 3194 women). To the question “in the 12 past months, have you ever driven while sleepy?” 8597 participants (62.9%) responded never, 4917 (36%) a few times in the year, 104 (0.8%) about once a month, 35 (0.3%) about once a week, and 21 (0.2%) more than once a week. Table 1 shows factors associated with the odds of reporting sleepy driving as determined by logistic regression analysis.
Serious road traffic accidents in the 2001-2003 period
A further 375 of the 13674 participants were also excluded because they did not respond to any of the three succeeding AGC questionnaires of the years 2001, 2002 and 2003. Among the remaining 13299 participants, 322 reported one serious RTA, 8 two serious RTA and 1 three serious RTA in the 2001-2003 period, ignoring 76 serious RTA that were reported to have occurred before the completion of the 2001 DBRS questionnaire.
Self-reported sleepy driving frequency and serious road traffic accidents
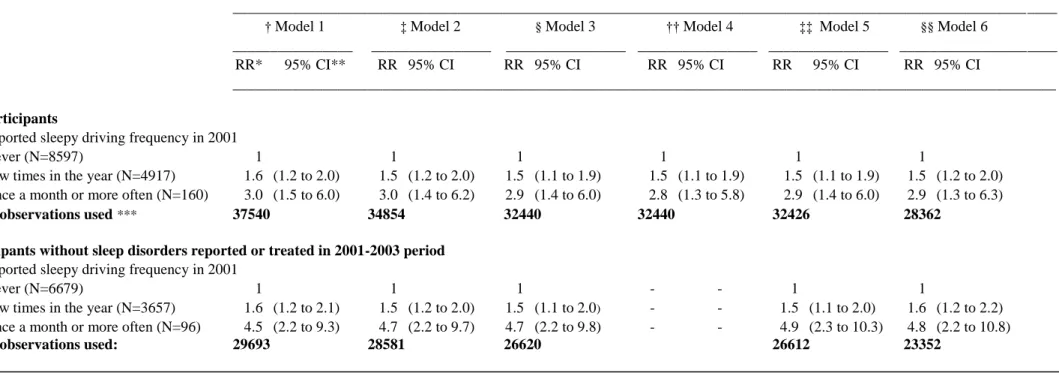
Table 2 presents results from generalized linear Poisson regression models fitted to estimate the impact of sleepy driving on the risk of serious RTA in the 2001-2003 period. When compared with participants who reported no sleepy driving in the last 12 months, the unadjusted RR in model 1 was 1.6 (95% Confidence Interval 1.2 to 2.0) for participants who reported having driven while sleepy “a few times in the year”, and 3.0 (95% Confidence Interval 1.6 to 6.0) for participants who reported having done so “once a month or more often”. These associations
remained fairly unchanged when further adjusted for several sets of potential confounders. The corresponding adjusted RR were: 1.5 (95% Confidence Interval 1.2 to 2.0) and 2.9 (95% Confidence Interval 1.3 to 6.3). When similar analyses were restricted to the sub-sample of participants who did not report any sleep disorders in the 2001-2003 period, the association measures were higher, particularly for participants who reported having driven while sleepy about “once a month or more often”. These strong associations persisted after further adjustment for potential confounders.
We estimated the population attributable risk for sleepy driving as 19.2 %.
Road traffic accident characteristics of those reporting sleepy driving
We received 395 complementary accident forms related to traffic accidents of the 2001-2003 period. Examination of the 321 accidents in which the participant was a driver showed that in 238 cases the participant drove a car, 3 an utilitarian vehicle, 19 a 2-wheel motorized vehicle and 23 a bicycle. Restricting the sample to the 260 accidents in a 2-4 wheel motorized vehicle showed significant differences in the proportion for participants who reported at least one episode of sleepy driving according to two types of accidents: accidents due to sleepiness or worry and accidents in which driver responsibility was recognized by the insurance company.
DISCUSSION
We found a robust association between self-assessed sleepy driving and the risk of serious RTA in the following 3 years, the latter risk increasing with reported sleepy driving frequency. Association as measured by adjusted RR was not modified by inclusion of a wide range of potential confounders. When a similar analysis was restricted to the sub-sample of participants who did not report any sleep disorders in the 2001-2003 period, the association was even stronger.
Strengths and limitations
Our results are consistent with previous findings from New Zealand 3, France 4, and the US 5 and support laboratory simulation studies suggesting that drivers are able to perceive that they are sleepy while driving.8 Our study is the only prospective study ever conducted and because participants were from a large cohort followed up on a regular basis, we were able to control carefully for a wide range of potential confounders, some of them being updated each year. Additional analysis did not found any interaction effect with the nature of travel (commuting, professional or private).
Both serious RTA and sleepy driving were self-reported. Although self-reported measures of risky-driving behaviours have been found to have considerable validity in predicting traffic accident risk, 16 they cannot possibly account for all sleepy driving situations. It is unlikely, however, that this lack of accuracy would have biased our results. Firstly because sleepy driving does not constitute an offence against the Highway Code, and secondly because serious RTA in our study were recorded independently of risky-driving behaviours. Furthermore a recent study found that self-reported sleepiness when driving was consistent with sleepiness as an independent model based on circadian and sleep factors.17 Finally, examination of the 260 complementary accident forms showed that participants who reported sleepy driving at least
once were more likely to report accidents due to sleepiness or worry and accidents in which the responsibility of the participant was recognized by the insurance company.
Sleepy driving was recorded in a different period than serious RTA, assuming sleepy driving to be a somewhat consistent behaviour over several years for a given driver. In 2004, a second DBRS questionnaire was sent to the participants in an attempt to assess changes in driver behaviour on roads as compared to the 2001 reports. Participants were asked the same questions as in 2001. Comparison of answers between 2001 and 2004 showed a fair stability as far as sleepy driving is concerned (Kappa=0.47, p=0.008). We also compared the risk of having at least one serious RTA in 2001 according to the frequency of sleepy driving reported over the same 2001 period (data not shown). A similar trend was found but the statistical power was low.
For comparative purposes, we estimated the population attributable risk for sleepy driving as 19%, a figure consistent with data from a study conducted in New Zealand 3 (19%). Published estimates of the proportion of car crashes attributable to driver sleepiness range widely, from about 3% to 33%. 3-5,7 The study sample, despite its large size, was not representative of French drivers as a whole. The participants had various jobs and were from different socioeconomic groups throughout France, but were all middle-aged drivers.
The association between self-assessed sleepy driving and the risk of serious RTA was stronger when the analysis was restricted to a sub-sample of participants not reporting any sleep disorders in the 2001-2003 period. It seems that although those with sleep disorders were more likely to report sleepy driving (Table 1), the association measure between self-reported sleep disorders and the risk of serious RTA was lower. This suggests that drivers with prior sleep
Implications
Our prospective data clearly identified sleepy driving unrelated to any medical condition as a significant independent factor contributing to serious RTA with important consequences for public safety because of the high proportion of drivers concerned.18 Our results suggest that drivers are aware that they are sleepy while driving, but do not act accordingly.19 This was already noted by Reyner and Horne who found that perception of sleepiness does not result in cessation of driving in laboratory simulations.8 Drivers may either underestimate the impact of sleepiness on their driving performance or overestimate their capacity to fight sleepiness. 5
As self-assessment of sleepiness while driving seems possible, the role of policing should consist in the development and implementation of national campaigns to raise the awareness of all road users and to inform them how to avoid sleepy driving through promotion of “sleep hygiene” 20
or how to deal with it. The only long-lasting measure is, however, to stop driving and sleep or let someone else drive. 19-21 Prevention programmes should also include building or improvement of rest areas and installing shoulder rumble strips. In addition, legislative/regulatory initiatives should also be discussed 22 even if appropriate tools to measure driver sleepiness are still to be developed. Finally, development and evaluation of in-vehicle systems that can detect a sleepy driver should also be promoted.
Contributorship statement and guarantor
H Nabi analysed and interpreted data and wrote the report. E Lagarde conceived the study, contributed to analysis and interpretation of data and to the preparation of the manuscript. Alice Guéguen was involved with analysis and interpretation of data. M Chiron, S Lafont, and M Zins contributed to study design and interpretation of data. All authors contributed to the final version of the report. All authors had full access to all the data in the study and had final responsibility for the decision to submit for publication. E Lagarde is the guarantor.
A competing interest statement
"All authors declare that the answer to the questions on your competing interest form bmj.com/cgi/content/full/317/7154/291/DC1 are all No and therefore have nothing to declare".
Financial support
The project was funded by Renault, Electricité de France-Gaz de France and Fondation MAIF. The funding body had no inputs to the study design; the collection, analysis, and interpretation of data; the writing of the report; or the decision to submit the paper for publication.
Acknowledgments
We thank all those who supported this work and in particular the staff of unit 687 of INSERM. Very special thanks go to Sébastien Bonenfant, Nadine Kaniewsky, and Nathalie Lopes for their valuable help throughout the study, and to Marcel Goldberg, Jean-François Chastang and Pierre Philip for advice and support.
Ethical approval
This study protocol was approved by the French Data Protection Authority [Commission Nationale Informatique et Liberté (CNIL)]. Before inclusion in both the GAZEL cohort and the study on traffic safety, all participants received an information letter describing the main objective of the study and the non-compulsory nature of their participation.
Exclusive licence
"The Corresponding Author has the right to grant on behalf of all authors and does grant on behalf of all authors, an exclusive licence (or non-exclusive for government employees) on a worldwide basis to the BMJ Publishing Group Ltd to permit this article (if accepted) to be
REFERENCES
1. Philip P, Sagaspe P, Moore N, Taillard J, Charles A, Guilleminault C, Bioulac B. Fatigue, sleep restriction and driving performance. Accid Anal Prev 2005; 37(3):473-8. 2. Connor J, Whitlock G, Norton R, Jackson, R. The role of driver sleepiness in car crashes: a systematic review of epidemiological studies. Accid Anal Prev 2001; 33: 31-41.
3. Connor J, Norton R, Ameratunga S, Robinson E, Civil I, Dunn R, Bailey J, Jackson R. Driver sleepiness and risk of serious injury to car occupants: population based case control study. BMJ 2002; 324(7346):1125.
4. Philip P, Vervialle F, Le Breton P, Horne JA. Fatigue, alcohol, and serious road traffic crashes in France: Factorial study of national data. BMJ 2001; 322:829-830.
5. Lyznicki JM, Doege TC, Davis RM, Williams MA. Sleepiness, driving, and motor vehicle crashes. JAMA 1998; 279: 1908-1913.
6. Knipling RR, Wang J-S. Crashes and Fatalities Related to Driver Drowsiness/Fatigue. Washington, DC: Office of Crash Avoidance Research, US Dept
of Transportation; 1994.
7. Pierce RJ. Driver sleepiness: occupational screening and the physician’s role. Aust N Z
J Med 1999; 29:658-661.
8. Reyner LA, Horne JA. Falling asleep whilst driving: are drivers aware of prior sleepiness? Int J Legal Med. 1998, 111(3):120-3.
9. National Sleep Foundation. 2005 Sleep in America POLL. Summary of findings, Washington, DC; 2005.
10. TNS-Sofres. Les Français et la somnolence. Résultats d’étude. Institut du sommeil et de la vigilance, La Tronche; 2004.
11. Lagarde E, Chiron M, Lafont S. Traffic ticket fixing and driving behaviours in a large French working population. J Epidemiol Community Health 2004; 58(7):562-8.
12. Nabi H, Consoli SM, Chastang JF, Chiron M, Lafont S, Lagarde E. Type A behavior pattern, risky driving behaviors, and serious road traffic accidents: a prospective study of the GAZEL cohort. Am J Epidemiol. 2005; 161(9):864-70.
13. Lagarde E, Chastang JF, Lafont S, Coeuret-Pellicer M, Chiron M. Pain and pain treatment were associated with traffic accidents involvement in a cohort of middle-aged workers. J Clin Epidemiol 2005; 58:524-531.
14. McCullagh P, Nelder JA. Generalized Linear Models. Chapman and Hall: London. 1989.
Lippincott-16. Fergusson D, Swain-Campbell N, Horwood J. Risky driving behaviour in young people: prevalence, personal characteristics and traffic accidents. Aust N Z J Public
Health 2003; 27(3):337-42.
17. Smith S, Carrington M, Trinder J. Subjective and predicted sleepiness while driving in young adults. Accid Anal Prev 2005; 37(6):1066-73.
18. Drobnich D. A National Sleep Foundation’s conference summary: The National Summit to prevent drowsy driving and a new call to action. Ind Health 2005; 43(1):197-200.
19. Dalziel JR, Job RF. Motor vehicle accidents, fatigue and optimism bias in taxi drivers.
Accid Anal Prev. 1997; 29(4):489-94.
20. MacLean AW, Davies DR, Thiele K. The hazards and prevention of driving while sleepy. Sleep Med Rev 2003; 7(6):507-21.
21. Horne JA. Sleep-related vehicle accidents: some guidelines for road safety policies. Transportation Research-Part F 2001; 4: 63-74.
22. Rosen IM. Driving while sleepy should be a criminal offense. JCSM 2005; 1(4):337-4
Table 1 Factors associated with the reporting of at least one episode of sleepy driving in 2001. Unadjusted and adjusted odds
ratios and their 95% confidence intervals determined by logistic regression analysis (N=13674).
_____________________________________________________________________________________________________________________________ ________________________________________________________________________________________________________________
At least one episode of sleepy driving
__________________________________________________________________________________ Variables n N †OR 95% CI ‡aOR 95% CI
________________________________________________________________ Sex 13674 Female 3194 1 1 Male 10480 1.7 (1.5 to 1.8)**** 1.3 (1.1 to 1.6)**** Occupational category 13660 Unskilled Workers 1330 1 1 Skilled Workers 7397 1.2 (1.0 to 1.3)** 1.1 (0.9 to 1.4)* Managers 4933 2·2 (2.0 to 2.6)**** 1.8 (1.5 to 2.2)****
Driving mileage per year 12163
< 10 000 km 2785 1 10 000 – 20 000 km 5245 1.5 (1.4 to 1.7)**** 1.6 (1.4 to 1.8)**** > 20 000 4133 2.5 (2.2 to 2.7)**** 2.2 (1.9 to 2.5)**** Year of birth 13674 1939-1943 5374 1 1 1944-1948 7080 1.3 (1.2 to 1.4)**** 1.2 (1.0 to 1.3)** 1949-1953 1220 1.0 (0.9 to 1.2) 1.4 (1.1 to 1.8)*** Working overtime 13672 Never 9015 1 1 Occasionally 2283 1.3 (1.1 to 1.4)**** 1.3 (1.0 to 1.7)** Often/Always 2374 2.4 (2.2 to 2.6)**** 1.6 (1.2 to 2.1)***
Time constraints at work 13673
Never 9536 1
Occasionally 2032 1.5 (1.4 to 1.7)**** 1.1 (0.9 to 1.4)*
Often/Always 2105 2.4 (2.1 to 2.6)**** 1.3 (1.0 to 1.6)**
Work schedules 13673
Same everyday 11454 1
Different and fixed by company 727 1.4 (1.2 to 1.7)**** 1.1 (0.9 to 1.4)
Different and fixed by yourself 1492 2.2 (1.9 to 2.4)**** 1.1 (0.9 to 1.3)
Working night shifts 13670
Never 12431 1
Occasionally 1099 2.1 (1.8 to 2.3)**** 1.2 (1.0 to 1.4)**
Regularly 140 2.9 (2.0 to 4.0)**** 1.8 (1.1 to 2.9)**
Use of medication for 13512
No medication 8212 1 1
Anxiety 2065 1.0 (0.8 to 1.1) 1.1 (1.0 to 1.3)**
Depression 684 1.1 (0.9 to 1.4) 1.2 (1.0 to 1.5)**
Other nervous disease 220 1.6 (1.1 to 2.2)*** 1.5 (1.0 to 2.2)**
Sleep 2325 1.2 (1.1 to 1.3)**** 1.8 (0.6 to 5.5)
Retirement 11764
No 7311 1 1
Yes 4453 0.5 (0.5 to 0.6)**** 0.9 (0.8 to 1.4)
Depressive symptoms (CES-D) 11272
No 9236 1 1
Yes 2036 1.5 (1.3 to 1.6)**** 1.5 (1.3 to 1.7)****
Alcohol consumption$ 13674
Non-drinker 7673 1 1
Low quantity regular 888 1.1 (1.1 to 1.3)** 0.5 (0.2 to 1.5)
Low quantity episodic 172 1.6 (1.2 to 2.3)*** 1.4 (0.9 to 2.0)*
High quantity regular 4865 1.2 (1.1 to 1.3)**** 1.2 (1.1 to 1.4)****
High quantity episodic 76 1.2 (0.8 to 2.0)* 1.1 (0.6 to 1.9)*
Sleep disorder reported in 2001 12831
No sleep disorder 10432 1 1
Sleep disorder 2061 1.2 (1.1 to 1.3)**** 1.2 (1.1 to 1.4)***
Sleep disorder treated 338 1.2 (1.0 to 1.5)** 1.2 (0.9 to 1.7)
Divorce in 2001 13,674
No 13508 1 1
Yes 166 1.2 (0.9 to 1.7)* 0.9 (0.6 to 1.4)
Medical conditions treated in 2001 13674
No 12733 1 1
Dental or gum problems 61 1.6 (0.9 to 2.7)* 1.6 (0.8 to 3.1)*
Cataract 10 - - - -
Renal colic or kidney stones 24 1.2 (0.5 to 2.7) 1.2 (0.4 to 3.1)
Glaucoma 106 1.0 (0.6 to 1.5) 0.9 (0.5 to 1.6)
Hiatal hernia 316 1.2 (1.0 to 1.6)** 1.4 (1.0 to 1.8)**
Gastric ulcers 63 1.5 (0.9 to 2.5)* 1.6 (0.8 to 3.0)*
Diabetes 361 0.8 (0.6 to 1.0)* 0.9 (0.7 to 1.2)
Traffic ticket fixing 13526
Continued Table 1
Type-A behaviour pattern scores 11845
≤ 48 3114 1 1
49-57 5372 1.1 (1.0 to 1.2) 0.9 (0.8 to 1.1)
≥ 58 3359 1.2 (1.2 to 1.3)*** 0.9 (0.8 to 1.0)*
* p≤ 0.20, **p≤0.05, *** p≤0.01, **** p≤10-3
† Odds ratio of reporting at least one episode of sleepy driving for each variable assessed separately and as an independent variable. ‡ Odds ratio of reporting at least one episode of sleepy driving adjusted for all variables.
$ Low quantity drinkers were defined as men (women) reporting 1-13 (1-6) drinks over one week as opposed to high quantity drinkers who reported 14-27 (men) and 7-20 (women) drinks over the same period. Regular drinkers were defined as those who reported consuming alcohol on three or more days in the week, as opposed to episodic drinkers who reported drinking alcohol on less than 3 days a week.
Table 2 Rate ratios of serious RTA in the 2001-2003 period according to frequency of self-reported sleepy driving determined by generalized linear Poisson regression models.
* Rate Ratios; ** 95% confidence interval; ***cumulated observation years during 3-year follow-up; † Model 1: Unadjusted rate ratios
‡ Model 2: RR adjusted for sex (male/female), age (covariate of 3 categories), occupational category (a time-dependent covariate of 3 categories: unskilled workers/skilled workers/managers) and driving mileage per year (a time-dependent covariate logarithmic transformed).
§ Model 3: Model 2 + alcohol consumption (a five-category, time-dependent covariate describing quantity and frequency) maximum speed greater than ± 10% legal limits in built-up areas (yes/no), on rural roads (yes/no) and on highways (yes/no), risky use of mobile phone (yes/no), vehicle categories (4 categories), and traffic ticket fixing (yes/no).
†† Model 4: Model 3 + sleep disorder (a three-category, time-dependent covariate: No sleep disorder, sleep disorder, and sleep disorder treated).
‡‡ Model 5: Model 4 + working overtime (never, occasionally, and often/always), time constraints at work (never, occasionally, and often/always) and working night shifts (never, on occasion, and regularly).
§§ Model 6: Model 5 + Depressive symptoms in 2002 and used of medication in 2001 for (never, anxiety, depression, other nervous disease, and sleep) and for medical conditions treated in 2001-2003 period (no, dental or gum problems, cataract, renal colic or kidney stones, glaucoma, hiatal hernia, gastric ulcers, and diabetes)
For analysis among participants without sleep disorders reported or treated in 2001-2003 period, no adjustment was made for the sleep disorder variable in models 5 and 6. Rate ratios of serious accidents
______________________________________________________________________________________________________________ † Model 1 ‡ Model 2 § Model 3 †† Model 4 ‡‡ Model 5 §§ Model 6
________________ ________________ ________________ ________________ ________________ _____________________ RR* 95% CI** RR 95% CI RR 95% CI RR 95% CI RR 95% CI RR 95% CI
______________________________________________________________________________________________________________
All participants
Self-reported sleepy driving frequency in 2001
Never (N=8597) 1 1 1 1 1 1
Few times in the year (N=4917) 1.6 (1.2 to 2.0) 1.5 (1.2 to 2.0) 1.5 (1.1 to 1.9) 1.5 (1.1 to 1.9) 1.5 (1.1 to 1.9) 1.5 (1.2 to 2.0) Once a month or more often (N=160) 3.0 (1.5 to 6.0) 3.0 (1.4 to 6.2) 2.9 (1.4 to 6.0) 2.8 (1.3 to 5.8) 2.9 (1.4 to 6.0) 2.9 (1.3 to 6.3)
No. of observations used *** 37540 34854 32440 32440 32426 28362 Participants without sleep disorders reported or treated in 2001-2003 period
Self-reported sleepy driving frequency in 2001
Never (N=6679) 1 1 1 - - 1 1
Few times in the year (N=3657) 1.6 (1.2 to 2.1) 1.5 (1.2 to 2.0) 1.5 (1.1 to 2.0) - - 1.5 (1.1 to 2.0) 1.6 (1.2 to 2.2) Once a month or more often (N=96) 4.5 (2.2 to 9.3) 4.7 (2.2 to 9.7) 4.7 (2.2 to 9.8) - - 4.9 (2.3 to 10.3) 4.8 (2.2 to 10.8)