HAL Id: hal-00305283
https://hal.archives-ouvertes.fr/hal-00305283v2
Submitted on 25 Jul 2008
HAL is a multi-disciplinary open access
archive for the deposit and dissemination of
sci-entific research documents, whether they are
pub-lished or not. The documents may come from
teaching and research institutions in France or
abroad, or from public or private research centers.
L’archive ouverte pluridisciplinaire HAL, est
destinée au dépôt et à la diffusion de documents
scientifiques de niveau recherche, publiés ou non,
émanant des établissements d’enseignement et de
recherche français ou étrangers, des laboratoires
publics ou privés.
Magnetic order and multipole interactions in
CexPr1–xB6 solid solutions
Jean-Michel Mignot, Gilles André, Julien Robert, Masafumi Sera, Fumitoshi
Iga
To cite this version:
Jean-Michel Mignot, Gilles André, Julien Robert, Masafumi Sera, Fumitoshi Iga. Magnetic order
and multipole interactions in CexPr1–xB6 solid solutions. Physical Review B: Condensed Matter
and Materials Physics (1998-2015), American Physical Society, 2008, 78, pp.014415.
�10.1103/Phys-RevB.78.014415�. �hal-00305283v2�
J.-M. Mignot,1 G. Andr´e,1 J. Robert,1 M. Sera,2 and F. Iga2 1
Laboratoire L´eon Brillouin, CEA-CNRS, CEA/Saclay, 91191 Gif sur Yvette (France) 2
Department of Quantum Matter, ADSM, Hiroshima University, Higashi-Hiroshima, 739-8530 (Japan) (Dated: July 25, 2008)
Magnetic ordering phenomena in CexPr1−xB6solid solutions have been studied using both powder and single-crystal neutron diffraction. A variety of magnetic structures are observed depending on temperature and Ce concentration. Over a broad composition range (x ≤ 0.7), Pr–Pr interactions play a dominant role, giving rise to incommensurate structures with wave vectors of the form kIC1= (1/4 − δ, 1/4, 1/2) or kIC2= (1/4 − δ, 1/4 − δ, 1/2). The crossover to a CeB6-like regime takes place near x = 0.7–0.8. For the latter composition, the antiferroquadrupolar phase transition observed in transport measurements precedes the onset, at lower temperature, of a commensurate magnetic order similar to that existing in CeB6. However, unlike in the pure compound, an incommensurate magnetic order is formed at even higher temperature and persists in the antiferroquadrupolar phase down to the lock-in transition. These results are shown to reflect the interplay between various type of dipole exchange and higher multipole interactions in this series of compounds.
PACS numbers: 75.20.Hr, 75.25.+z , 75.30.Kz,
Keywords: CeB6, PrB6, CexPr1−xB6, hexaboride, neutron diffraction, magnetic phase diagram, quadrupole
order, multipole interactions
I. INTRODUCTION
Light rare-earth hexaborides (RB6, R = Ce, Pr, Nd)
have attracted much interest for their unconventional or-dering properties originating from different types of mul-tipole interactions. They crystallize in a simple-cubic,
CsCl-type structure (space group no. 221, P m¯3m), which
is favorable for retaining high degeneracies and orbital degrees of freedom, within the crystal-field eigenstates.
The dense Kondo compound CeB6 is well known for
developing antiferroquadrupolar (AFQ) long-range
or-der below a transition temperature TQ = 3.2 K (phase
II). This order consists of a staggered arrangement,
with wave vector kAFQ = (1/2, 1/2, 1/2), of Oxy-type
quadrupole moments (Oxy = [
√
3/2] [JxJy+ JyJx])
as-sociated with the Γ8 quartet ground state of Ce3+, as
was first established by Effantin et al. using neutron
diffraction.1 The latter work represented a milestone in
multipole interaction studies because it showed that, al-though quadrupole order does not break time-reversal symmetry and thus cannot be directly observed in a neutron experiment, it can produce an antiferromagnetic
(AFM) dipole component at the same wave vector kAFQ,
which is easily detectable, under the application of a mag-netic field. Subsequently, nonresonant x-ray diffraction
(XRD) measurements2 confirmed this AFQ order,
ac-companied by a higher-rank contribution from electric hexadecapole moments. On the theoretical side, Sakai
et al.,3 have emphasized the central role played by
mag-netic octupole interactions in the properties of phase II and shown, in particular, that the extra hyperfine field produced by octupole moments could solve a longstand-ing inconsistency between neutron and NMR results in this material.
Below TIII= 2.3 K, CeB6 undergoes a second
transi-tion into a long-range magnetic ordered state (phase III).
Its magnetic structure,1 denoted 2k-k′
, is non-collinear and involves four different Fourier components
corre-sponding to the commensurate wave vectors, k(1,2)C =
(1/4, ±1/4, 1/2) and k′(1,2)C = (1/4, ±1/4, 0). It can be
described as a stacking of {001} planes in which the Ce moments are alternatingly oriented along two orthogonal
(in-plane) binary axes.30
It has been argued, both on experimental and
theo-retical grounds,1,5 that this unique structure is closely
related to the underlying AFQ order. In this phase too,
octupole moments (Txyz = [
√
15/6] JxJyJz, where the
bar denotes the sum of all possible permutations of
in-dices) are thought to play a major role.5 Interestingly,
experimental evidence was recently reported for a mag-netic octupole order occurring in the as yet elusive “phase
IV” of CexLa1−xB6(x = 0.70–0.75) solid solutions.6.
PrB6 presents a contrasting case, in which the Γ3
(triplet) crystal field ground state of Pr3+ can also
sus-tain a quadrupole (QP) moment, but no octupole mo-ment. Long-range AFQ order of the type found in phase
II of CeB6 does not develop in the Pr compound
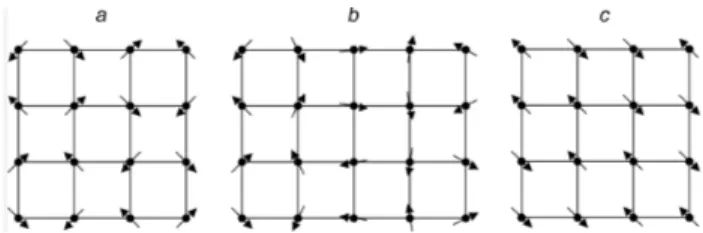
ei-FIG. 1: Schematic representation of planar magnetic struc-tures proposed for CeB6 and PrB6in Refs. 1 and 4: (a) mensurate, double-k, (b) incommensurate, double-k, (c) com-mensurate, single-k. In the case of PrB6, the moments have opposite directions in neighboring planes, whereas they are turned by 90 degrees in phase III of CeB6.
ther at H = 0 or in an applied field. On the other
hand, two magnetic ordered phases exist below TN = 7
K and TC = 4.2 K, respectively.4,7,8 The lower one is
commensurate (C), double-k, and associated with the
same wave vectors k(1,2)C = (1/4, ±1/4, 1/2) as phase
III in CeB6, but without the additional k′(1,2)C
compo-nents. The magnetic structure existing between TC and
TN is also double-k but the wave vectors are now
in-commensurate (IC), k(1,2)IC = (1/4 − δ, ±1/4, 1/2) with
δ = 0.05 (see Fig. 1). The lower transition thus
cor-responds to a lock-in mechanism.9 The similarity with
CeB6strongly suggests that the commensurate magnetic
order may again be associated with an AFQ order of
Oxy moments, but the AFM stacking along the direction
normal to the planes would entail a different AFQ wave
vector kAFQ = (1/2, 1/2, 0) to achieve proper matching
of the dipole and quadrupole structures. On the other
hand, Kuramoto and Kubo10 have argued that GdB
6, which has no 4f orbital degeneracy, orders magnetically with the same wave vector (1/4, 1/4, 1/2) and that, con-sequently, this wave vector must reflect peculiarities of the Fermi surface which are common to all light rare-earth hexaborides. The physical origin of the complex
magnetic structures found in CeB6 and PrB6 therefore
remains controversial.
In order to shed light on this problem, we have
pre-pared CexPr1−xB6 solid solutions with different
concen-trations and studied the evolution of their magnetic or-dering properties using both powder and single-crystal neutron diffraction. Magnetization and transport
mea-surements were reported previously for this series.11,12
The results show that substituting Pr for Ce in CeB6
initially produces a steep decrease in the AFQ transition
temperature TQ, while enhancing TIII. At the particular
composition x = 0.7, the initial situation, TN < TQ,
becomes reversed with TN = 4.1 K and TQ below 2
K at H = 0, but distinct anomalies observed in the physical properties indicate that phase II reappears at
high magnetic fields, and also that the TQ(H) transition
line extends well into the magnetic order region at low
fields.12 The results also reveal the existence of two
dif-ferent magnetic ordered phases at H = 0, IC2 forming at
TIC2 ≡ TN and IC1 below a first-order phase transition
at TIC1 = 3.5 K. Preliminary neutron measurements13
showed that phases IC1 and IC2 both have
incommen-surate magnetic structures. Meanwhile, Tanaka et al.14
performed nonresonant synchrotron XRD experiments on the same material and observed IC superstructure peaks in phase IC1, which they ascribed to an IC multi-pole order.
In this paper, we present neutron diffraction results for different compositions, both on the Pr-rich and Ce-rich sides, and discuss how magnetic properties observed by neutrons can be traced back to the effects of Ce and Pr multipole moments. The report focuses on measurements performed at H = 0. High magnetic field properties and (H, T ) phase diagrams will be the subject of a
forthcom-ing paper.
II. EXPERIMENTS
CexPr1−xB6 solid solutions with x = 0.2, 0.4, and
0.8 were, prepared in Hiroshima using 99.5% enriched
11B isotope. Neutron powder diffraction (NPD) patterns
were collected at the LLB in Saclay, using the two-axis diffractometer G4-1 (800-cell position-sensitive detector) at an incident wavelength of 0.24266 nm (x = 0.8) or 0.24226 nm (x = 0.2 and 0.4). A pyrolytic graphite fil-ter was placed in the incident beam to suppress higher-order contamination. The sample powder was put in a cylinder-shape vanadium container, 6 mm in diameter. The data analysis was performed using the Rietveld
re-finement program FullProf,15,16 with neutron
scatter-ing lengths and magnetic form factors taken from Refs. 17 and 18, respectively. Absorption corrections were applied using an estimated absorption coefficient µR = 0.3.
All compounds were first measured in the paramag-netic phase around 10 K, a few degrees above the N´eel temperature. The diffraction patterns were refined in the
P m¯3m crystal structure, as shown in Fig. 2 for x = 0.8.
The resulting parameters are listed in Table I. The boron coherent length was also refined and the values obtained are in good agreement with those calculated from the
nominal11B isotope content. A faint, broad, somewhat
asymmetric contribution appears in the feet of the Bragg peaks (Fig. 3), denoting the existence of short-range or-der, with an isotropic correlation length of the order of
100 ˚A. A small fraction of a second phase gives rise to
weak peaks above 2θ ≈ 50◦
(Fig. 3), but these peaks do not hinder the analysis of the magnetic signal located mainly at lower angles. More intriguing is the existence of a very weak extra contribution, with a markedly
asym-metric, 2D-like, profile, near 2θ ≈ 13◦
. This feature was observed consistently for the 3 compositions studied, but its origin is unknown.
Single crystals of Ce0.8Pr0.211B6 and Ce0.7Pr0.311B6
were grown by a floating-zone technique in pressurized, high-purity Ar gas, following the method described in Ref. 19. Single crystal diffraction (SCD) measurements were performed on samples with volumes on the
or-der of 0.1 cm3, using the two-axis lifting detector
neu-tron diffractometer 6T2 (LLB) at an incident wavelength
λ = 2.354 ˚A. Second-order contamination was suppressed
by a PG filter inserted on the incident beam. A Soller
TABLE I: Refined nuclear structure parameters of CexPr1−xB6.
Ce concentration T (K) a (˚A) xB
0.2 9.9 4.1416(2) 0.1984(5)
0.4 10.0 4.1435(2) 0.1990(5)
-5000 0 5000 10000 15000 30 40 50 60 70 80 Yobs Ycalc Yobs-Ycalc Bragg position In te n si ty (a rb . u n it s) 2! (degree) Ce 0.8Pr0.2B6 " = 0.24266 nm T = 8 K
FIG. 2: (Color online) Refinement of the neutron diffraction pattern of Ce0.8Pr0.2B6 measured in the paramagnetic phase at T = 8 K (Bragg reliability factor RB = 0.017).
200 300 400 500 600 700 10 20 30 40 50 60 70 80 90 Ce0.2Pr0.811B 6 Ce0.4Pr0.611B 6 Ce0.8Pr0.211B 6 In te n si ty (a rb . u n it s) 2! (degree)
FIG. 3: (Color online) Expanded plot of the neutron diffrac-tion patterns of CexPr1−xB6 measured in the paramagnetic phase for (from top to bottom) x = 0.2 (T = 9.9 K), 0.4 (10.0 K), and 0.8 (8.0 K).
collimator was placed before the counter to both reduce
background and improve Q resolution. The samples
were cooled down to a minimum temperature of 1.5 K in an Oxford Instruments cryomagnet. An Air Liquide
3He-4He dilution insert was further utilized for
measure-ments on Ce0.8Pr0.2B6 down to 100 mK. High-field
re-sults for Ce0.7Pr0.3B6 were discussed briefly in Ref. 13,
and a more complete account for the two compositions x = 0.7 and 0.8 will be reported in a forthcoming paper. Here we focus on the results obtained in zero-field for both powder and single-crystal materials.
III. POWDER DIFFRACTION RESULTS
For these measurements, the samples were first cooled
down to Tmin≈ 1.4 K, then heated by steps of 0.5 K to
T ≈ 10 K > TN. The low-angle part of the diffraction
patterns measured at Tminis presented in Fig. 4. For x =
0.2 and 0.4, one notes the existence of two sets of mag-netic satellites. Their positions can be indexed using the
same type of magnetic k vectors previously identified4in
500 1000 1500 2000 20 25 30 Ce 0.2Pr0.8B6 Ce0.4Pr0.6B6 Ce0.8Pr0.2B6 In te n si ty (a rb . u n it s) 2! (degree) T = 1.4 K
FIG. 4: (Color online) Evolution of the low-angle magnetic satellites at T = 1.4 K in CexPr1−xB6as a function of compo-sition. Intensities for each sample have been normalized with respect to the nuclear Bragg peaks (for clarity, each curve has been shifted upward by 500 relative to the previous one).
500 600 700 800 900 32 36 40 44 48 Yobs Ycalc (k IC1) Ycalc (k IC2) In te n si ty (a rb . u n it s) 2! (degree) Ce 0.2Pr0.8B6 " = 0.24226 nm T = 1.4 K
FIG. 5: (Color online) Diffraction pattern measured at T = 1.4 K for x = 0.2: comparison of refinements taking the mag-netic wave vector to be either kIC1or kIC2.
the incommensurate [kIC1= (1/4−δ, 1/4, 1/2)] and
com-mensurate [kC = (1/4, 1/4, 1/2)] ordered phases of pure
PrB6(hereafter, the different magnetic phases are termed
according to Kobayashi et al.20). The Bragg peaks
as-sociated with the two components are close together, but still clearly separated within experimental resolu-tion. Refinements yield values of δ equal to 0.0394(6) and 0.0278(5) for x = 0.2 and 0.4, respectively, to be
compared to δ ≈ 0.05 for pure PrB6 in Ref. 4. Ce
sub-stitution thus produces a steady, and rather pronounced, reduction of the incommensurability in the Pr-rich com-pounds. An alternative refinement was also tested using
a wave vector kIC2= (1/4−δ′, 1/4−δ′, 1/2). The doublet
of peaks at the lowest scattering angle (000±
satellites)
is again reproduced satisfactorily, yielding δ′
= 0.0196(3) for x = 0.2. On the other hand the model fails to account
for the groups of satellites located at 2θ ≈ 31.5◦ and
46.5◦ (Fig. 5), and the magnetic R-factors for both the
incommensurate and commensurate components degrade significantly (19.5 and 15, respectively) as compared to
the previous refinement using kIC1 (16 and 12.5). The
first model is thus clearly favored for this composition, and the same holds true for x = 0.4.
For x = 0.8, the magnetic peak intensities displayed in Fig. 4 are strongly reduced, and the double-peak struc-ture is no longer resolved, even for the strongest
satel-lite near 2θ = 20.6◦. However, the shape (and width)
of the peak, as well as its temperature dependence (see below), still point to the existence of two distinct, C
and IC, components. As above, all refinements were
performed assuming either kIC1= (1/4 − δ, 1/4, 1/2) or
kIC2= (1/4 −δ′, 1/4 −δ′, 1/2), but here the experimental
accuracy was not sufficient to discriminate between the
two solutions. The values obtained for δ and δ′
(0.021(3)
and 0.011(2), respectively, for T = 1.4 K) verify δ′
≈ δ/2,
as expected if the refinement is dominated by the 000±
satellite, which is insensitive to the type of k vector cho-sen. In the following, we retain the latter solution (in-commensurate component oriented along h110i), which is supported by the single-crystal results presented in Section IV 1 below. Extra satellites associated with the
second type of wave vector, k′
C = (1/4, 1/4, 0),
indica-tive of the so-called “double-k–k′
” structure reported in
Ref. 1 for phase III of pure CeB6, could not be detected
in the present NPD measurement. It will be shown in the next section that these extra reflections actually ex-ist, but with intensities too weak to be detected in the powder data.
The temperature evolution of the lower two groups of
satellites displayed in Figs. 6(a) and 6(b) for Ce0.4Pr0.6B6
indicates that the IC and C components decrease simul-taneously on heating up to ≈ 4 K. Above 5 K, the inten-sity of the commensurate component drops more steeply
whereas the incommensurate satellite 000± in Fig. 6(a)
moves to lower scattering angles. This shift, however, cannot be the result of an increase in δ, as one might think at first [Fig. 7(a)]: if it were the case, the
well-defined 101− satellite, occurring on the right side of the
C peak in Fig. 6(b), should move to larger scattering an-gles as depicted schematically by the arrows in Fig. 7(b). Experimentally, we instead observe a transfer of
inten-sity from the IC1 satellites at 31.5 and 32.5◦
to the
in-termediate region near 32.1◦
. This can be explained, as represented in Fig. 7, by ascribing the latter signal to a new magnetic structure, still incommensurate, but with
a wave vector of the form (1/4 −δ′
, 1/4 −δ′
, 1/2). Our re-sults thus support the existence, over a limited
tempera-ture range below TN, of a distinct magnetic phase, whose
incommensurate component is oriented along the [110] direction. It is worth noting that the existence of this phase, hereafter denoted IC2, was previously reported
from bulk measurements11 for an intermediate
composi-tion x = 0.3.
In Ce0.8Pr0.2B6(Fig. 6), the center of mass of the peak
doublet shifts to lower angles with increasing tempera-ture, indicating a reduction in the relative weight of the C component. No direct evidence is found, however, for the IC–C first-order phase transition at T = 1.7 K observed
by Nagai et al.,21and confirmed by the single-crystal
re-sults presented hereafter in Section IV 1 for the same Ce concentration. However, the comparison of patterns
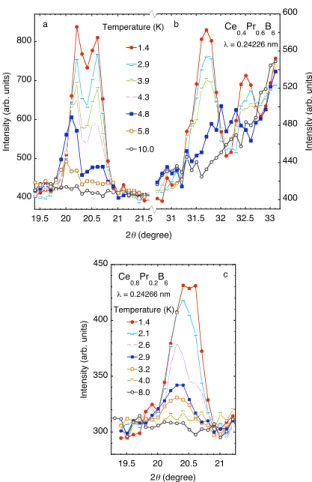
400 500 600 700 800 19.5 20 20.5 21 21.5 1.4 2.9 3.9 4.8 10.0 4.3 5.8 In te n si ty (a rb . u n it s) Ce 0.4Pr0.6B6 Temperature (K) 31 31.5 32 32.5 33 400 440 480 520 560 600 In te n si ty (a rb . u n it s) Ce 0.4Pr0.6B6 ! = 0.24226 nm 2" (degree) a b 300 350 400 450 19.5 20 20.5 21 1.4 2.1 2.6 3.2 4.0 2.9 8.0 In te n si ty (a rb . u n it s) 2! (degree) Ce 0.8Pr0.2B6 " = 0.24266 nm Temperature (K) c
FIG. 6: (Color online) Temperature dependence of the lower-angle magnetic satellites (a): 000±
, and (b): 101− , 011−
in Ce0.4Pr0.6B6; (c): 000± in Ce0.8Pr0.2B6. Data for some in-termediate temperatures have been omitted for clarity
(a) (b) (c) IC1 IC2 C C IC2 IC1 0 1 b* a* 100 1 2 C IC2 IC1 0 1 b* a* 010 1 2
FIG. 7: (Color online) Schematic representation (incommen-surate components not to scale) of 3 different regions of the l = 1/2 plane in reciprocal space, showing the position of the Bragg satellites associated with kC, kIC1, and kIC2. Panel (a) (000+ reflections) corresponds to the scattering angle range plotted in Fig. 6(a), panels (b) (101− reflections) and (c) (011−
reflections) to that plotted in Fig. 6(b).
measured at T = 2.6 K after heating from 1.4 K or cool-ing from the paramagnetic phase (Fig. 8) reveals a sizable difference in the magnitude of the commensurate compo-nent, which might be connected with the irreversibility at this transition.
In view of the strong similarities between the present results for x = 0.2 and 0.4 and those reported earlier
by Burlet et al.4 for pure PrB
300 350 19.5 20 20.5 21 T up T down In te n si ty (a rb . u n it s) 2! (degree) Ce 0.8Pr0.2B6 " = 0.24266 nm
FIG. 8: (Color online) Comparison of the lower-angle satel-lites at T = 2.6 K measured upon heating and cooling. The arrow indicates the position of the commensurate peak.
0 500 1000 1500 Yobs Ycalc Yobs-Ycalc In te n si ty (a rb . u n it s) 2! (degree) Ce 0.2Pr0.8B6 " = 0.24226 nm T = 1.4 K Nuc IC1 C 250 500 750 Yobs Ycalc Yobs-Ycalc In te n si ty (a rb . u n it s) Ce 0.4Pr0.6B6 " = 0.24226 nm T = 1.4 K Nuc IC1 C 100 200 300 400 500 10 20 30 40 50 60 70 80 90 Yobs Ycalc Yobs-Ycalc In te n si ty (a rb . u n it s) 2! (degree) Ce 0.8Pr0.2B6 " = 0.24266 nm T = 1.4 K Nuc IC2 C
FIG. 9: (Color online) Expanded view of the powder diffrac-tion patterns measured at T = 1.4 K for CexPr1−xB6 (x = 0.2, 0.4 and 0.8), showing the refinement of the magnetic peaks.
the structures associated with the C and IC1 magnetic components are of the same type here as in the latter compound, namely planar, noncollinear, double-k tures. The real-space description of the different struc-tures given in Ref. 4 is based on the extra assumption that the moments at all Pr sites are equal, and can be expressed as
mC(r) = RC
h
cos(k(1)C · r)ˆu1+ sin(k
(2) C · r)ˆu2 i , mIC1(r) = RIC1 h
cos(k(1)IC1· r)ˆu1+ sin(k(2)IC1· r)ˆu2
i ,(1) where ˆ u1 = 1 √ 2(1, −1, 0), ˆ u2 = √1 2(1, 1, 0) (2)
are orthogonal unit vectors in the (001) plane. The (1) superscripts denote the k vectors defined above, and the (2) superscripts those obtained by changing the sign of the second component.
Regarding phase IC2, evidence has been found very
recently that it is indeed single-k.22,23 This question,
however, is irrelevant to the present zero-field study, since diffraction experiments performed without an ex-ternal symmetry-breaking field cannot discriminate
be-tween single-k and multi-k structures.9For convenience,
all intensity refinements were thus carried out for the
single-k case, i.e. with the magnetic moment simply
given by
mλ(r) = Rλcos(k
(1)
λ · r)ˆu1 (3)
with λ = {C, IC1, IC2}. In these calculations, each com-ponent was treated separately, i.e. assuming that its magnetic intensity originates from the entire sample
vol-ume. The corresponding refinements for T = Tmin are
shown in Fig. 9, and the parameters from the fit are col-lected in Table II. It can be noted that the C component is larger than the IC1 component for x = 0.2, but smaller for x = 0.4. This is in line with the suppression of the lock-in transition with increasing Ce content observed in
bulk experiments.11
The temperature dependences of the IC components of the k vectors and of the magnetic Fourier
compo-TABLE II: Refined parameters δ and R and average magnetic moments m in CexPr1−xB6 at Tmin= 1.4 K calculated using the assumptions discussed in the text. Values for R and m are given in units of Bohr magnetons
x δ[δ′
] RC RIC1[RIC2] m
0.2 0.0394(6) 1.37(6) 1.24(7) 1.85(9)
0.4 0.0278(5) 1.08(8) 1.25(8) 1.65(11)
0.020 0.025 0.030 0.035 0.040 0.0 0.4 0.8 1.2 1.6 2.0 0.020 0.025 0.030 0.035 0.040 0.045 kIC1 kIC2 1 2 3 4 5 6 7 Temperature (K) RIC1 R C RIC2 0.0 0.4 0.8 1.2 1.6 2.0 1 2 3 4 5 6 7 Temperature (K) b a d c Ce 0.2Pr0.8B6 Ce 0.4Pr0.6B6 !, ! ' (r. l. u ) 0.004 0.006 0.008 0.010 0.012 0.014 1 1.5 2 2.5 3 Temperature (K) 1 1.5 2 2.5 3 3.5 0 0.2 0.4 0.6 0.8 Temperature (K) R ( B oh r ma g n e ton ) R ( B oh r ma g n e ton ) Ce 0.8Pr0.2B6 !, ! ' (r. l. u ) !' (r. l. u ) R ( B oh r ma g n e ton ) e f
FIG. 10: (Color online) Temperature dependence of the in-commensurate parameters δ and δ′(left) and of the magnetic Fourier components (right) derived from the refinements of the powder diffraction patterns for CexPr1−xB6(x = 0.2, 0.4, 0.8). Closed (open) symbols represent data measured upon heating (cooling).
nents R derived from the refinements are summarized
in Fig. 10. The changes in δ and δ′ are almost
negligi-ble for x = 0.2, slightly more pronounced for x = 0.4. For x = 0.8, the effect is difficult to ascertain because of the overlap between the two satellites, but the observed
increase in δ′
above 2.6 K is consistent with the single-crystal data presented in Section IV. Comparing panels
(b) and (d) in Fig. 10, one notes a reduction of TN by
about 1 K (from ≈ 7.5 to ≈ 6.5 K) between x = 0.2 and
0.4, in fair agreement with bulk measurements.11The
ac-curacy of the present estimate is however limited because neutron intensities, being proportional to the square of the magnetic moment components, become quite weak
on approaching TN.31 Above 5 K, the refinements
indi-cate that the IC2 phase dominates, but that the original
kC and kIC1 components are still present. At
tempera-tures closer to the transition, it becomes difficult to deter-mine the relative fractions of the two IC phases because the refinement is dominated by the strongest satellites
000±, which are compatible with both k
IC1 and kIC2.
For x = 0.8 (Fig. 10(f), the C component is suppressed more rapidly on heating than the IC component, with most of the variation taking place below 2.5 K.
To estimate the magnitude of the average rare-earth magnetic moments, we will ascribe the coexistence of
500 600 700 T = 9.9 K high T T = 1.4 K In te n si ty (a rb . u n it s) Ce 0.2Pr0.8B6 -50 0 50 10 15 20 25 30 35 40 45 I(9.9 K) – I (high T) + 35 In te n si ty d if fe re n ce 2! (degree)
FIG. 11: (Color online) Diffuse magnetic signal in Ce0.2Pr0.8B6 at different temperatures. The “high T ” data (see text) have been corrected for a nuclear diffuse background of 35 counts, which does not exist at low temperature. This background was subtracted from the data at T = 9.9 K to estimate the magnetic diffuse scattering (lower plot).
the C and IC1 signals to different regions of the sample, rather than to a rather improbable structure involving these Fourier components simultaneously. This view is supported by the fact that, in single-crystal samples, the latter structures occur in different temperature ranges and are separated by a magnetic phase transition. Since the relative volume fractions are unknown, it was fur-ther assumed that the magnetic moments m have the same value in the two phases. The resulting values are
listed in Table II for Tmin = 1.4 K, together with the
parameters derived from the refinements. For x = 0.2 and 0.4, the moments are rather large and extrapolate
to 2.05 µB at x = 0, as compared to mPr= 1.2 ± 0.1µB
obtained in previous single-crystal measurements for the
C phase of pure PrB6.8 On the other hand, this value
agrees quite well with that (2.0 µB) expected for the Γ5
ground state of Pr3+. For x = 0.8, the refined moment
is smaller than that extrapolated from the Pr-rich
com-positions (1.05 µB), and than the value (1.57 µB)
ex-pected for the Γ8 ground state of Ce3+. This effect is
likely due to Kondo fluctuations of the Ce ions. How-ever, the moment reduction is much less pronounced than that derived from the single-crystal data of Refs. 1 and 8
(mCe= 0.28±0.06 µB). The reason for this disagreement
is presently unknown.
Finally, it is worth mentioning that, for x = 0.2 and 0.4, the magnetic background at low scattering angles in-creases substantially with increasing temperature. This effect is particularly visible in the region of the first mag-netic satellites (Fig. 11). The signal was found to
satu-0 100 200 300 400 500 600 1 2 3 4 5 6 7 8 I peak [19°–22°] I diff = I tot - I peak
I tot [13°–31°] In te g ra te d i n te n si ty (a rb . u n it s) Temperature (K) I diff(9.9 K)
FIG. 12: (Color online) Temperature dependence of the inte-grated intensities of the magnetic Bragg (circles) and diffuse (squares) components in Ce0.2Pr0.8B6 at low-angles.
rates near TN, then to remain practically constant up to
10 K. The nuclear background was estimated by adding up data measured at several temperatures collected dur-ing the initial cool down of the sample below 150 K. Apart from an extra diffuse nuclear background of 35 counts (angle independent in this 2θ range), the signal between the Bragg peaks coincides with that measured at 1.4 K. This background was subtracted from the data measured at T = 9.9 K, yielding the difference plot shown in Fig. 11 for x = 0.2. One notes a broad maximum at
2θ ≈ 17◦, which can be ascribed to short-range magnetic
correlations. This signal is centered at a significantly lower scattering angle than the magnetic Bragg
reflec-tions below TN. Its width corresponds to a correlation
length on the order of 15 ˚A. Other maxima may exist at
higher angles but the statistics on the difference signal is
not sufficient to resolve them. Below TN, the magnetic
satellites grow at the expense of the short-range signal as demonstrated in Fig. 12, where the intensity integrated between 13 and 31 degrees in 2θ is seen to exactly balance the growth of the Bragg peaks. The existence of magnetic
fluctuations persisting up to about 3TN in PrB6was
de-tected previously by11B NMR experiments.24
IV. SINGLE-CRYSTAL DIFFRACTION RESULTS
1. x = 0.8
For this composition, a first-order transition is known
to take place at TIII= 1.7 K.21 Below the transition, the
magnetic order is found to be of the same type as in phase
III in CeB6, namely a noncollinear 2k-k′ commensurate
structure described by the four wave vectors k(1,2)C =
(1/4, ±1/4, 1/2) and k′(1,2)C = (1/4, ±1/4, 0). Magnetic
peaks associated with the different Fourier components have been observed at 85 mK and 140 mK (Fig. 13), and
no significant change occurs in the intensity of the kC
satellite up to 1.05 K (see left frame). It can be noted
0 200 400 600 (1/2, 1/4, l) T = 1.05 K (1/2, l, l) T = 85 mK 0.24 0.25 0.26 N e u tro n i n te n si ty (cn ts / 4 se c. ) Ce 0.8Pr0.2B6 l (r.l.u.) -0.5 -0.25 0 0.25 0.5 (-3/4,-3/4,0) T = 140 mK 0 20 40 60 80 N e u tro n i n te n si ty (cn ts / 5 se c. )
Rocking angle (degree)
FIG. 13: (Color online) Commensurate magnetic satel-lites in phase III of Ce0.8Pr0.2B6, demonstrating the exis-tence of the wave vectors kC = (1/4, 1/4, 1/2) (left) and k′C= (1/4, 1/4, 0) (right). -0.01 0 0.01 0 200 400 600 800 N e u tro n i n te n si ty (cn ts / 1 6 se c. ) h (r.l.u) T = 1.9 K 3.3 K (0.242+h, -0.242+h, 3/2) 0 400 800 1200 1600 0.235 0.240 0.245 0.250 2.0 2.3 2.6 2.9 3.0 3.1 3.2 3.3 3.4 3.6 N e u tro n i n te n si ty (cn ts / 1 9 se c. ) T (K) Ce 0.8Pr0.2B6 h (r.l.u.) (h, h, 1/2) a b
FIG. 14: (Color online) Temperature dependence of two in-commensurate magnetic peaks, [1/4 − δ′] [1/4 − δ′] 1/2 and [1/4−δ′
][−1/4+δ′
]3/2 in Ce0.8Pr0.2B6. Scans were performed along orthogonal directions to emphasize (b) the existence of a single satellite (IC2 phase) from 1.9 to 3.3 K, and (a) the variation of the δ′
parameter.
that the relative magnitude of the k′
C peaks is strongly
reduced in comparison with CeB6,1 which explains why
it was not detected in the powder diffractograms (Sec-tion III). In the latter compound, the observa(Sec-tion of two
different wave vectors kC and k′C has been shown1 to
reflect the existence of two rare-earth sublattices in the (1/2, 1/2, 1/2) AFQ phase, which precludes a simple AF
stacking of the 2k planes of the type existing in PrB6.
This weakening of the k′
C component therefore points to
a disruption of the AFQ order associated with the Ce sites as a result of Pr substitution.
Above TIII, the structure becomes incommensurate
(the variation of the magnetic signal could not be traced across the transition because of temperature instabili-ties). At T = 2.0 K, i.e. just above the transition to phase III, satellites are observed close to Q = (1/4, ±1/4, 1/2) and (1/4, ±1/4, 3/2) in agreement with the powder
mea-surements. Here, however, the data unambiguously
show that the structure is IC2-type, with the
mag-netic wave vector k′
inc = (1/4 − δ
′
, 1/4 − δ′
, 1/2), since only one peak is observed in the (ξ, ξ, 0) scan through
Q = (1/4 − δ′, −1/4 + δ′, 3/2) shown in Fig. 14(b).
0 1 2 3 0.006 0.008 0.010 2 2.4 2.8 3.2 3.6 In te g ra te d i n te n si ty (a rb . u n it s) !! (r. l. u .) Temperature (K) Ce 0.8Pr0.2B6 (1/4-! !, 1/4-! !, 1/2)
FIG. 15: (Color online) Temperature dependences of the incommensurate parameter δ′
(upper part) and of the inte-grated intensity of the magnetic peaks shown in Fig. 14(a) (lower part) for Ce0.8Pr0.2B6.
from the position of the Bragg peak in the left frame, is 1/4 − 0.242 = 0.008(1) at T = 2 K, in fair agreement with the value of 0.011(2) reported above for powder. With increasing temperature, the peak position remains unchanged up to 2.9 K, then shifts gradually to lower h
values. Accordingly, the incommensurate parameter δ′
increases from 0.008 to about 0.010 near TN = 3.5 ± 0.05
K (Fig. 15). This evolution is quite similar to that dis-played in Fig. 10(e), confirming that the effect was not an artifact of the Rietveld refinement. We note that the form
of the wave vector remains k′
inc= (1/4 − δ
′
, 1/4 − δ′
, 1/2) up to the N´eel temperature, as evidenced by the single
satellite still found at T = 3.3 K <∼ TN (right frame in
Fig. 14). The change occurring above 2.9 K may corre-spond to the crossing of the AFQ phase boundary
de-termined from bulk experiments21 (see Fig. 18). The
important point here is that the IC2 order is found to
persist all the way down to TIII implying that, in the
phase diagram of Ref. 21, an additional transition line must exist at finite field between this magnetic phase and the purely AFQ region (phase II), similar to that detected under pressure by the same authors. Contrary to the powder data (Section III), no magnetic signal
cor-responding to the commensurate wave vector kcom was
observed on the single crystal in the temperature range
2 K ≤ T ≤ TN. Possible reasons for this difference will
be discussed in Section V.
2. x = 0.7
For the composition x = 0.7, the results reported in Ref. 13 indicated that the magnetic structure remains
incommensurate, with a wave vector kIC1 = (1/4 −
δ, 1/4, 1/2), down to T = 1.7 K. This result is confirmed by the present measurements. However, the temperature variation of δ is found to saturate below 2.3 K, rather
than increasing further as reported previously.13 As
dis-played in Fig. 16, a moderate, continuous decrease of δ
0.024 0.022 0.020 0.018 0.016 0.226 0.228 0.23 0.232 0.234 1.5 2 2.5 3 3.5 4 Mignot et al. this work Tanaka et al. (x-rays)
1 /4 - ! , 1 / 4 -! ' (r. l. u .) Temperature (K) Ce 0.7Pr0.3B6 IC1 IC2 TIC1 ! !' ! , ! ' (r. l. u .)
FIG. 16: (Color online) Temperature dependence of the in-commensurate parameters δ and δ′
in phases IC1 and IC2 of Ce0.7Pr0.3.B6. Circles: neutron data from Ref. 13 and this work; squares: x-ray data from Ref. 14.
0.22 0.23 0.24 0.25 0.22 0.23 0.24 0.25 h (r.l.u) IC2 IC1 IC1 k (r. l. u ) (!, !, 3/2) (!, 1/4, 1/2) -0.25 -0.24 -0.23 -0.22 0.22 0.23 0.24 0.25 h (r.l.u) IC2 IC1 IC1 k (r. l. u ) (!, !–0.48, 3/2) 0 100 200 300 400 500 0 20 40 60 80 100 0.22 0.23 0.24 0.25 In te n si ty (co u n ts / 2 0 se c. ) ! (r.l.u) IC2 IC1 (!, !, 3/2) (!, 1/4, 1/2) H = 0 0 50 100 150 200 250 0.22 0.23 0.24 0.25 In te n si ty (co u n ts / 2 0 se c. ) ! (r.l.u) H = 0 (!, !–0.48, 3/2) IC1 IC2 a b c d Ce 0.7Pr0.3B6
FIG. 17: (Color online) Scans through magnetic satellites in phases IC1 (T = 2 K [c] and 1.7 K [d]) and IC2 (T = 3.8 K) of Ce0.7Pr0.3B6: (left) along the direction of the incommensu-rate component; (right) perpendicular to it. The plots demon-strate the existence of two satellites in phase IC1 and a single satellite in phase IC2. The directions of the scans are depicted in the upper frames; although the (ξ, ξ − 0.48, 3/2) scan does not go exactly through the position of the IC2 satellite, the effect on the peak position is not significant within experi-mental resolution.
takes place on heating up to the first-order transition at
TIC1 = 3.5 K. The nature of this transition has been
studied in greater detail and it turns out that it corre-sponds to a change in the magnetic structure from IC1 to IC2. This effect was missed in the previous measure-ments because of instrumental resolution effects: in a scan along (h, 0, 0) going through the position of the IC1 (1/4 − δ, 1/4, 1/2) satellite, a peak is always observed, even after the structure changes to IC2, whose position does not represent the true value of the incommensu-rate wave vector. Unambiguous evidence for the distinct
characters of the magnetic phases below and above TIC1
re-0 2 4 6 8 10 0.0 0.2 0.4 0.6 0.8 1.0 T N T C T III T Q T IC1 T e mp e ra tu re (K) Ce concentration PrB 6 CeB6 III II IC1 IC1 C Para IC2 Ce 1-xPrxB6
FIG. 18: (Color online) Composition–temperature phase di-agram of CexPr1−xB6. Transition temperatures are taken from Refs. 11 and 21 (x = 0.8), and the labels for the differ-ent phases refer to the structures derived in this work.
spectively, in the scans of Fig. 17(d), as illustrated in frames (a) and (b). In phase IC2, no significant variation
of δ′
is observed up to the N´eel temperature.
In summary, the main difference between the two Ce-rich compositions is the appearance of the IC2 phase for x = 0.7, as well as the suppression of the
commensu-rate phase III reminiscent of pure CeB6. The existence
of a finite TQ in zero field is not clearly established for
that composition, although it can be suggested from the observation of an (1/2, 1/2, 1/2) component in the x-ray
experiments at the lowest temperature (T = 1.5 K).14
V. DISCUSSION
A phase diagram summarizing the different magnetic phases investigated in this work is presented in Fig. 18. In the Pr-rich composition range, the main changes pro-duced by Ce substitution are i) a slow decrease of the N´eel temperature, ii) the appearance, in an
intermedi-ate temperature interval between TIC1 and TN, of a new
magnetic phase with the IC component of its k vector ori-ented along a twofold axis, iii) in phase IC1: a rather pro-nounced reduction of the incommensurability parameter δ, and iv) a moderate suppression of the C component. Points i) and ii) are in agreement with the composition– temperature phase diagram of Ref. 11. The new phase IC2 can be related to the high-field properties of pure
PrB6, in which a similar phase (also denoted IC2) exists25
above ≈ 7 T for H k h111i. That phase was found to
oc-cur at lower fields upon La dilution,26 and to exhibit the
same type of IC wave vector, (1/4 − δ′
, 1/4 − δ′
, 1/2), as
in the present case.23 It is therefore likely that Ce
sub-stitution produces a dilution effect, similar to that of La, which eventually stabilizes phase IC2 all the way down to H = 0.
Regarding the C component, the situation is rather confused. Whereas the phase diagram in Fig. 18 suggests
that the C phase is strongly suppressed by Ce
substitu-tion, with TC dropping to zero above x >∼ 0.1, evidence
for a C component is seen in the NPD patterns for both compositions x = 0.2 and 0.4, with just a minor decrease in its magnitude at the higher concentration. Moreover, there is no indication of a lock-in transition and the re-flections associated with the C wave vector coexist with the IC1 or IC2 component practically up to the tran-sition into the paramagnetic state. Tests performed on
PrB6 powder showed that, even in that pure compound,
the C component can be traced at all temperatures below
TN, in contrast to the sharp lock-in transition observed
on single crystals.4,25 The reason for this discrepancy is
presently unclear. It can be noted that the problem is specific to the commensurate component and the
tran-sition at TC, whereas consistent results are obtained for
TN and TIC1. Temperature irreversibility may play a role,
since all measurements were performed after cooling the
sample down to Tmin, but the sequence of two different
IC phases observed as a function of temperature, both coexisting with the C component, is difficult to reconcile with this view. One may suspect that the delicate bal-ance of interactions controlling the competition between the C and IC phases is easily disturbed by defects or in-homogeneities, which are more likely to occur in the case
of large powder samples. However, even for PrB6 single
crystals, differences have been found between samples of
the same origin, as in Ref. 27 where TC is clearly
visi-ble in the thermal conductivity, but not in the electrical resistivity. Further investigations are needed in order to solve this problem.
On the Ce-rich side, one notes a strong reduction in the intensity of the magnetic signal for x = 0.8, accom-panied by a further decrease of the incommensurability parameter. From the SCD data, it is clear that the
struc-ture prevailing below TN down to the lower transition
temperature TIIIis of IC2 type. The fact that this
mag-netic state characteristic of PrB6can survive for 80% Ce
concentration is quite remarkable and implies that Pr– Pr interactions are dominant over a wide composition
range. On the other hand, the observation of k′-type
(1/4, 1/4, 0) satellites in phase III is the fingerprint of Ce
order occurring below TQ, as in pure CeB6. Ce0.8Pr0.2B6
thus represents a crossover situation where Ce and Pr fea-tures coexist. By comparing the neutron data with the phase diagram of Ref. 21, one is led to the conclusion that
the crossing of the AFQ line at TQ ≈ 2.9 K does not
pro-duce any notable change in the magnetic satellites, and that the phases denoted IC2 and IC2’ are thus associated with identical, or very similar, magnetic structures.
For x = 0.7, the AFQ ordering temperature, if any,
is located below 2 K. This suppression of TQ is
as-cribed to the competition with the IC magnetic order, which is enhanced for this composition in comparison
with x = 0.8.21 At higher temperature, two distinct IC
magnetic phases occur successively on cooling. As noted above, each of them is closely related to a counterpart
role here in determining the type of order. In Ref. 12, it was argued from magnetization data measured in fields as low as 0.1 T, that the anisotropy in phase IC2 is weak
and that a domain with the “χ⊥” configuration is
real-ized. The IC2–IC1 transition can be traced back to the growing effect of higher-order terms in the expansion of the free energy, due to QP interactions, as temperature
decreases. In PrB6, the first-order character of the
tran-sition at TN has been argued to result from a competition
between (anisotropic) exchange and QP interactions.4In
the present case, the transition at TIC1 is clearly
first-order, whereas that at TN looks second-orderlike. This
further supports the idea that QP interactions do not play a major role in phase IC2 but become significant in phase IC1. AFQ fluctuations may be significant even at
temperatures higher than the extrapolated TQ at H = 0
and, accordingly, affect the magnetic order setting in
be-low TIC1.
It is particularly interesting, in this connection, to compare the neutron results for x = 0.7 with
nonreso-nant XRD data obtained on the same compound.14 In
that study, satellites were observed at incommensurate positions in phase IC1 at T = 1.5 K. Their intensities decrease gradually on heating and vanish below approxi-mately 3 K. No superstructure was then detected in phase IC2. The important point is that a close relationship ex-ists between magnetic and charge ordering in this regime since the wave vector derived from the XRD peaks is pre-cisely twice that of the ICM order observed by neutrons:
kQ = (0.462, 1/2, 0)
= 2(0.231, 1/4, 1/2) − τ001≈ 2kM − τ001 (4)
This observation is further substantiated by the good agreement seen in Fig. 16 between the temperature dependence of the incommensurate component δ derived from the x-ray results using Eqn. 4 and that measured by neutron diffraction. In Ref. 14, Tanaka et al. ana-lyzed the wave vector dependence of the intensities of different IC satellites in terms of the structure factors for quadrupole and hexadecapole moments, showing that their data imply an incommensurate multipole (ICµ) ordered state in phase IC1. Whereas there exists a clear interplay between magnetic and multipole orders occurring in this phase, the exact nature of the primary
order parameter remains an open question. At the
minimum temperature of 1.5 K, additional x-ray peaks are observed at positions (n/2, n/2, n/2), reflecting an extra antiferro-multipolar component, which the authors
identify with the ground state of the system. It is
tempting to ascribe its appearance to the crossing of
the TQ transition line, as shown in the phase diagram
of Kishimoto et al.12 Unfortunately, this range of
tem-perature was not accessible in our neutron experiments. In view of the striking similarity between the magnetic
properties of phase IC1 for the present composition
and in PrB6, it would be worthwhile to perform XRD
experiments in order to see if a similar ICµ order also exists in the latter compound.
VI. CONCLUSION
The work presented in this report provides detailed in-formation on the nature of the different ordered states
occurring in CexPr1−xB6 solid solutions as a function
of the rare-earth composition. This is important from
the point of view of multipole interactions because Oxy
-type quadrupolar couplings are known to play a major role throughout the series, but the long-range ordered AFQ state exists only on the Ce-rich side, where oc-tupole interactions are significant. As a result, quite dif-ferent magnetic phases are stabilized in one or the other
case. The 2k-k′ phase III is only observed at
tempera-tures below the AFQ transition and, in cases when mag-netic order sets in above this transition, for x = 0.7 and 0.8, the corresponding structure is incommensurate and clearly dominated by Pr-Pr interactions. The compari-son of neutron and x-ray diffraction results proved quite useful in the case of the x = 0.7 composition since it revealed a perfect matching between the incommensu-rate multipole and magnetic wave vectors, which con-firms that both phenomena are intimately related. This approach should be extended to other concentrations,
in-cluding pure PrB6. The sequence of two incommensurate
phases, IC2 (single-k) and IC1 (double-k), with decreas-ing temperature is the dominant feature for a wide range of concentrations (0.2 ≤ x ≤ 0.7). The fact that the two transition lines remain nearly parallel as a function of x suggests that the double-k structure becomes fa-vorable when the magnetic order parameter reaches a
threshold value below TN. Measurements in external
magnetic fields are essential, both to identify multi-k structures from domain repopulation effects and to study the competition between different types of order parame-ters occurring in these systems. Magnetic and transport measurements have shown that remarkably rich (H, T ) phase diagrams exist depending on composition or ap-plied pressure, but a number of phases have not yet been characterized. Experiments along this line are under way and will be reported in a forthcoming publication.
Acknowledgments
We are grateful to A. Gukasov, Ph. Boutrouille, J.-L. Meuriot, and Th. Robillard for help with the single-crystal experiments. We thank one of the Referees for useful suggestions on the presentation of the paper.
1 J. Effantin, J. Rossat-Mignod, P. Burlet, H. Bartholin, S. Kunii, and T. Kasuya, J. Magn. Magn. Mater. 47&48, 145 (1985).
2 Y. Tanaka, U. Staub, K. Katsumata, S. W. Lovesey, J. E. Lorenzo, Y. Narumi, V. Scagnoli, S. Shimomura, Y. Tabata, Y. Onuki, et al., Europhysics Letters (EPL) 68, 671 (2004).
3 O. Sakai, R. Shiina, H. Shiba, and P. Thalmeier, J. Phys. Soc. Jpn. 66, 3005 (1997).
4 P. Burlet, J. M. Effantin, J. Rossat-Mignod, S. Kunii, and T. Kasuya, J. Phys. (Paris) Colloq. 49, C8-459 (1988). 5 O. Sakai, R. Shiina, H. Shiba, and P. Thalmeier, J. Phys.
Soc. Jpn. 68, 1364 (1999).
6 K. Kuwahara, K. Iwasa, M. Kohgi, N. Aso, M. Sera, and F. Iga, J. Phys. Soc. Jpn. 76, 093702 (2007).
7 C. McCarthy, Solid State Commun. 36, 861 (1980). 8 J. Effantin, Ph.D. thesis, University of Grenoble (1985). 9 J. Rossat-Mignod, in Neutron Scattering, edited by
D. Price and K. Sk¨old (Academic Press, New York, 1987), vol. 23, Part C, p. 69.
10 Y. Kuramoto and K. Kubo, J. Phys. Soc. Jpn. 71, 2633 (2002).
11 M.-S. Kim, Y. Nakai, H. Tou, M. Sera, F. Iga, T. Taka-batake, and S. Kunii, J. Phys. Soc. Jpn. 75, 4704 (2006). 12 S. Kishimoto, A. Kondo, M. S. Kim, H. Tou, M. Sera, and
F. Iga, J. Phys. Soc. Jpn. 74, 2913 (2005).
13 J.-M. Mignot, M. Sera, and F. Iga, Physica B 383, 41 (2006).
14 Y. Tanaka, M. Sera, Y. Tabata, S. Shimomura, A. Kikkawa, K. Katsumata, F. Iga, and S. Kishimoto, Physica B 383, 39 (2006).
15 J. Rodriguez-Carvajal, Physica B 192, 55 (1993). 16 J. Rodriguez-Carvajal, Commission on Powder Diffraction
(IUCr) Newsletter 26, 12 (2001). 17 V. F. Sears, Neutron News 3, 26 (1992).
18 A. Freeman and J. Desclaux, J. Magn. Magn. Mater. 12,
11 (1979).
19 S. Kunii, Journal of the Physical Society of Japan 57, 361 (1988).
20 S. Kobayashi, Y. Yoshino, S. Tsuji, M. Sera, and F. Iga, J. Phys. Soc. Jpn. 72, 25 (2003).
21 S. Nagai, S. Ikeda, H. Iwakubo, I. Tou, M. Sera, and F. Iga, J. Phys. Soc. Jpn. 77, Suppl. A, 288 (2008).
22 J.-M. Mignot, J. Robert, M. Sera, and F. Iga, Pramana J. of Phys. (in press).
23 J. Robert, to be published.
24 S. Takagi, S. Itabashi, S. Kunii, and T. Kasuya, J. Magn. Magn. Mater. 52, 267 (1985).
25 S. Kobayashi, M. Sera, M. Hiroi, T. Nishizaki, N. Kobayashi, and S. Kunii, J. Phys. Soc. Jpn. 70, 1721 (2001).
26 M. Sera, S. Goto, T. Koshikawa, M. S. Kim, H. Tou, F. Iga, Y. Mitsukawa, and K. Kojima, J. Phys. Soc. Jpn. 74, 2691 (2005).
27 M. Sera, S. Kobayashi, M. Hiroi, N. Kobayashi, and S. Ku-nii, Phys. Rev. B 54, R5207 (1996).
28 O. Zaharko, P. Fischer, A. Schenck, S. Kunii, P.-J. Brown, F. Tasset, and T. Hansen, Phys. Rev. B 68, 214401 (2003). 29 K. Iwasa, K. Kuwahara, M. Kohgi, P. Fischer, A. Donni, L. Keller, T. C. Hansen, S. Kunii, N. Metoki, Y. Koike, et al., Physica B: Condensed Matter 329-333, 582 (2003). 30 Alternative solutions have been proposed subsequently in
Refs. 28 and 29. Their main features (2k–k′
, planar, trans-verse sine-wave character, with orthogonal moments at neighboring sites directed along {110} axes) are the same as in Effantin’s model, and the differences are not essential for the arguments discussed in this report.
31 The fact that the values of T
N from the NPD experiments are systematically higher than those derived from bulk measurements suggests a contribution from short-range fluctuations.


![FIG. 17: (Color online) Scans through magnetic satellites in phases IC1 (T = 2 K [c] and 1.7 K [d]) and IC2 (T = 3.8 K) of Ce 0.7 Pr 0.3 B 6 : (left) along the direction of the incommensu-rate component; (right) perpendicular to it](https://thumb-eu.123doks.com/thumbv2/123doknet/13238135.395183/9.892.482.831.369.649/color-online-magnetic-satellites-direction-incommensu-component-perpendicular.webp)

