HAL Id: hal-01953068
https://hal.inria.fr/hal-01953068
Submitted on 12 Dec 2018HAL is a multi-disciplinary open access archive for the deposit and dissemination of sci-entific research documents, whether they are pub-lished or not. The documents may come from teaching and research institutions in France or abroad, or from public or private research centers.
L’archive ouverte pluridisciplinaire HAL, est destinée au dépôt et à la diffusion de documents scientifiques de niveau recherche, publiés ou non, émanant des établissements d’enseignement et de recherche français ou étrangers, des laboratoires publics ou privés.
Are compound leaves more complex than simple ones?
A multi-scale analysis
Garance Koch, Gaelle Rolland, Myriam Dauzat, Alexis Bediee, Valentina
Baldazzi, Nadia Bertin, Yann Guédon, Christine Granier
To cite this version:
Garance Koch, Gaelle Rolland, Myriam Dauzat, Alexis Bediee, Valentina Baldazzi, et al.. Are com-pound leaves more complex than simple ones? A multi-scale analysis. Annals of Botany, Oxford University Press (OUP), 2018, 122 (7), pp.1173-1185. �10.1093/aob/mcy116�. �hal-01953068�
ORIGINAL ARTICLE
Are compound leaves more complex than simple ones? A multi-scale analysis.
Garance Koch1,2, Gaëlle Rolland1, Myriam Dauzat1 , Alexis Bédiée1, Valentina Baldazzi2,3,4,
Nadia Bertin2, Yann Guédon5 and Christine Granier1,5*
1 LEPSE, Univ Montpellier, INRA, Montpellier SupAgro, Montpellier, France
2 INRA, UR 1115 PSH, F-84914 Avignon, France
3 ISA, INRA, CNRS, Université Côte d'Azur, France
4 BIOCORE, Inria, INRA, CNRS, UPMC Univ Paris 06, Université Côte d'Azur, France
5 AGAP, Univ Montpellier, CIRAD, INRA, Montpellier SupAgro, Montpellier, France
Running title: Leaf area plasticity in tomato
Email address of corresponding author:
ABSTRACT
Background and Aims The question of which cellular mechanisms determine the variation in
leaf size has been addressed mainly in plants with simple leaves. It is addressed here in tomato taking into consideration the expected complexity added by the several lateral appendages composing the compound leaf, the leaflets.
Methods Leaf and leaflet areas, epidermal cell number and areas, and endoreduplication
(co-)variations were analyzed in Solanum lycopersicum cv. considering heteroblastic series in a
wild-type (Wva106) and an antisense mutant, the Pro35S:Slccs52AAS line, and upon drought
treatments. All plants were grown in an automated phenotyping platform, PHENOPSIS adapted to host plants grown in 7L pots.
Key results Leaf area, leaflet area and cell number increased with leaf rank until reaching a
plateau. In contrast, cell area slightly decreased and endoreduplication did not follow any trend.
In the transgenicline, leaf area, leaflet areas and cell number of basal leaves were lower than in
the wild-type, but higher in upper leaves. Reciprocally, cell area was higher in basal leaves and lower in upper ones. When scaled up at the whole sympodial unit, all these traits did not differ significantly between the transgenic line and the wild-type. In response to drought, leaf area was reduced with a clear dose effect that was also reported for all size-related traits, including endoreduplication.
Conclusions These results bring evidence that all leaflets have the same cellular phenotypes than
the leaf they belong to. Consistently with results reported for simple leaves, they show that cell number rather than cell size determines the final leaf areas and that endoreduplication can be uncoupled from leaf and cell sizes. Finally, they re-question a whole plant control of cell division
Key words: Solanum lycopersicum cv, compound leaf, leaflet, drought stress, cell division, cell
INTRODUCTION
The remarkable variation in leaf shape and size among plants and within a same plant fascinates many scientists working in developmental biology. Because the regulation of leaf area expansion has a prominent role in light capture, photosynthesis, transpiration and thus plant biomass production, it has been the focus of many agronomic studies. Control of leaf area expansion at the cellular and molecular levels has been investigated for years in different model plants, providing insights into the complex regulation of leaf morphogenesis (Rodriguez et al., 2014; Vanhaeren et
al., 2016). Each individual leaf is made of cells that divide and expand at different rates and
during different periods depending on species, genotypes, environmental conditions, leaf developmental stage, leaf tissue and cell type within a given tissue (Pyke et al., 1991; Donnelly
et al., 1999; Tardieu et al., 2000; Rymen et al., 2007; Skirycz et al., 2011; Wuyts et al., 2012).
The canonical cell cycle, resulting in cell division, involves a DNA duplication phase followed by mitosis. In some species, leaf cells can enter a cell cycle variant, the endoreduplication cycle in which mitosis is skipped and cells repeatedly replicate their DNA, resulting in endopolyploidy (Edgar et al., 2014). Endopolyploid cells are generally larger than others as shown in the epidermis of different organs such as leaf, stem and sepals in Arabidopsis thaliana (Melaragno et
al., 1993; Roeder et al., 2010) and the pericarp of tomato fruits (Cheniclet et al., 2005). The
correlation between ploidy and cell size depends on cell identity. It is for example weaker in the palisade mesophyll cells than in the epidermis of Arabidopsis thaliana leaves (Katagiri et al., 2016).
The respective contributions of cell division and cell expansion to final leaf size and the interrelations between these processes have been analyzed both in dicot and monocot simple leaves (Horiguchi et al., 2006; Massonnet et al., 2011; Gonzalez et al., 2012; Nelissen et al., 2016). Despite different spatial and temporal organizations of these processes, several molecular
mechanisms controlling leaf size are conserved between dicots and monocots (Nelissen et al., 2016). The final leaf size is mainly determined by its cell number rather than the mean cell size. This has been observed in plants of a same genotype grown in various environmental conditions (Granier et al., 2000 for different species), in populations of recombinant inbred lines (Ter Steege
et al., 2005 in Aegilops tauschii; Tisné et al., 2008 in Arabidopsis thaliana) and even for leaf size
variation among species (Gazquez and Beemster, 2017). A few studies have shown that the variability in leaf size according to their rank was more related to changes in cell number than in cell size (Ashby, 1948 in Ipomoea; Tisné et al., 2011 in Arabidopsis thaliana), revealing that the cell cycle also plays a role in heteroblasty. The relationship between cell number and leaf size is less clear when it is analyzed in genotypes affected in cell cycle gene expression. An increase in leaf cell number caused by the up regulation of cell cycle activator genes or by the down regulation of cell cycle inhibitor genes can coincide with an increasing, decreasing or unaffected leaf size (Hemerly et al., 1995; Autran et al., 2002, Cookson et al., 2005, Tojo et al., 2008). These results have casted doubt on the crucial role of cell cycle as the engine of organ growth leading to reconsider the organ growth theory in many reviews (Kaplan and Hagemann, 1991; John and Qi, 2008; Sablowski, 2016).
Compound leaves add further complexity with respect to simple leaves. Their morphogenesis is still subjected to debate and it is still unclear if they are reduced to the sum of their leaflets, or if they constitute an organ on their own (Champagne and Sinha, 2004). In some studies, they are seen as partially indeterminate structures that share properties with both shoots and simple leaves (Sattler and Rutishauser, 1992). In others, it is suggested that the entire compound leaf is equivalent to a simple leaf and that leaflets arise by subdivisions of a simple blade (Kaplan, 1975). Tomato leaf is used as a model for studying the genetic control of compound leaf development (Hareven et al., 1996; Champagne and Sinha, 2004). Its organization is odd-pinnate
as leaflets develop symmetrically on both sides of the rachis. In contrast to simple leaf, the contribution of cellular processes to tomato leaf area plasticity and their interactions has not been analyzed so far.
The aim of this work was to analyze the respective contributions of epidermal cell number and adaxial epidermal cell size to final area in the compound leaf of tomato, together with the extent of endoreduplication. To give insights into the cellular organization of whole leaf area, these traits were analyzed in the different leaflets of the successive leaves along a sympodial unit. This experimental protocol extended to compound leaves standard protocols previously applied to simple leaves in order to ease the comparison with previous results (Hemerly et al., 1995; Autran
et al., 2002, Cookson et al., 2006, Tojo et al., 2008, Massonnet et al., 2011, Gazquez and
Beemster, 2017). To enrich the debate on the different theories about leaf growth control, the same traits were measured in a transgenic line with reduced expression in CCS52A, a gene specifically associated with the switch from the mitotic cycle to endoreduplication in different organs (de Veylder et al., 2011). Previous studies in tomato have shown that the reduction in
CCS52A expression induces the formation of smaller plants delayed in their development, of
small fruits with smaller cells and higher cell density in the pericarp and with reduced levels of endoreduplication (Mathieu-Rivet et al., 2010). Finally, variability in leaf areas, leaflet areas and leaf cellular related traits was analyzed in plants subjected to different soil water deficit treatments monitored by the PHENOPSIS automated platform (Granier et al., 2006). This platform was used until now for studies on Arabidopsis thaliana and was modified here (mechanics and software) to host, weight and adjust soil water content of tomato plants in large pots.
Altogether, our results give insights into the organization of the tomato compound leaf at the cellular scale. They highlight the importance of considering the leaf rank along the sympodial unit when different traits are compared and clearly demonstrate that the whole compound leaf at a given rank can be summarized by one of its single leaflet for phenotyping purpose. Thanks to the large variability in tomato leaf area caused either by spatial position on the plant, genetic perturbation or drought treatments, our results bring additional evidence that leaf area is tightly related to epidermal cell number without simple direct links with other leaf size-related traits, namely cell area and endoreduplication.
MATERIALS AND METHODS
Plant material, sowing and seedlings pre-culture.
Before sowing, 147 seeds of cherry tomato plants (Solanum lycopersicum), line West Virginia
106 (Wva106), and nine seeds of an antisense mutant, the Pro35S:Slccs52AAS transgenic line
(described in Mathieu-Rivet et al., 2010) were sterilized in a solution of Barychlore (0.5 g Barychlore and 50ml ethanol 50%) during 15 min followed by three rinses with absolute ethanol and drying under laminar flow hood during at least 15 min. Seeds were sown in sterilized boxes filled with a ¼ Murashige and Skoog medium (MS including vitamins, Duchefa, MO 222) with
7.5 g sucrose L-1 and 8 g phyto-agar L-1. The pH of the solution was adjusted between 5.8 and 6
with a solution of KOH 2M and the MS medium was sterilized. Boxes were set up in a growth chamber equipped with the PHENOPSIS automaton (Granier et al. 2006) during 20 days. Light in the growth chamber was provided by a bank of cool-white fluorescent tubes and iodide
at pot height. Air vapor pressure was maintained around 0.8 kPa and temperature was set at 25°C and 20°C during day and night periods, respectively.
Fifty-two pots of 7 L were weighted before and after filling with soil (Klasmann, Substrat SP 15 %). Soil aliquots were dried to estimate the amount of dry soil and the water content in each pot at the time of filling (Granier et al., 2006). Three tomato seedlings were then put in the center of each pot and immediately irrigated with 30 mL of nutrient solution (Liquoplant rose, Plantin, dilution 4 per 1000). Day air temperature was set at 23°C. Seedlings were irrigated manually with 30 mL of nutrient solution twice a day during one week. Then, plants were thinned out, considering developmental stage homogeneity, to keep only one plant per pot. Lateral shoots were removed and flowers were shaken three times a week during the whole experiment.
Automatic adjustment of soil water content.
The PHENOPSIS automaton, so far used to host and irrigate automatically 504 pots of 250 mL mainly for Arabidopsis thaliana plants (Granier et al., 2006), was modified to manage up to 70 pots of 7 L for larger plants, here tomato. Trays set up in the growth chamber were changed to host larger pots (14 trays with 5 holes each of 18.6 cm diameter). The weighing/watering station was modified. The balance was changed to reach a higher weighing capacity (Precisa, Serie 320 XB-Modell XB10200G IP65) and the pneumatic actuator was replaced by an electric one (DS-dynatec, PCDY 136-185°). It was linked to a container filled with nutrient solution (Liquoplant rose, Plantin, dilution 4 per 1000). The software was modified to adapt the automaton displacements to this new configuration.
leaf was fully emerged, i.e. when all leaflets were unfolded. From this stage, five different watering regimes, stable over time, were imposed to Wva106 plants until the end of the
experiment (seven plants per regime): 0.6, 0.9, 1.2, 1.4 and 1.6 g H2O g−1 dry soil respectively
(Fig. 1). At the same stage, 14 Wva106 plants were submitted to a more severe water deficit induced by cessation of irrigation until the end of the experiment (pots were still weighted daily to follow the decrease in soil water content over time as shown in Fig. 1). The three pots with the
transgenic lines were maintained at a soil water content of 1.4 g H2O g−1 dry soil until the end of
the experiment.
Measurement of leaf size-related traits.
For each individual plant, leaf size-related traits were measured when all compound leaves of the first sympodial unit had reached their final size (as checked by measuring the length of the last emerged leaflet). At the time of harvest, even the most-stressed plants did not show any signs of dieback.
For each plant, the first sympodial unit was composed of a maximum of 13 compound leaves (Fig. 2A). The first two compound leaves could not be measured because of senescence for all watering regimes. For the well-watered Wva106 plants, the third compound leaf was composed of 5 leaflets while all the others were composed of 7 leaflets (Fig. 2A, B). For the Wva106 plants grown in soil water deficit regimes, the fourth compound leaf was sometimes composed of 5
leaflets only. For the Pro35S:Slccs52AAS transgenic line, the third, the fourth, the fifth and some of
the sixth compound leaves were composed of 5 leaflets, while all others were composed of 7 leaflets.
Then, areas of individual leaflets (cm²) were measured on the leaf scans with the ImageJ image analysis software (Wayne Rasband, National Institutes of Health, USA). For each compound leaf, whole leaf area was calculated as the sum of their leaflet areas.
Measurement of adaxial epidermis anatomy.
Adaxial epidermal imprints were obtained by drying off a translucent varnish coat spread on the adaxial side of each leaflet from all successive compound leaves (from leaf 3 to leaf 13). The imprint was peeled off and immediately stuck on a microscope slide with one sided adhesive. Imprints were placed under a microscope (Leitz DM RB; Leica, Wetzlar, Germany) coupled to the ImageJ image analysis software (Fig. 2C). Only adaxial epidermal cells were considered in this study and it is referred hereafter to epidermal cells over the text. For each leaflet, at least 75 epidermal cells were drawn manually in a middle zone of the mature leaflet, i.e; considering tip-base but also midrib-margin parts. This zone of the leaflet was selected after a preliminary experiment which showed that epidermal cell density does not vary from the tip to the base of mature leaflets (Fig. 2C, Kruskal-Wallis test by ranks, P-value = 0.1313). Distribution of cell area per leaflet was obtained by pooling data from all cells drawn in the leaflets at a same position in the compound leaf. The mean epidermal cell number per leaflet was calculated as the ratio of mean leaflet area to mean leaflet epidermal cell area. Distribution of cell area per leaf was obtained by pooling data from all cells drawn in the different leaflets within the same compound leaf. The mean epidermal cell number per leaf was calculated as the ratio of leaf area to mean leaf epidermal cell area.
Ploidy levels in leaves and leaflets
the left side of the midvein, using a punch of 8 mm diameter. Discs were immediately put in a 2 mL Eppendorf and frozen in liquid nitrogen. Samples were then stored at -80°C until flow cytometry measurements. Frozen disks were chopped with a razor blade and incubated in 200 µL extraction buffer for 2 minutes. Extracted nuclei were fixed with 200 µL of 70 % ethanol for 2 minutes and colored with 800 µL DAPI. The solutions were filtered to eliminate all structures with diameter higher than 30 µm. Remaining solutions were analyzed by flow cytometry with a C6 BD Accuri system. All reagents were obtained from BD Biosciences.
Ploidy histograms were pooled according to leaflet position, leaf rank, genotype and soil water content treatment. The positions of the peaks corresponding to the various nuclear classes, i.e., nuclei in 2C, 4C and 8C were manually identified and windows were positioned according a reference sample with nuclei extracted from young tomato leaves with a high proportion of dividing cells (Supplemental Fig. 1). This manual treatment allowed removing noise, i.e, all counts below the 2C peak that can come from different origins (mainly chemicals interacting with DAPI and maybe also some debris resulting from chopping). This manual treatment was impossible for samples harvested in leaves of the antisense mutant mainly because the position of the first peak was not easily detectable and this affected all results. Positions of peaks of 16C and 32C nuclei were deduced from other peak positions assuming that DNA content was additive. Peak positions as identified in Supplemental Fig. 1 were conserved for the whole study. Ploidy histograms were quantitatively analyzed with the R software for Wva106 plants at all watering regimes.
Extracting trends for different morphological variables
We applied the LOESS method (Cleveland, 1979), a standard nonparametric regression method, to extract trends (e.g. leaf area as a function of leaf rank) for different morphological variables of
interest. The LOESS method depends on two parameters: the smoothing parameter or span that defined the neighboring for fitting local linear regression models and the degree of the polynomial of these linear models. We systematically used polynomials of first degree partly because of the limited range of the explanatory variable (e.g. 11 successive ranks for the leaves). The span was selected using AICc, a usual model selection criterion that finds the best trade-off between the parsimony and the prediction capability of the model.
RESULTS
Changes in final leaflet areas and cellular leaflet size-related traits along the rachis of
tomato compound leaves.
For each Wva106 plant grown in the well-watered condition, leaflet areas were measured on heteroblastic leaf series along the first sympodial unit when all leaves reached their final size (Fig. 1 & 2). Most leaves were composed of 7 leaflets except leaves 1, 2 and 3 which had fewer leaflets (3 to 5 leaflets, not shown).
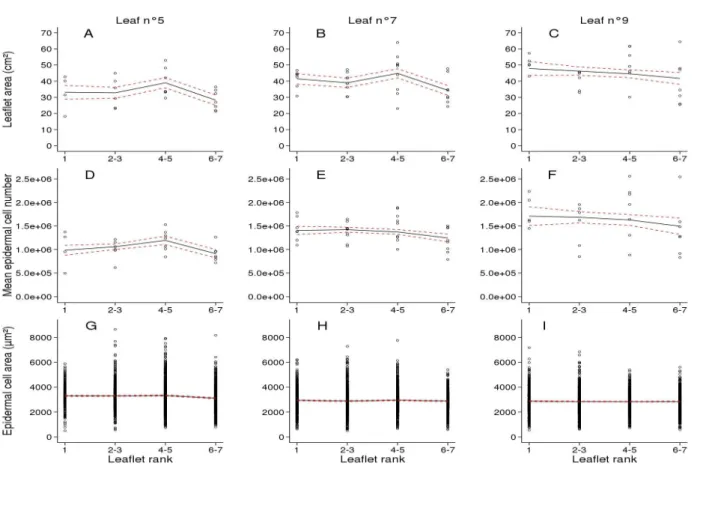
Leaflet areas varied slightly along the rachis of a same leaf as shown for leaves 5, 7 and 9 (Fig. 3 A-C, respectively). Similarly, there were only slight variations of the mean final number of epidermal cells and almost no variation of the epidermal cell area distribution among leaflets within a same leaf (Fig. 3 D-I). Considering the variations of leaflet size-related traits with leaf rank, leaflets of leaf 9 were larger than those of leaf 5, with higher mean epidermal cell number and smaller mean epidermal cell area with a slightly less dispersed distribution (Fig. 3).
For each mature leaflet in the 9th leaf, the distribution of DNA ploidy level in cells was measured
by flow cytometry. C values varied from 2 to 32C with very low proportions of nuclei in 2C and 32C that were difficult to distinguish from the background (Fig. 4). In contrast, in all leaflets, 4C
+ 8C nuclei represented more than 76% of all nuclei and 16C nuclei varied between 7.2 and 10.8% (Fig. 4). Ploidy level distributions did not show any specific trend with the leaflet position (Fig. 4).
Changes in final leaf areas and cellular leaf size-related traits along the first sympodial unit.
For each Wva106 plant grown in the well-watered condition, leaf area, epidermal cell number per leaf and distribution of epidermal cell areas within the leaf were measured along the first sympodial unit (from leaf 3 until leaf 13), when all leaves reached their final size. Final leaf area increased gradually from leaf 3 to leaf 9; from 115.9 ± 24.7 to 321.6 ± 12.9 cm² and then decreased slightly until leaf 13 (Fig. 5A). The mean final epidermal cell number followed the same trend (Fig. 5B). In contrast, mean epidermal cell area slightly decreased from leaf 3 to leaf 8 where a plateau is reached (Fig. 5C). The epidermal cell area of the lowest leaves was highly variable with right-skewed distributions, due to the presence of large epidermal cells (Fig. 5C). The distribution of DNA ploidy level in leaf cells showed that C values varied from 2 to 32C in mature leaves (Fig. 6) and did not show any specific trend with the leaf rank as shown for ranks 4, 6, 8 and 12 along the first sympodial unit (Fig. 6). In all leaves, 4C + 8C nuclei represented more than 74% of all nuclei whereas 16C nuclei varied between 8.3 and 9.9%. It was still difficult to distinguish the very low proportions of nuclei in 2C and 32C from the background.
Altogether these results suggest that changes in leaf size with leaf rank along the first sympodial unit of Wva106 plants is related
(1) to changes in leaflet areas, but not in leaflet numbers (except for leaves 1, 2 and 3 which
had a reduced number of leaflets), with common cellular characteristics for all leaflets of a given leaf, i.e, with common epidermal cell area and cellular ploidy distributions ;
(2) to changes in epidermal cell number, but not in their size nor in the level of endoreduplication.
Changes in final leaf area and cellular size-related traits in the tomato compound leaf upon
SlCCS52A loss-of-function.
To get further insights into the relative contributions of cellular processes to the final leaf size, leaf size-related traits were measured in a transgenic line specifically affected in the cell cycle-endoreduplication transition, namely the SlCSS52A loss-of-function line (referred to as
Pro35S:Slccs52AAS ; Mathieu-Rivet et al., 2010) and compared to the wild-type (Wva106). This
line has a slow developmental rate and produces smaller plants (not shown but observed in our experiment, see also Mathieu-Rivet et al., 2010).
The changes in whole leaf area, area of leaflet 1 and mean epidermal cell number in leaflet 1 with
leaf rank along the first sympodial unit were compared between Wva106 and Pro35S:Slccs52AAS
lines (Fig. 7A-C). All studied traits increased gradually with leaf rank until a maximal value around leaf 9 and slightly decreased or remained stable afterwards depending on the trait (Fig.
7A-C). For the first leaves, values of these three traits were lower in the Pro35S:Slccs52AAS line
than in the wild-type. For example, final leaf area of the fourth reached 32.8 cm² ± 26.6 in the
Pro35S:Slccs52AAS line whereas it was 158.8 ± 17.5 cm² in the wild-type. Final area of leaflet 1
was 5.3 ± 5.2 cm² in the Pro35S:Slccs52AAS line whereas it was 21.5 ± 3 cm² in the wild-type.
Mean epidermal cell number of leaflet 1 was divided by more than 6 in the Pro35S:Slccs52AAS line
compared to the wild-type (9.2 104 ± 2.6 104 cells vs 6.2 105 ± 1.1 105 cells per leaflet,
respectively). In the Pro35S:Slccs52AAS line, the increase with leaf rank of these three traits was
cell number were higher in the antisense line than in the wild-type (Fig. 7 A-C). When the traits were considered at the scale of the whole sympodial unit, the cumulative leaf area of the first
sympodial unit did not differ between the Pro35S:Slccs52AAS line and the wild-type (Fig. 7E).
Similarly, both the cumulative leaflet 1 areas and the cumulative epidermal cell number of leaflet
1 of the first sympodial unit did not differ between the Pro35S:Slccs52AAS line and the wild-type
(Fig. 7F, G).
Epidermal cell area in leaflet 1 (Fig. 7D) decreased markedly with the leaf rank in the
Pro35S:Slccs52AAS line, while it only slightly decreased in the wild-type. For leaves 4 to 7,
epidermal cell area was higher in Pro35S:Slccs52AAS line compared to the wild-type. After leaf 10,
epidermal cell area was lower in Pro35S:Slccs52AAS line compared to the wild-type. When the
distribution of epidermal cell areas was considered at the scale of the whole sympodial unit, pooling cell area distributions of all first leaflets, mean epidermal cell area did not differ markedly between the two genotypes but the distribution was more dispersed and right-squewed
in the Pro35S:Slccs52AAS line compared to the wild type (Fig. 7H).
As for the wild-type, the distribution of DNA ploidy level in leaf cells was measured in the first
leaflet of leaves at different ranks in the Pro35S:Slccs52AAS line but ploidy level distributions were
too noisy to extract quantitative data and draw robust conclusions (not shown).
Altogether, these results show that CCS52A loss-of-function affected the absolute value of the leaf size-related traits studied here at each leaf rank. For leaf area, epidermal cell number and epidermal cell area, it also affected the trends along the shoot and this caused a total compensation when the traits were considered at the scale of the whole sympodial unit. Here again, cellular size-related traits affected by CCS52A loss-of-function at the whole leaf level were similarly affected at the single leaflet level of the same leaf as shown for the first leaflet.
Dose response to soil water deficit of final leaf area and cellular size-related traits in the
tomato compound leaf.
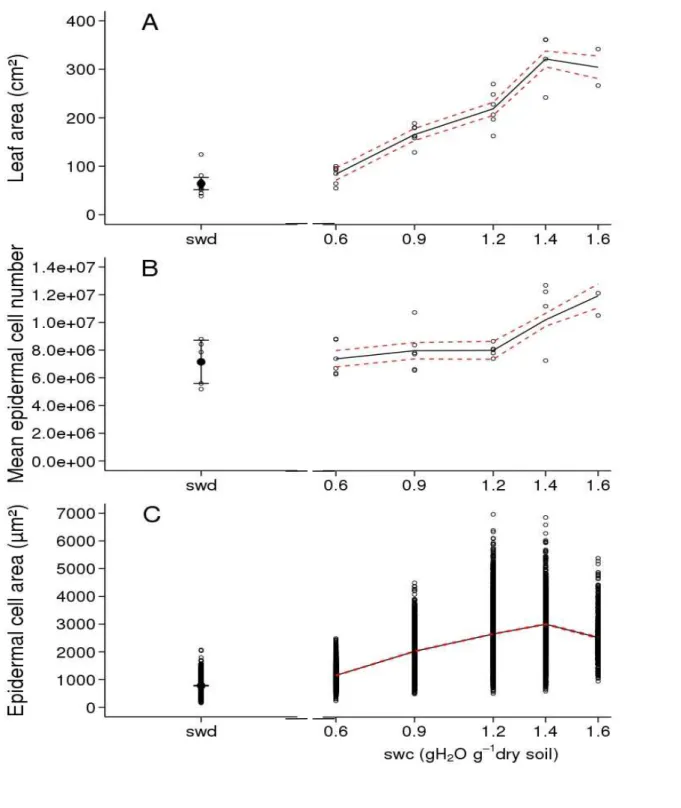
Six soil water deficit treatments were imposed to wild-type plants and started when leaf 5 was fully emerged, i.e. when all leaflets forming leaf 5 were unfolded (Fig. 1). The response of leaf size-related traits to soil water content was studied on leaf 9 which emerged while the different soil water deficit treatments started to be contrasted (Fig. 1). Final leaf 9 area was maximal for
the two highest levels of soil water content, i.e. 1.6 and 1.4 g H2O g-1 dry soil (Fig. 8A) and it
decreased with decreasing values of soil water content (Fig. 8A). From 1.4 to 0.6 g H2O g-1 dry
soil, final leaf 9 area was decreased from 321.3 ± 17.1 to 83.9 ± 12.9 cm². The reduction of final leaf 9 area induced by the most severe water deficit treatment (with decreasing soil water content
without re-irrigation) (see Fig. 1), was comparable to that induced by the 0.6 g H2O g-1 dry soil
treatment (Fig. 8A). This result is consistent with the time course of soil water depletion (Fig. 1)
showing that soil water content did not reach the 0.6 g H2O g-1 dry soil threshold before 12 days
after leaf 9 emergence; suggesting that these two treatments did not really differ during a large part of leaf 9 development. Mean epidermal cell number in leaf 9 was maximal for the highest
level of soil water content, i.e. 1.6 g H2O g-1 dry soil (Fig. 8B) and it decreased with decreasing
values of soil water content from 1.6 to 1.2 g H2O g-1 dry soil. It did not decrease anymore with
lower values of soil water contents (Fig. 8B). Mean epidermal cell area was maximal for the two
highest levels of soil water content, i.e. 1.6 and 1.4 g H2O g-1 dry soil (Fig. 8C) and it decreased
with decreasing values of soil water content (Fig. 8C). The range of epidermal cell area was reduced in leaves of plants grown at the lowest soil water contents (Fig. 8C). Considering each leaflet independently, the dose responses to soil water contents of all these traits were identical to those observed at the whole leaf scale (Sup. Fig. 2).
Reducing soil water content also induced a shift of the distribution of DNA ploidy level in leaf cells towards the lowest C values (Fig. 9). The highest proportion of cells was found in 8C (44.3%), 4C (47.4%) and 2C (72.2%) respectively for the well-watered condition, the moderate water deficit treatment and the severe water deficit treatment (Fig. 9).
Altogether these results show that drought stress effect on tomato leaf area is related to reductions in cell number, cell size and the level of endoreduplication within the leaf. Here again, effects reported at the whole leaf scale are the same than those reported considering the different leaflets forming the compound leaf.
DISCUSSION
The PHENOPSIS automaton ensured that tomato plants were grown in rigorously
controlled and comparable conditions.
Plant phenotyping platforms with automatic weighing/watering stations have been developed in many groups over the past 20 years, both in greenhouse, where plant microclimate is not precisely controlled, and in growth chamber, where it is possible to ensure more homogeneous air temperature, air humidity, light quality and light intensity. In most cases, platforms in growth chambers were developed for small plants grown in small pots ensuring high-throughput analyses (Granier et al., 2006; Tisné et al., 2011; Skyricz et al., 2011; Flood et al., 2016; Pavicic et al., 2017). In contrast, most platforms in greenhouse have been developed for larger pots suited for different crops also at high throughput thanks to less space limitation (Sadok et al., 2007; Nagel
et al., 2012; Coupel-Ledru et al., 2014). The chamber used for the present study was equipped
since 2004 with the PHENOPSIS automaton which allows adjusting soil water content per pot in function of plant transpiration and soil evaporation (Granier et al., 2006). The PHENOPSIS automaton was used until now for small pots, but it was adapted here to manage larger pots more suitable for tomato plants and avoid the pot size effect on whole plant development and functioning (as shown recently in Dambreville et al., 2017). The automaton was used to ensure (1) that soil water content was stabilized over time, for 5 treatments among 7, despite the increase in tomato plant size (Fig.1), (2) that two tomato genotypes with different developmental rates were grown at same soil water content over their whole period of development and (3) that different intensities of soil water contents were imposed during tomato plant development. The number of plants grown together was equal to 52 but the throughput of the analysis can be considered as relatively high considering the number of leaflets (7) measured on each leaf (10
from leaf 4 to 13) of each plant (52).
Changes in leaf area, leaflet area and cellular size-related traits in heteroblastic series
support that leaflets are similar and share common cellular properties.
Leaf size, shape and morphology related-traits change along plant shoots. Trait changes with leaf rank can be gradual or more abrupt depending on the trait itself, environmental conditions and genotypes (Zotz et al., 2011). In all cases, leaves can be grouped in successive classes that share common phenotypic properties such as the absence or presence of trichomes (Hunter et al., 2003), or a set of common developmental properties (Lièvre et al., 2016). In simple leaves such as in Arabidopsis thaliana, tobacco or pea, morphological traits such as leaf area that change with leaf rank, are accompanied by changes in cellular traits. The increase in whole leaf area with leaf rank is systematically paralleled by an increase in epidermal cell number, whereas epidermal cell area only slightly decreases or is unchanged (Granier et al., 2000; Cookson et al., 2007). This is exactly what is reported here for the tomato compound leaves along the first sympodial unit of the wild-type line. In the Wva106 plants in well-watered conditions, the progression of heteroblasty for the studied traits, i.e. the relative changes in leaf area, epidermal cell number and epidermal cell area from one leaf to another; paralleled the progression reported for Col-0 plants of Arabidopsis thaliana for the same traits (Cookson et al., 2007; Lièvre et al., 2016). In addition, we did not find any changes in endoreduplication with leaf rank. Considering the individual leaflets of a leaf, it was possible to show that the 7 individual leaflets of a given leaf shared the same cellular properties in terms of final area, epidermal cell number and size, and endoreduplication. This supports the theory that leaflets can be considered as subdivisions of the leaf they belong to (Kaplan, 1975). This is an important result since a single leaflet can be used as representative of the whole leaf for leaf growth phenotyping studies, at least in tomato, thereby
largely simplifying the framework of analyses. The robustness of this result was shown here for different leaves of a plant, comparing two genotypes with different leaf development and plants growing under drought stresses of different intensities.
Epidermal cell number and size contributions to the plasticity of tomato compound leaf
area: what about the compensation mechanism described in simple leaves?
The quasi-parallel changes in leaf area and epidermal cell number along plant shoot in simple leaves and reported here for compound leaves of two different tomato genotypes is consistent with the old traditional view that leaf development could be driven by cell cycle-associated processes. Cells could accumulate by divisions occurring in particular regions of the leaf and would drive morphogenesis and determine the final shape and size of the leaf by cell expansion (Fleming, 2007). Soil water deficit treatments also support this view. The drought treatments were applied here during whole leaf development and reduced both the number of cells produced by division and their subsequent expansion as shown previously for the simple leaves of both
Arabidopsis thaliana and oilseed rape (Baerenfaller et al., 2011; Dambreville et al., 2017).
Over the past 20 years, this picture of plant organ growth theory was disturbed by the observation of compensation phenomenon in leaf morphogenesis, i.e. an abnormal increase in cell volume triggered by a decrease in cell number. It suggested the existence of integration systems linking levels of cell proliferation and cell expansion (Tsukaya, 2002; Ferjani et al., 2007). In addition, an opposite type of compensation has also been described, i.e. enhanced cell proliferation caused by defective cell expansion (Usami et al., 2009) and has been associated to developmental phase changes at the plant scale (Hisanaga et al., 2015). Both type of balances between cell number and size (compensation and its opposite type) were observed in our study in two different contexts:
(1) the heteroblastic changes in leaf cellular components along the sympodial unit, with the increase in cell number accompanied by a decrease in cell size and followed by a plateau for both variables
(2) the SlCCS52A loss of function, with the decrease in epidermal cell number in the basal
leaves of the sympodial unit accompanied by an increase in epidermal cell area in the same leaves whereas the reciprocal is observed in the highest ones.
Total “balance” between cell number and size would have led to unchanged leaf area along the sympodial unit and/or between both genotypes. At the leaf scale, the spatial variability in final area along the sympodial unit and/or the genetic variability observed when comparing the
Pro35S:Slccs52AAS line with the wild-type, both reflects that these balances were partial in our
study.
Surprisingly, our results highlighted a total compensation at the scale of the whole sympodial unit
when comparing all phenotypic traits between the Pro35S:Slccs52AAS line and the wild-type. The
transgenic line was previously reported to have slow developmental rate at the whole plant scale and small fruits (Mathieu-Rivet et al., 2010). The slow aerial developmental rate was observed during our experiment (not shown). When compared per leaf, the leaf size-related traits phenotype was difficult to interpret and depended on leaf rank. For each trait, changes from one
leaf to the upper one was steeper in the Pro35S:Slccs52AAS line than in the wild-type, i.e. leaf area
and epidermal cell number increased more steeply, while epidermal cell area decreased more steeply. Finally, at the scale of the sympodial unit, both genotypes reached the same cumulative leaf area, epidermal cell number and epidermal cell area. A few studies have suggested that leaf size-related traits at the scale of the leaf could be controlled at the whole plant scale. Negative relationships between the number of leaves produced by a determinate plant and the number of
epidermal cells per leaf have been reported in recombinant inbred line of Aegilops tauschii and
Arabidopsis thaliana (Ter Steege et al., 2005; Tisné et al., 2008). To our knowledge the dataset
presented here is the first one allowing cumulating traits of the different leaves. It is possible that such compensation occurred in other studies, but was not evidenced because of the absence of measurement of all leaves along a shoot.
Additional evidence that no simple direct link exists between the
endoreduplication-dependent increase in the ploidy level and enhanced cell enlargement.
Cell size increase in plants is driven by two independent processes: cell growth, the increase in total cytoplasmic macromolecular mass, and cell expansion, the increase in cell volume through vacuolation (Breuer et al., 2010). As expected, highly polyploid nuclei (resulting from endoreduplication) are often associated with increased cell size via increased cell growth (Sugimoto-Shirasu and Roberts 2003; Lee et al., 2004). In our study, cell size was modified by leaf rank along the first sympodial unit as previously shown for other plants with simple leaves (Ashby, 1948; Granier and Tardieu, 1998, Cookson et al., 2007; Tisné et al., 2011). However, the distribution of DNA ploidy cell levels did not change from one leaf rank to another along the sympodial unit. In contrast, the systematic decrease in cell size caused by moderate and severe drought treatments imposed here was accompanied by a shift towards low value of DNA ploidy cell level, as reported for many environmental factors (Scholes and Paige, 2015). Altogether, our results present new evidence that the relationship between the level of ploidy and cell enlargement is not direct and that the two processes can be uncoupled to some extent (Tsukaya, 2013; Tsukaya, 2014).
Comparing final leaf area, epidermal cell number and epidermal cell size progression along the first sympodial unit of two tomato genotypes with different heteroblastic progressions, highlighted a combination of compensating mechanisms between epidermal cell number and size. These compensations were not only associated to the development of the individual leaf itself but also to whole plant development as previously suggested for plants with simple leaves (Massonnet et al., 2011). Endoreduplication distributions did not vary between leaves, showing that endoreduplication can be uncoupled from cell expansion as for simple leaves (Tsukaya, 2014). However, the compensation phenomena between cell number and size and the uncoupling of endoreduplication and cell size reported in the heteroblasty context were not observed anymore when leaf area variability was caused by soil water deficits with different intensities. In contrast to the gradients reported along the shoot for the different traits studied here, the different leaflets along the rachis of a same leaf are identical in term of final area, epidermal cell number and size, distribution of endoreduplication suggesting that they share common properties and can be representative of the leaf they belong to and can be used as individuals for phenotyping purpose at least for tomato.
ACKNOWLEDGEMENTS
We thank E. Suard for technical assistance during experiments and image analyses. The contribution of Nathalie Gonzalez, Christian Chevalier and Jean-Pierre Renaudin and two anonymous reviewers for comments on the manuscript is gratefully acknowledged. This project is supported by Agropolis Fondation under the reference Project-1403-032 through the
« Investissements d’avenir » programme (Labex Agro: ANR-10-LABX-0001-01). Adaptation of the PHENOPSIS platform to host large pots was supported by the GEPETOs2015 project (Région Languedoc Roussillon-FEDER funds).
LITTERATURE CITED
Ashby E. 1948. Studies in the morphogenesis of leaves. 2. The area, cell size and cell number of
leaves of Ipomoea in relation to their position on the shoot. New Phytologist 47 : 177–195.
Autran D, Jonak C, Belcram K, Beemster GTS, Kronenberger J, Grandjean O, Inze´ D,
Traas J. 2002. Cell numbers and leaf development in Arabidopsis: a functional analysis of the
STRUWWELPETER gene. EMBO Journal 21 : 6036–6049.
Baerenfaller K, Massonnet C, Walsh S, Baginsky S, Bühlmann P, Hennig L,
Hirsch-Hoffmann M, Howell KA, Kahlau S, Radziejwoski A, Russenberger D, Rutishauser D,
Small I, Stekhoven D, Sulpice R, Svozil J, Wuyts N, Stitt M, Hilson P, Granier C, Wilhelm
G. 2012. Systems-based analysis of Arabidopsis leaf growth reveals adaptation to water deficit.
Molecular Systems Biology 8 : 606.
Breuer C, Ishida T, Sugimoto K. 2010. Developmental control of endocycles and cell growth in
plants. Current Opinion in Plant Biology 13 : 654–660.
Champagne C, Sinha N. 2004 Compound leaves, equal to the sum of their parts? Development
131 : 4401–4412.
Cleveland WS. 1979. Robust Locally Weighted Regression and Smoothing Scatterplots. Journal
Cookson SJ, Chenu K, Granier C. 2007. Day-length affects the dynamics of leaf expansion and
cellular development in Arabidopsis thaliana partially through floral transition timing. Annals of Botany 99 : 703–711.
Cookson SJ, Van Lijsebettens M, Granier C. 2005. Correlations between leaf growth variables
suggest intrinsic and early controls of leaf size in Arabidopsis thaliana. Plant, Cell and Environment 28 : 1355–1366.
Coupel-Ledru A, Lebon É, Christophe A, Doligez A, Cabrera-Bosquet L, Péchier P,
Simonneau T. 2014. Genetic variation in a grapevine progeny (Vitis vinifera L. cvs Grenache x
Syrah) reveals inconsistencies between maintenance of daytime leaf water potential and response of transpiration rate under drought. Journal of Experimental Botany 65 : 6205–6218.
Dambreville A, Griolet M, Rolland G, Dauzat M, Bédiée A, Balsera C, Granier C. 2017.
Phenotyping oilseed rape growth-related traits and their responses to water deficit: The disturbing pot size effect. Functional Plant Biology 44 : 35–45.
De Veylder L, Larkin JC, Schnittger A. 2011. Molecular control and function of
endoreplication in development and physiology. Trends in Plant Sciences 16 : 624–634.
Donnelly PM, Bonetta D, Tsukaya H, Dengler RE, Dengler NG. 1999. Cell cycling and cell
enlargement in developing leaves of Arabidopsis. Developmental Biology 215 : 407–419.
Edgar BA, Zielke N, Gutierrez C. 2014. Endocycles: a recurrent evolutionary innovation for
post-mitotic cell growth. Nature Reviews Molecular Cell Biology 15 : 197–210.
Ferjani A, Horiguchi G, Yano S, Tsukaya H. 2007. Analysis of leaf development in fugu
mutants of Arabidopsis reveals three compensation modes that modulate cell expansion in determinate organs. Plant Physiology 144 : 988–999.
Fleming AJ. 2007. Cell cycle control during leaf development. In D Inzé, ed, Cell Cycle Control
and Plant Development. Annual Plant Reviews. Blackwell Publishing, Oxford, pp 203–226.
Flood PJ, Kruijer W, Schnabel SK, van der Schoor R, Jalink H, Snel JF, Harbinson J, Aarts
MGM. 2016. Phenomics for photosynthesis, growth and reflectance in Arabidopsis thaliana
reveals circadian and long-term fluctuations in heritability. Plant Methods 12 : 14.
Gázquez A, Beemster GTS. 2017. What determines organ size differences between species? A
meta-analysis of the cellular basis. New Phytologist 215 : 299–308.
Gonzalez N, Vanhaeren H, Inzé D. 2012. Leaf size control: complex coordination of cell
division and expansion. Trends in Plant Sciences 17 : 332– 340.
Granier C, Tardieu F. 1998. Spatial and temporal analyses of expansion and cell cyle in
sunflower leaves. A common pattern of development for all zones of a leaf and different leaves of a plant. Plant Physiology 116 : 991–1001.
Granier C, Aguirrezabal L, Chenu K, Cookson SJ, Dauzat M, Hamard P, Thioux JJ,
Rolland G, Bouchier-Combaud S, Lebaudy A, Muller B, Simonneau T, Tardieu F. 2006.
PHENOPSIS, an automated platform for reproducible phenotyping of plant responses to soil water deficit in Arabidopsis thaliana permitted the identification of an accession with low sensitivity to soil water deficit. New Phytologist 169 : 623–635.
Granier C, Turc O, Tardieu F. 2000. Co-ordination of cell division and tissue expansion in
sunflower, tobacco and pea leaves. Dependence or independence of both processes? Journal of Plant Growth Regulation 19 : 45–54.
Hareven D, Gutfinger T, Parnis A, Eshed Y, Lifschitz E. 1996. The making of a compound
Hemerly A, Engler JdA, Bergounioux C, Montagu MV, Engler G, Inzé D, Ferreira P. 1995.
Dominant negative mutants of the Cdc2 kinase uncouple cell division from iterative plant development. EMBO Journal 14 : 3925–3936.
Hisanaga T, Kawade K, Tsukaya H. 2015. Compensation: a key to clarifying the organ-level
regulation of lateral organ size in plants. Journal of Experimental Botany. 66 : 1055–63.
Horiguchi G, Ferjani A, Fujikura U, Tsukaya H. 2006. Coordination of cell proliferation and
cell expansion in the control of leaf size in Arabidopsis thaliana. Journal of Plant research 119 : 37–42.
Hunter C, Sun H, Poethig RS. 2003. The Arabidopsis heterochronic gene ZIPPY is an
ARGONAUTE family member. Current Biology 13(19) : 1734–1739.
John PCL, Qi R. 2008. Cell division and endoreduplication: doubtful engines of vegetative
growth. Trends in Plant Sciences 13 : 121–127.
Kaplan DR. 1975. Comparative developmental evaluation of the morphology of Unifacial
leaves in the monocotyledons. Botanische Jahrbücher für Systematik, Pflanzengeschichte und Pflanzengeographie 95 : 1–105.
Kaplan DR, Hagemann W. 1991. The relationship of cell and organism in vascular plants - are
cells the building-blocks of plant form. Bioscience 4 : 693–703.
Katagiri Y, Hasegawa J, Fujikura U, Hoshino R, Matsunaga S, Tsukaya H. 2016. The
coordination of ploidy and cell size differs between cell layers in leaves. Development 143 : 1120–1125.
Lee HC, Chiou DW, Chen WH, Markhart AH, Chen YH, Lin TY. 2004. Dynamics of cell
Lièvre M, Granier C, Guédon Y. 2016. Identifying developmental phases in Arabidopsis
thaliana rosette using integrative segmentation models. New Phytologist 210 : 1466–1478.
Massonnet C, Tisné S, Radziejwoski A, Vile D, de Veylder L, Dauzat M, Granier C. 2011.
New insights into the control of endoreduplication: endoreduplication is driven by organ growth in Arabidopsis leaves. Plant Physiology 157 : 2044–2055.
Mathieu-Rivet E, Gevaudant F, Sicard A, Salar S, Do PT, Mouras A, Fernie AR, Gibon Y,
Rothan C, Chevalier C, et al. 2010. Functional analysis of the anaphase promoting complex
activator CCS52A highlights the crucial role of endo-reduplication for fruit growth in tomato. Plant Journal 62 : 727–741.
Melaragno JE, Mehrotra B, Coleman AW. 1993. Relationship between endopolyploidy and
cell size in epidermal tissue of Arabidopsis. Plant Cell 5 : 1661–1680.
Nagel KA, Putz A, Gilmer F, Heinz K, Fischbach A, et al. 2012. GROWSCREEN-Rhizo is a
novel phenotyping robot enabling simultaneous measurements of root and shoot growth for plants grown in soil-filled rhizotrons. Functional Plant Biology 39 : 891–904.
Nelissen H, Gonzalez N, Inzé D. 2016. Leaf growth in dicots and monocots: so different yet so
alike. Current Opinion in Plant Biology 33 : 72–76.
Pavicic M, Mouhu K, Wang F, Bilicka M, Chovancek E, Himanen K. 2017. Genomic and
phenomic screens for flower related RING type ubiquitin E3 ligases in Arabidopsis. Frontiers in Plant Science 8.
Pyke KA, Marisson JL, Leech RM. 1991. Temporal and spatial development of the cells of the
expanding first leaf of Arabidopsis thaliana (L.) Heynh. Journal of Experimental Botany 42 : 1407–1416.
R Development Core Team. 2014. R: A language and environment for statistical computing.
Vienna: R Foundation for Statistical Computing.
Rodriguez RE, Debernardi JM, Palatnik JF. 2014. Morphogenesis of simple leaves: regulation
of leaf size and shape. Wiley Interdisciplinary Reviews: Developmental Biology 3 : 41–57.
Roeder AHK, Chickarmane V, Cunha A, Obara B, Manjunath BS, Meyerowitz EM. 2010.
Variability in the control of cell division underlies sepal epidermal patterning in Arabidopsis
thaliana. PLoS Biology 8 : e1000367.
Rymen B, Fiorani F, Kartal F, Vandepoele K, Inzé D, Beemster GTS. 2007. Cold nights
impair leaf growth and cell cycle progression in maize through transcriptional changes of cell cycle genes. Plant Physiology 143 : 1429–1438.
Sablowski R. 2016. Coordination of plant cell growth and division: collective control or mutual
agreement? Current Opinion in Plant Biology 34 : 54–60.
Sadok W, Naudin Ph, Boussuge B, Muller B, Welcker C, Tardieu F. 2007. Leaf growth rate
per unit thermal time follows QTL-dependent daily patterns in hundreds of maize lines under naturally fluctuating conditions. Plant Cell and Environment 30 : 135–146.
Sattler R, Rutishauser R. 1992. Partial homology of pinnate leaves and shoots: orientation of
leaflet inception. Botanische Jahrhucher fur Systematik, Pflanzengeschichte und Pflanzengeographie 114 : 61–79.
Scholes DR, Paige KN. 2015. Plasticity in ploidy: a generalized response to stress. Trends in
Plant Science 20 : 165–175.
Skirycz A, Vandenbroucke K, Clauw P, Maleux K, De Meyer B, Dhondt S, Pucci A,
M, Inzé D. 2011. Survival and growth of Arabidopsis plants given limited water are not equal.
Nature Biotechnology 29 : 212–214.
Sugimoto-Shirasu K, Roberts K. 2003. “Big it up”: Endoreduplication and cell-size control in
plants. Current Opinion in Plant Biology 6 : 544–553.
Tardieu F, Reymond M, Hamard H, Granier C, Muller B. 2000. Spatial distributions of
expansion rate, cell division rate and cell size in maize leaves: a synthesis of the effects of soil water status, evaporative demand and temperature. Journal of Experimental Botany 51 : 1505– 1514.
Ter Steege MW, den Ouden FM, Lambers H, Stam P, Peeters AJM. 2005. Genetic and
physiological architecture of early vigor in Aegilops tauschii, the D-genome donor of hexaploid wheat. A quantitative trait loci analysis. Plant Physiology 139 : 1078–1094
Tisné S, Barbier F, Granier C. 2011. The ERECTA gene controls spatial and temporal patterns
of epidermal cell number and size in successive developing leaves of Arabidopsis thaliana. Annals of Botany 108 : 159–168.
Tisné S, Reymond M, Vile D, Fabre J, Dauzat M, Koornneef M, Granier C. 2008. Combined
genetic and modeling approaches reveal that epidermal cell area and number in leaves are controlled by leaf and plant developmental processes in Arabidopsis. Plant Physiology 148 : 1117–1127.
Tojo T, Tsuda K, Yoshizumi T, Ikeda A, Yamaguchi J, Matsui M, Yamazaki K. 2008.
Arabidopsis MBF1s control leaf cell cycle and its expansion. Plant Cell Physiology 50 : 254–264.
Tsukaya H. 2014. Comparative leaf development in angiosperms. Current Opinion in Plant
Tsukaya H. 2013. Does ploidy level directly control cell size? Counterevidence from
Arabidopsis genetics. PLoS ONE 8 : e83729.
Usami T, Horiguchi G, Yano S, Tsukaya H. 2009. The more and smaller cells mutants of
Arabidopsis thaliana identify novel roles for SQUAMOSA PROMOTER BINDING PROTEIN-LIKE genes in the control of heteroblasty. Development 136 : 955–964.
Vanhaeren H, Inzé D, Gonzalez N. 2016. Plant growth beyond limits. Trends in Plant Science
21 : 102.
Wuyts N, Massonnet C, Dauzat M, Granier C. 2012. Structural assessment of the impact of
environmental constraints on Arabidopsis leaf growth: a 3D approach. Plant Cell and Environment 35 : 1631–1646.
Zotz G, Wilhelm K, Becker A. 2011. Heteroblasty-A Review. The Botanical Review 77 : 109–
Figure legends
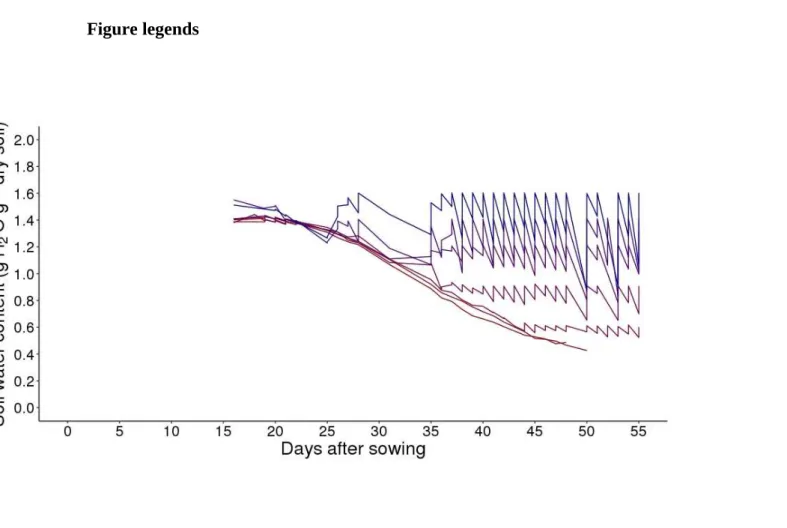
Fig. 1. Experimental setup from sowing to harvest. Tomato seeds of Wva106 wild type and of
the Pro35S:Slccs52AAS transgenic line were sown in MS medium. Seedlings were grown during
three weeks in boxes set up in the growth chamber. Two to three young plants were then transplanted in each of the 52 individual pots filled with soil. Pots were irrigated manually during one week. Around 17 days after sowing, plants were thinned out to keep one plant per pot and
pots were irrigated by the PHENOPSIS automaton to reach a soil water content of 1,4 gH2O g
-1dry soil. All plants were grown at 1,4 gH
2O g-1dry soil until the emergence of the fifth leaf. At
this stage (represented by a horizontal green line illustrating the variability of dates depending on plant to plant and genotypes), 7 specific watering regimes were set up with 7 Wva106 plants per
watering regime. The 3 pots of the transgenic Pro35S:Slccs52AAS line were grown at 1,4 gH
-1dry soil only. Among the 7 watering regimes, 5 were stabilized at : 1,6 ; 1,4 ; 1,2 ; 0,9 and 0,6
gH2O g -1dry soil over time whereas for the two others, soil water content decreased over time
without re-irrigation. These two last treatments were considered together hereafter and called severe water deficit (swd). Treatments are represented by colored lines with a gradient increasing from the lowest (red) to the highest (blue) soil water content. For each watering regime, data are means of soil water content calculated before and after daily irrigation considering the 7 pots in each treatment for Wva106. Depending on plant to plant variability within a same genotype and treatment but also depending on genotypes and drought treatments, leaf 9 emerged between 28 and 33 days after sowing as shown by the horizontal blue line.
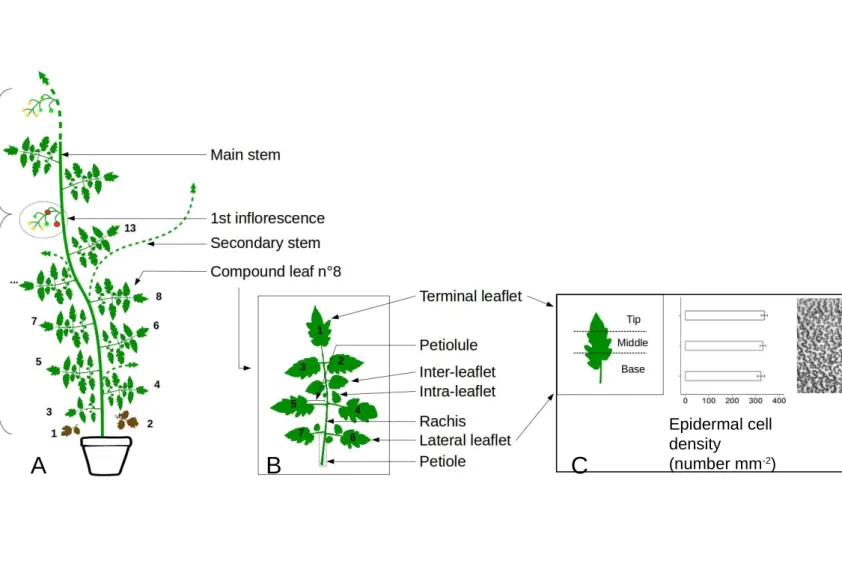
Fig. 2. Layout of the Solanum lycopersicum, cv. Wva106 aerial architecture in well-watered
condition. (A) The aerial part is composed of successive sympodial units formed by the main stem and successive compound leaves and inflorescences. The number of compound leaves varies from one sympodial unit to the other. In our experiment, the first sympodial unit bears up to 13 compound leaves. (B) Each compound leaf is attached by a petiole to the main stem and is composed of a rachis with a terminal leaflet (numbered 1) and 6 other leaflets (lateral leaflets) positioned by pairs on the left and right side of the rachis, respectively. Leaflets are attached to the rachis by a petiolule. Inter-leaflets that are smaller than regular leaflets are present between
Epidermal cell density
(number mm-2)
successive pairs of leaflets (attached to the rachis), whereas intra-leaflets of small size are attached to the petiolule of leaflets. Inter- and intra-leaflets were not considered in our study. (C) The absence of gradient in adaxial epidermal cell area within a mature leaflet was previously tested in3 zones from tip to base. Mean epidermal cell density and confidence interval are show for the 3 zones. A representative image issued from an imprint of the adaxial epidermis in the middle part of the first leaflet of a mature leaf 8, in well-watered conditions for Wva106 is shown.
Fig. 3. Profiles of leaflet size-related traits in Wva106 plants grown in the well-watered
condition. Data are shown for the successive leaflets numbered from 1 to 7 according to their
order of emergence along the 5th, 7th and 9th compound leaf (left, middle and right columns,
respectively) of the first sympodial unit. Data were pooled for leaflets emerging by pairs (2-3, 4-5, 6-7) and data for the terminal leaflet are shown alone (see Fig. 2). Each point represents individual leaflet area (A, B, C), mean epidermal cell number per leaflet (D, E, F) and epidermal cell area (G, H, I). Trends (black full lines) of final leaflet area (A, B, C, 4 < n < 9), mean final epidermal cell number per leaf (D, E, F, 4 < n < 9) and final epidermal cell area (G, H, I, 300 <
Fig. 4. Ploidy level distribution as
measured by flow cytometry in
mature tomato leaflets of the 9th leaf
of the first sympodial unit of Wva106 plants grown in well-watered conditions. Data are shown for leaflets 1(A), 2 & 3 (B), 4 & 5 (C), 6 & 7 (D). Each single distribution was obtained by pooling distributions obtained for 3 different plants. For each distribution the percentage of nuclei in 2C, 4C, 8C, 16C and 32C is noted on the distributions.
Fig. 5. Profiles of leaf
size-related traits
considering successive compound leaves of the first sympodial unit in Wva106 plants grown in well-watered conditions. Each point represents the final leaf area (A), mean epidermal cell number per leaf (B) and epidermal cell area distribution (C) that were calculated by pooling all leaflets within each compound leaf. Trends (black full lines) of final leaf area (A, 1 < n <
6), final mean epidermal cell number per leaf (B, 1 < n < 6) and epidermal cell area (C, 525 < ncell < 3150) are shown with confidence intervals (red dashed lines) and prediction intervals (blue dot dashed lines).
Fig. 6. Ploidy level distribution as
measured by flow cytometry in mature tomato leaves considering leaves at rank 4(A), 6(B), 8(C) and 12 (D) on the first sympodial unit of Wva106 plants grown in well-watered conditions. Each single distribution was obtained by pooling distributions of all leaflets within each compound leaf of 3 different plants. For each distribution the percentage of nuclei in 2C, 4C, 8C, 16C and 32 C is noted on the distributions.
Fig. 7. Profiles of leaf size-related traits considering successive compound leaves of the first
sympodial unit in Wva106 (black symbols) and in the transgenic line Pro35S:Slccs52AAS (green
E p id er m a l c el l a re a s (µ m ²) C u m u la tiv e c el l n u m b er C um u la tiv e le a fle t ar ea s (c m ²) C um u la tiv e le a f a re as ( cm ²)
symbols) grown in well-watered conditions. Each point represents final leaf area (A), 1st final
leaflet area (B), 1st leaflet mean final epidermal cell number (C) and 1st leaflet final epidermal cell
area (D). Trends (black full lines) of final leaf area (A, 1 < n < 6), final 1st leaflet area (B, 1 < n
< 6), mean final epidermal cell number per leaflet 1 (C, 1 < n < 6) and final epidermal cell area
of the 1 st leaflet (D, 1050 < n
cell < 3150) are shown with confidence intervals (dashed lines). On
the right panels, the mean cumulative leaf area of the 1st sympodial unit (E), the mean cumulative
leaf area of all the 1st leaflets of the 1st sympodial unit (F), the mean cumulative epidermal cell
number considering the 1st leaflets of the 1st sympodial unit (G) are represented with associated
confidence intervals for the two genotypes. The final epidermal cell area distribution considering all leaflets of the first sympodial unit (H) is also shown for the two genotypes.
Fig. 8. Soil water content (swc) dose response of leaf size-related traits in Wva106 plants grown
at five different soil water contents: 0.6, 0.9, 1.2, 1.4 and 1.6 g H2O g-1 dry soil and a severe soil
(this is why the x-axis is broken and soil water content is not quantified by its stable value). Data
are shown for the 9th compound leaf of the first sympodial unit. Each point represents final leaf
area (A), mean epidermal cell number per leaf (B) and epidermal cell areas (C). They were calculated by pooling all leaflets of each leaf. Trends (black full lines) of final leaf area (A, 3 < n
< 6), final mean epidermal cell number per leaf (B, 3 < n < 6) and final epidermal cell area (C,
Fig. 9. Ploidy level distribution
as measured by flow cytometry in mature tomato leaflets of the
9th leaf of the first sympodial
unit of Wva106 plants grown in well-watered conditions (A, soil
water content of 1.4 g H2O g-1
dry soil), in a moderate soil water deficit treatment (B, soil
water content of 0.9 g H2O g-1
dry soil) and a severe soil water deficit treatment (C, drought without re-irrigation). Each single distribution was obtained by pooling distributions obtained for all leaflets of 3 different plants. For each distribution the percentage of nuclei in 2C, 4C, 8C, 16C and 32C is noted on the distributions.
Sup. Fig. 1. Ploidy level distribution as measured by flow cytometry in a young tomato leaf used
as a standard to identify positions of peaks of 2C, 4C, 8C, 16C, 32C and 64C cells.
Sup. Fig. 2. Soil water content dose response of leaflet size-related traits in Wva106 plants
grown in five different stable soil water contents (swc; 0.6, 0.9, 1.2, 1.4 and 1.6 g H2O g-1 dry
soil) and one severe water deficit treatment (swd). Data are shown for different leaflet positions
on the 9th compound leaf of the first sympodial unit. Trends were calculated for the terminal
leaflet (left) and then by pooling data from paired leaflets 2 and 3 (middle) and 4 and 5 (right), according to their organization in symmetric ranks along the rachis (see Figure 2). Trends (black
full lines) of final leaflet area (A,B,C, 4 < n < 14), mean final epidermal cell number per leaflet
(D, E, F, 1 < n < 10) and final cell areas(G, H, I, 75 < ncell < 750) are shown with confidence