HAL Id: hal-00299069
https://hal.archives-ouvertes.fr/hal-00299069
Submitted on 9 Mar 2004
HAL is a multi-disciplinary open access
archive for the deposit and dissemination of
sci-entific research documents, whether they are
pub-lished or not. The documents may come from
teaching and research institutions in France or
abroad, or from public or private research centers.
L’archive ouverte pluridisciplinaire HAL, est
destinée au dépôt et à la diffusion de documents
scientifiques de niveau recherche, publiés ou non,
émanant des établissements d’enseignement et de
recherche français ou étrangers, des laboratoires
publics ou privés.
P. Budetta
To cite this version:
P. Budetta. Assessment of rockfall risk along roads. Natural Hazards and Earth System Science,
Copernicus Publications on behalf of the European Geosciences Union, 2004, 4 (1), pp.71-81.
�hal-00299069�
SRef-ID: 1684-9981/nhess/2004-4-71
© European Geosciences Union 2004
and Earth
System Sciences
Assessment of rockfall risk along roads
P. BudettaDepartment of Geotechnical Engineering, Section of Applied Geology, University of Naples “Federico II” piazzale Tecchio, 80, 80125 Napoli, Italy
Received: 7 August 2003 – Revised: 5 January 2004 – Accepted: 13 January 2004 – Published: 9 March 2004 Part of Special Issue “Landslide and flood hazards assessment”
Abstract. This paper contains a method for the analysis of
rockfall risk along roads and motorways. The method is rived from the Rockfall Hazard Rating System (RHRS) de-veloped by Pierson et al. (1990) at the Oregon State High-way Division. The RHRS provides a rational High-way to make informed decisions on where and how to spend construction funds. Exponential scoring functions are used to represent the increases, respectively, in hazard and in vulnerability that are reflected in the nine categories forming the classification. The resulting total score contains the essential elements re-garding the evaluation of the degree of the exposition to the risk along roads.
In the modified method, the ratings for the categories “ditch effectiveness”, “geologic characteristic”, “volume of rockfall/block size”, “climate and water circulation” and “rockfall history” have been rendered more easy and ob-jective. The main modifications regard the introduction of Slope Mass Rating by Romana (1985, 1988, 1991) improv-ing the estimate of the geologic characteristics, of the vol-ume of the potentially unstable blocks and the underground water circulation. Other modifications regard the scoring for the categories “decision sight distance” and “road geometry”. For these categories, the Italian National Council’s standards (Consiglio Nazionale delle Ricerche - CNR) have been used (CNR, 1980). The method must be applied in both the traffic directions because the percentage of reduction in the decision sight distance greatly affects the results.
An application of the modified method to a 2 km long sec-tion of the Sorrentine road (no 145) in Southern Italy was de-veloped. A high traffic intensity affects the entire section of the road and rockfalls periodically cause casualties, as well as a large amount of damage and traffic interruptions. The method was applied to seven cross sections of slopes adja-cent to the Sorrentine road. For these slopes, the analysis shows that the risk is unacceptable and it should be reduced using urgent remedial works.
Correspondence to: P. Budetta ([email protected])
1 Introduction
Transportation corridors in many regions are often suscep-tible to landslides. Particularly, rockfalls constitute a major hazard in numerous rock cuts along roads in mountainous re-gions giving rise to casualties, as well as a large amount of damage and injuries. For these landslides, analysis of expo-sition to the risk is still a highly complex operation requiring an exact assessment of the hazard (triggering mechanisms and the run out parameters) and the vulnerability of vehi-cles on the roads along the foothills. Vulnerability depends on several factors connected to the type of vehicle/landslide deposit interaction considered. These factors include: the ve-hicle speed and length, the available decision sight distance, the traffic volume, the length of the landslide risk section of the route, the number of occupants in a vehicle, and the type of vehicle. Referring to routes, the “exposition to the risk” due to the landslides is given by the product of the annual probability of landsliding, the vehicle being spatially in the path of the event when it occurs, the vehicle being temporally in the path of the event when it occurs and one or more oc-cupants of the vehicle being killed as a result (adapted from Morgan et al., 1992; Crosta and Frattini, 2000).
Harp and Noble (1993) developed an engineering rock classification system to evaluate seismic rockfall suscepti-bility based on previous method of quantitative description of discontinuities in rock masses from Barton (1978). Sev-eral authors proposed other methods for predicting the run outs paths of rockfalls (Paronuzzi, 1989; Pfeiffer and Bowen, 1989; Pfeiffer et al., 1991; Hoek, 1998; Guzzetti et al., 2002). This methods not only identify the paths of rockfalls, but the height of rock bounce and the velocity-all factors that are useful for evaluating rockfall risk to vehicles along roads.
Some statistical approaches have been proposed for cal-culating the “risk to life” (probability of death in the pop-ulation exposed to the hazard for year: P (D)). Bunce et al. (1997) proposed a method based on binomial distribution to calculate the risk as a function of rockfall frequency re-garding three identified combinations of interaction between
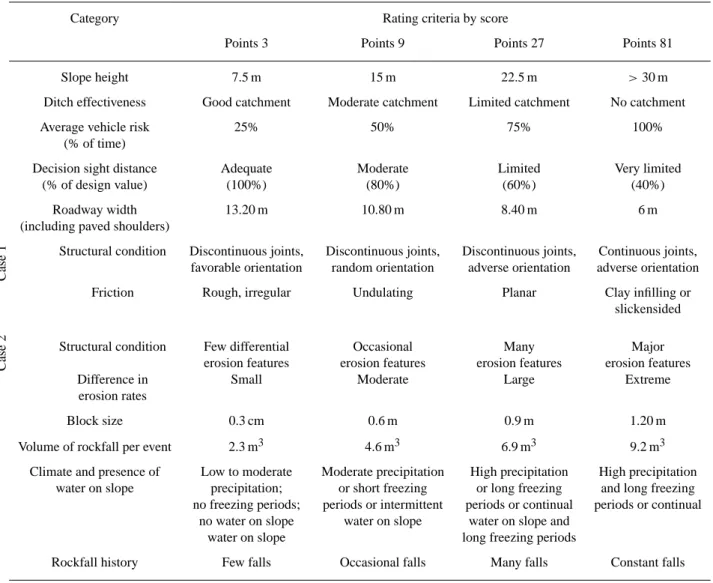
Table 1. Summary sheet of Rockfall Hazard Rating System (after Pierson et al., 1990). Geolog ic cha racter istics Case 2 Case 1
Category Rating criteria by score
Points 3 Points 9 Points 27 Points 81
Slope height 7.5 m 15 m 22.5 m >30 m Ditch effectiveness Good catchment Moderate catchment Limited catchment No catchment Average vehicle risk 25% 50% 75% 100%
(% of time)
Decision sight distance Adequate Moderate Limited Very limited (% of design value) (100%) (80%) (60%) (40%)
Roadway width 13.20 m 10.80 m 8.40 m 6 m (including paved shoulders)
Structural condition Discontinuous joints, Discontinuous joints, Discontinuous joints, Continuous joints, favorable orientation random orientation adverse orientation adverse orientation Friction Rough, irregular Undulating Planar Clay infilling or
slickensided
Structural condition Few differential Occasional Many Major erosion features erosion features erosion features erosion features Difference in Small Moderate Large Extreme erosion rates
Block size 0.3 cm 0.6 m 0.9 m 1.20 m Volume of rockfall per event 2.3 m3 4.6 m3 6.9 m3 9.2 m3
Climate and presence of Low to moderate Moderate precipitation High precipitation High precipitation water on slope precipitation; or short freezing or long freezing and long freezing no freezing periods; periods or intermittent periods or continual periods or continual
no water on slope water on slope water on slope and water on slope long freezing periods
Rockfall history Few falls Occasional falls Many falls Constant falls
the deposit and vehicles: (i) moving vehicle/falling rock, (ii) moving vehicle/fallen rock and (iii) stationary vehicle/falling rock. Within these categories the thickness and distribution of the deposit, the number of people in the vehicle, the speed and type of vehicle will affect the risk of interaction. Another statistical approach has been proposed by Hungr et al. (1999) using the slope of the magnitude – cumulative frequency curves for rockfalls along the main transportation corridors of south-western British Columbia. This procedure accounts only for accidents caused by a direct impact of the landslide deposit on a moving vehicle. For motorways, an approach that was considered to be compatible with the quality of input data available, is the “event tree” analysis (Whitman, 1984; Bunce et al., 1997; Hoek, 1998; Budetta, 2002; Budetta and Panico, 2002). In this analysis, an occurrence probability is assigned to each event in a sequence which could lead to a landslide fatality. The annual probability of death of at least one occupant of a vehicle P (D) resulting from an impact on a landslide deposit is given by the product of the independent probabilities referred to each event in a sequence; e.g.
land-sliding probability in presence of triggering rainfall P (r), vehicle breakdown probability P (b) and significant impact probability resulting in a casualty for at least one occupant P (d). For purposes of land planning and engineering mitiga-tion, the compound probability P (D) may be compared with the acceptable risk guidelines used for engineering construc-tion projects and other human accidents (Guzzetti, 2000; Dai et al., 2002). The statistical approaches of risk analysis are very elaborate and require a large amount of data regarding the recurrence times of the landslides, which are not usually available. In fact, rockfalls that are not considered life threat-ening or significantly damaging usually go unreported. Fur-thermore, the documentation of activity is commonly poor for most roads and complete rockfall records are rare due to the low population density in landslide areas; the lack of re-porting of small events by the companies that manage the roads; the personnel or monitoring costs that would be as-sociated with data. As a result, a high level of sophisticated calculations is inadequate with the quality of the input infor-mation.
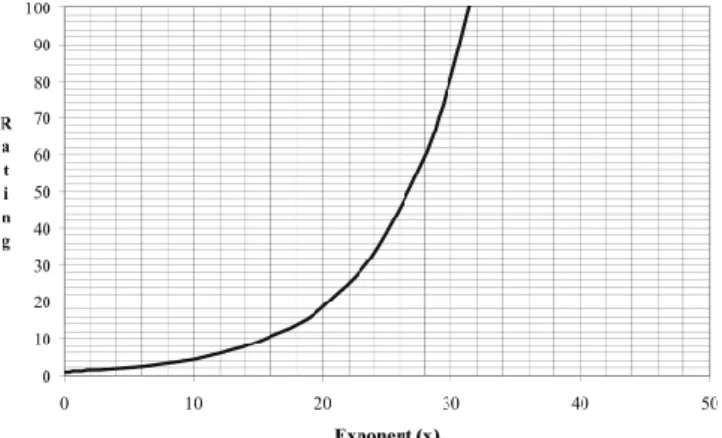
Fig. 1. Exponential scoring graph which can be used for esti-mates of the Rockfall Hazard Rating System (modified from Pierson et al., 1990).
2 The rockfall hazard rating system
In order to assess the exposition to the risk associated with rockfalls, and to prioritize budget allocations for mainte-nance and remediation works, the Oregon Department of Transportation (USA) has developed a classification scheme, designed specifically for motorway cuts, the Rockfall Hazard Rating System (Pierson et al., 1990; National Highway Insti-tute, 1993; Scesi et al., 2001), to identify slopes which are dangerous and require urgent remedial work or further study. This is best summarized in Table 1. As illustrated in Fig. 1, an exponential scoring graph is used because it represents the increases, respectively, in hazard and in vulnerability that are reflected in the nine categories forming the classification. Because this method contains all the elements regarding the rockfall hazard (slope height, geologic character, volume of rockfall/block size, climate and presence of water on slope and rockfall history) and the vehicle vulnerability (ditch ef-fectiveness, average vehicle risk, percent of decision sight distance, roadway width), the resulting total score assesses the degree of the exposition to the risk along roads.
The first step in this process is to make an inventory of the stability conditions of each slope so that they can be ranked according to their rockfall hazard. Then, the rockfall areas identified in the inventory are ranked by scoring the cate-gories as shown in Table 1. Some catecate-gories require a sub-jective evaluation, whereas others can be directly measured and then scored. The rating criteria scores increase exponen-tially from 3 to 81 points and allow quickly to distinguish more dangerous sites.
3 The modified rockfall hazard rating system
Several studies in Southern Italy tested the applicability of RHRS and the method showed some critical aspects (Budetta and Panico, 2002). For example, some categories are de-scribed qualitatively and may lead to appraisals too much subjective and rough and, therefore, not sensitive enough.
This is particularly true for the categories: ditch effective-ness, geologic character, climate and presence of water on slope and rockfall history. So, only very expert users can draw advantage from this method. On the contrary, the method is easy to use for the purposes of land planning be-fore studies of greater detail are performed.
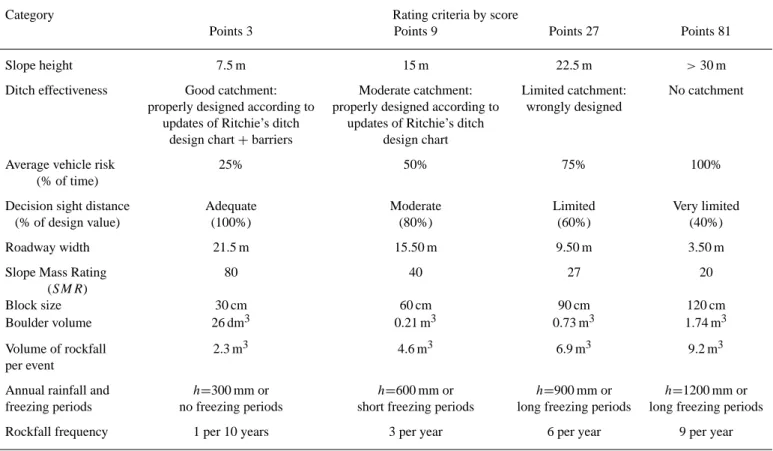
The principal aim of this paper is to describe a modi-fied methodology, pointing out limits and advantages, and to present the changes introduced to improve the aforesaid method. This is summarized in Table 2. In the modified method, the ratings for the categories ditch effectiveness, ge-ologic characteristic, volume of rockfall/block size, climate and water circulation and rockfall history have been rendered easier and more objective. In succession, the categories of the modified method are shown.
3.1 Slope height
Category 1 represents the vertical height of the slope. Mea-surement is from the highest point from which boulder is ex-pected. If boulders come from the natural slope above the cut, the cut height plus the additional slope height (vertical distance) are used. This category is the same as the original. 3.2 Ditch effectiveness
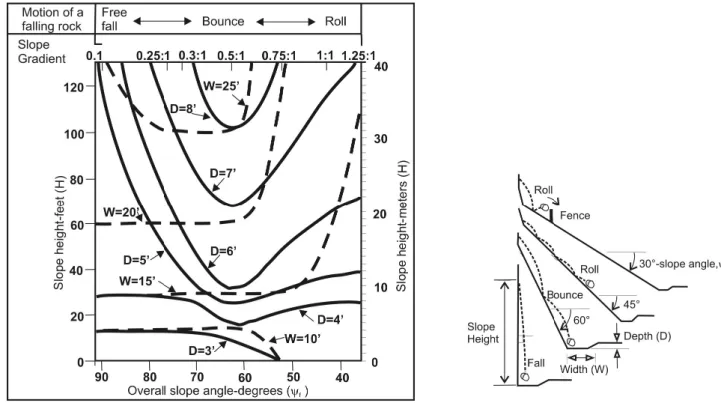
The effectiveness of a ditch is measured by its ability to prevent falling rock from reaching the road. In estimating the ditch effectiveness, the factors to be considered are: (i) slope height and angle; (ii) ditch width, depth, and shape. In the original method this ability is estimated qualitatively. As can be seen from Fig. 2, in the modified method refer-ences are to updates of Ritchie’s ditch design chart (Ritchie, 1963) proposed by Fookes and Sweeny (1976) and White-side (1986). Furthermore, references are made to protection measures (barriers, rock catch fences, wire meshes, etc.) on slopes impending over roads.
3.3 Average vehicle risk
Category 3 represents the spatial probability of occurrence of a vehicle in the rockfall hazard zone. This average vehicle risk (AV R) is obtained by
AV R = (ADT · SL ·100%)/P SP (1) where ADT is the average traffic per day (vehicle/day); SL is the hazard zone length (km); and P SP is the posted speed limit (km/h).
A rating of 100% means that, on average, one vehicle can be expected to be within the hazard zone 100% of the ex-amined time. A high AV R (>100%) indicates that, at any particular time, more than one vehicle is present within the hazard zone (Pierson et al., 1990). This category is the same as the original.
Table 2. Summary sheet of the modified Rockfall Hazard Rating System.
Category Rating criteria by score
Points 3 Points 9 Points 27 Points 81
Slope height 7.5 m 15 m 22.5 m >30 m Ditch effectiveness Good catchment: Moderate catchment: Limited catchment: No catchment
properly designed according to properly designed according to wrongly designed updates of Ritchie’s ditch updates of Ritchie’s ditch
design chart + barriers design chart
Average vehicle risk 25% 50% 75% 100%
(% of time)
Decision sight distance Adequate Moderate Limited Very limited (% of design value) (100%) (80%) (60%) (40%) Roadway width 21.5 m 15.50 m 9.50 m 3.50 m
Slope Mass Rating 80 40 27 20
(SMR)
Block size 30 cm 60 cm 90 cm 120 cm
Boulder volume 26 dm3 0.21 m3 0.73 m3 1.74 m3 Volume of rockfall 2.3 m3 4.6 m3 6.9 m3 9.2 m3 per event
Annual rainfall and h=300 mm or h=600 mm or h=900 mm or h=1200 mm or freezing periods no freezing periods short freezing periods long freezing periods long freezing periods Rockfall frequency 1 per 10 years 3 per year 6 per year 9 per year
Table 3. Tentative description of Slope Mass Rating ( after Romana, 1991).
Class V IV III II I
SMR 0–20 21–40 41–60 61–80 81–100
Description Very bad Bad Normal Good Very good Stability Completely unstable Unstable Partially stable Stable Completely stable Failures Big planar or soil-like Planar or big wedges Some joints or many wedges Some blocks None
3.4 Percent of decision sight distance
Category 4 measures the percentage of reduction in the de-cision sight distance (DSD). DSD represents the length of road (in km) a driver needs in order to make a complex or in-stantaneous decision. The percent of decision sight distance (P DSD) is obtained by
P DSD = (ASD/DSD) ·100% (2) where ASD is the actual sight distance (km).
Because DSD for USA roads is calculated differently as to Italian roads, in the modified method the Italian Na-tional Council standards have been used (Ferrari and Gian-nini, 1975; CNR, 1980). This is best summarized in Fig. 3. The decision sight distance is here considered as the distance
along a roadway within which a 15 cm high stationary object is continuously visible from 1.10 m above the road (i.e. the height of a driver’s eye on the road). DSD is critical when obstacles on the road are difficult to perceive, or when un-expected or unusual maneuvers are required. Furthermore, sight distance can change appreciably throughout a rockfall risk section. Motorway curves, along with obstructions such as rocky outcrops or roadside vegetation, can severely limit a driver’s ability to notice landslide deposit. In addition, poor visibility during stormy weather may cause a reduction in sight distance. In the modified method, actual sight distances (ASD) in the two traffic directions should be evaluated be-cause, normally, an object will be most obscured when it is located just beyond the sharpest part of a curve.
Fig. 2. Modified Ritchie’s design chart to determine required width (W ) and depth (D) of rock catch ditches in relation to height (H ) and
slope angle (ψf) of hillslope (after Whiteside, 1986).
3.5 Roadway width
The available maneuvering width, along a road to avoid a boulder is measured perpendicular to the motorway center-line from one edge of the pavement to the other and in-cludes the shoulders. In the modified method, the Italian Na-tional Council standards have been used (road width classes). Therefore the roadway width doesn’t include the shoulders that are not practical (CNR, 1980).
3.6 Geologic character
As can be seen from Table 1, the original method shows two cases of conditions that cause rockfalls. Case 1 includes slopes or cuts in which joints, bedding planes, or other dis-continuities are the dominant structural features. Rock fric-tion on a discontinuity is governed by the characteristics of the rock material as well as by the surface roughness and properties of any infilling. In Case 2 differential erosion or oversteepened slopes are the dominant conditions that con-trol rockfalls. The different rates of erosion within a slope directly relate to the potential for a future landslide. For these two cases, the scoring criteria are qualitatively fixed and could cause doubts for users on which score to assign.
In the modified method, the Romana’s Slope Mass Rat-ing (SMR-Romana, 1985, 1988, 1991) for slope instability hazard evaluation is introduced. This is best summarized in Table 4. In order to assess the geologic characters that cause rockfalls some parameters are introduced to cover ge-omechanical features of discontinuities (attitude and shear
Fig. 3. Correlations between Decision Sight Distance (Da) and
Vehicle velocity (v) for different longitudinal slopes (i) (after CNR, 1980).
strength of joints), failure modes (planar, wedge and/or top-pling) and cut excavation methods (natural slope, presplit-ting, smooth blasting and bulk blasting). SMR is obtained from RMR (Rock Mass Rating by Bieniawski, 1989) by sub-tracting a factorial adjustment factor depending on the joint – slope relationship and adding a factor depending on the method of excavation. The basic equation is
SMR = RMR − (F1·F2·F3) · F4, (3) where F1 is a factorial depending on parallelism between joints and slope face strikes; F2refers to joint dip angle in
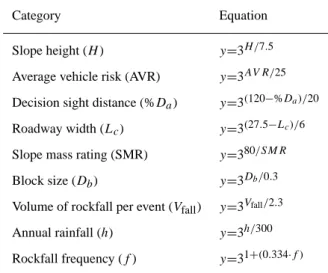
Table 4. Exponential functions for the score computations in the
modified RHRS method.
Category Equation
Slope height (H ) y=3H /7.5 Average vehicle risk (AVR) y=3AV R/25 Decision sight distance (%Da) y=3(120−%Da)/20
Roadway width (Lc) y=3(27.5−Lc)/6
Slope mass rating (SMR) y=380/SMR Block size (Db) y=3Db/0.3
Volume of rockfall per event (Vfall) y=3Vfall/2.3
Annual rainfall (h) y=3h/300 Rockfall frequency (f ) y=31+(0.334·f )
the planar mode of failure, measuring the probability of joint shear strength; F3reflects the relationship between the slope face and joint dip; F4is an adjustment factor for the method of excavation.
Because weathering cannot be assessed with SMR, in cer-tain degradable rock masses (like some marls, prevalently calcareous – marly flysch, etc.) the classification must be applied twice: for actual fresh and future weathered condi-tions (Romana, 1991). Another reason for which Romana’s classification has been used in the modified method is to rate the joint spacing and groundwater conditions of rock masses outcropping on slopes. These parameters appear in other cat-egories of RHRS.
3.7 Volume of rockfall/block size
In the original method there is no reference to which vol-ume to employ, the block volvol-ume before the rockfall or that coming from the fallen boulder on the road. This specifica-tion is very important because the falling rock rarely keeps the original volume without breaking phenomena, after re-peated rebounds on the slope. Consequently, in the modi-fied method, the block volume (Vb) before rockfall has been evaluated statistically by means of the main joint sets spacing data (S1, S2, . . . , Sn) affecting the rockmass. For rockmass with three joint sets (the most frequent case), Vbis given by
Vb=
(S1×S2×S3)
(sin α × sin β × sin γ ), (4) where α, β and γ are the angles between joint sets.
Then, the block size (Db) is given by Db= 3
p
Vb. (5)
3.8 Climate and presence of water on slope
Intense rainfalls, freeze – thaw cycles and groundwater cir-culation contribute to instability and weathering of rockmass. In the RHRS method these causes are qualitatively estimated because thresholds of combined triggering parameters are difficult to assign.
In the modified method, the groundwater circulation is al-ready considered in the Romana’s Slope Mass Rating (SMR) and the slopes are rated according to mean values of an-nual rainfalls. Areas receiving less than 600 mm per year are moderate-precipitation areas. Areas receiving more than 1200 mm per year are considered high-precipitation areas. Finally, for freezing periods the original rating of the RHRS has been applied.
3.9 Rockfall history
In the modified method a careful data base of historical in-formation is necessary for rating. As better rockfalls records are developed, more accurate conclusions for the rockfall po-tential can be made.
3.10 The exponential functions
The exponents of the equation y=3f (x)have been found by means of several attempts and they represent the expressions that best fit the data in Table 2. The complete mathemati-cal description of the functions used to estimate the detailed rating eight categories scores (except ditch effectiveness) is shown in Table 4.
4 An application
The modified method was applied along a 2 km long section of the Sorrentine road (no 145) in Southern Italy. The ge-omorphologic and geomechanic settings of the studied area are shown in Figs. 4 and 5. High road cuts and natural out-crops above the road generate rockfalls along this road seg-ment. As can be seen from Fig. 6, in recent years the area ex-perienced several incidents including some fatalities as well as a large amount of damage and traffic interruptions. The studied area lies on the northern edge of the Sorrentine Penin-sula which is a horst transversally oriented towards the Apen-nine mountain range. The Sorrentine Peninsula is made up of thick Mesozoic dolomitic limestone sequences on which Miocene flysch has been preserved in small structural depres-sions: Quaternary clastic deposits together with pyroclastics also crop out (Budetta et al., 1994).
Road cuts and natural slopes along the road belong to a very long and high (about 100 m) fault scarp strik-ing N280◦ and dipping on average about 50◦; vertical or overhanging slopes are not infrequent. Limestones and dolomitic limestones outcrop with bedding planes dipping about 15◦−20◦west-northwest. The rockmass is very frac-tured and there are many faults (at times with strike-slip lines) and joints most of which can be attributed to major
Fig. 4. Geomorphological map of the study area.
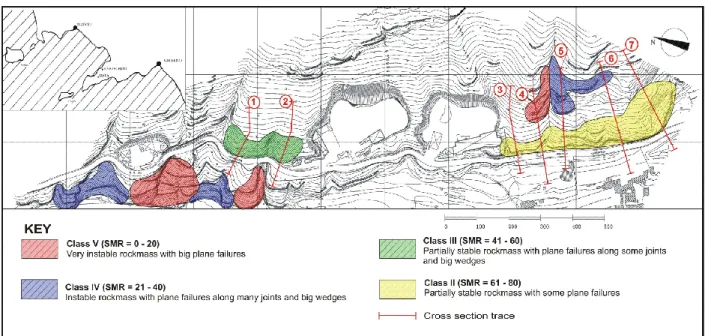
Fig. 5. Slope Mass Rating classes (after Romana, 1991) and cross section traces (red lines) for the modified RHRS method. Class I areas
are absent.
joint sets with a smaller number randomly distributed. The geomorphologic structure is completed by the presence of several small interbedding caves. The Sorrentine road is lo-cated along the base of the foothills and was built during the first decades of the 19th century by the Bourbon Department of Bridges and Roads. The former historical information re-ported by the chief engineer of that period, refers to rockfalls that occurred in 1832 and 1838 during the road construction.
Other landslides occurred between Pozzano and Scrajo vil-lages in 1842 and then in 1951 and 1958. Recent and well detailed rockfalls are referred to the second half of the last century. These are best summarized in Table 5. In the after-math of each rockfall, the National Company which owns the road (Ente Nazionale per le Strade) carried out stabilization works designed to reduce the road vulnerability (e.g. anchor-ages, rock bolts, barriers and draped meshes). The studied
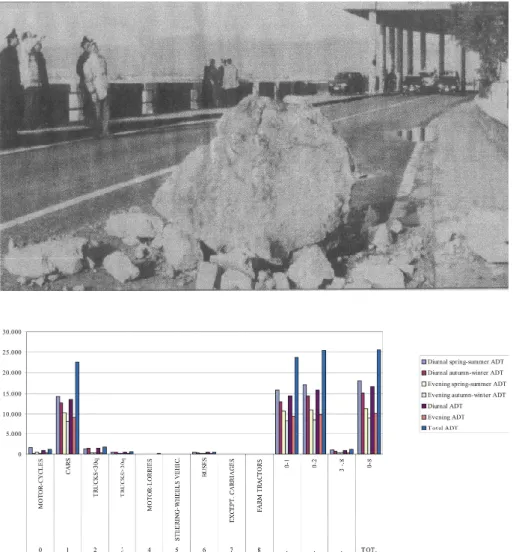
Fig. 6. Rockfalls of the 31 January 2001
event at Punta Orlando (after the “Il Mattino” newspaper of the 2 Febru-ary 2001).
Fig. 7. Average daily traffic (ADT ) recorded at Bivio Schito (km 11 and 800) during the given observation pe-riod (1995) (after Ente Nazionale per le Strade, 2001).
section of the road is without a ditch because there is a very little available space along the crossed fault scarp.
As can be seen from Fig. 7, a high traffic intensity affects the entire section of the road where the Posted Speed Limit (P SP ) is 50 km/h. The average daily traffic was recorded between Meta di Sorrento and Bivio Schito, a distance of 10 km (Ente Nazionale per le Strade, 2001). The recorded traffic at Bivio Schito is representative of the transit in the studied section of the road because at Meta di Sorrento the data are affected by urban traffic. During the year, the aver-age diurnal traffic is nearly constant (13 702 cars per day) but in nocturnal winter periods it is poor for the lack of tourism. About 80% of the traffic is represented by cars. The Sorren-tine road is the only transportation corridor of this area and support a very high movement as well as touristic traffic.
As can be seen from Fig. 5, to establish the Slope Mass Rating (SMR) slopes with several degrees of instabilities have been registered and classified. Frequently the studied slopes are included in Romana’s III and IV classes (Romana, 1988). Unstable or partially stable rock masses, with plane failures along many joints and big wedges, crop out along these slopes. Several analyses have been carried out on seven
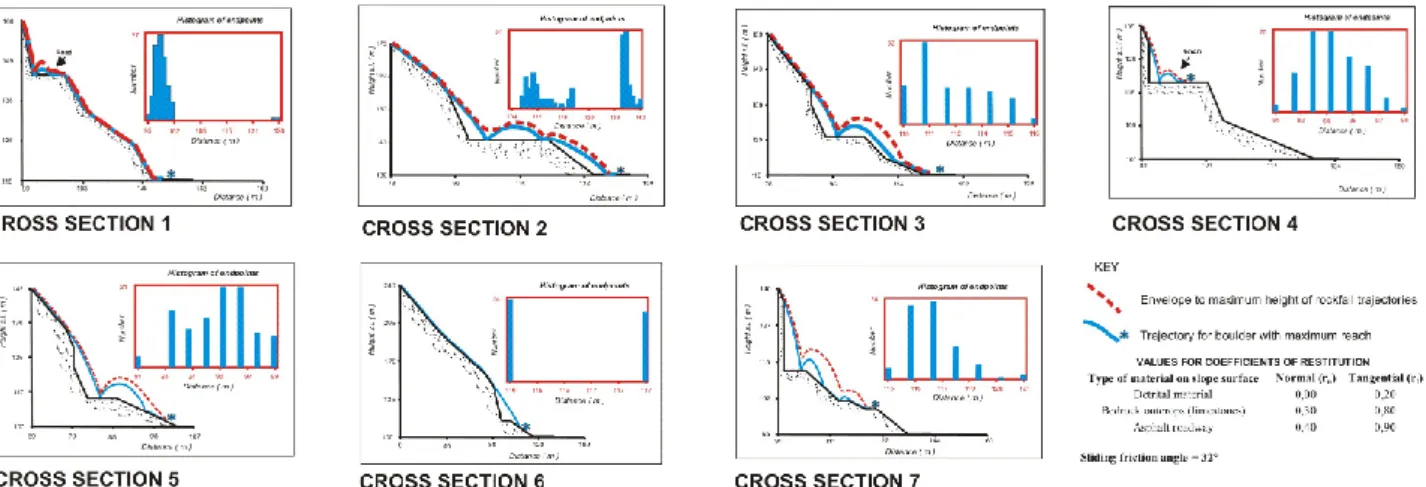
cross sections including the road, by means of Hoek’s rock-fall program (Hoek, 1998) in order to reconstruct the trajec-tories of the boulders and estimate the most reliable kine-matic parameters of the blocks governing the evolution of the phenomena. This is best summarized in Fig. 8. Using this program the maximum potential endpoint was statisti-cally identified for each section by hypothesizing an initial plane sliding along the first straight line cell of the slope, i.e. mostly free fall, a main impact on the road followed by secondary rebounding and rolling until reaching its endpoint. As can be seen from Table 6, near the seven road sections the Decision Sight Distances (DSD) is very variable achieving a minimum value of about 10 m and a maximum of about 42 m. The block sizes (Db) and volumes (Vb) which would fall on the road have been evaluated using the joint set spac-ing data affectspac-ing the rock masses, classified by means of the Romana’s method. This is summarized in Table 7. Three points were assigned to the category “Rockfall frequency” on account of the recorded rockfalls on the road. Furthermore, 40 points were assigned to the category “Annual rainfall” because the studied area is included in a pluviometric region marked by annual rainfalls of about 1000 mm.
Fig. 8. Output of the Hoek’s Rockfall program for the rockfall cross sections.
Table 5. Recent rockfalls along the Sorrentine road.
No Locality Date Notes References
1 “Bikini”, Castellammare 1961 Road damages Civita et al., 1975 2 “Bikini”, Castellammare 21 June 1967 Road damages Civita et al., 1975 3 “Pozzano”, Vico Equense 21 June 1967 Road damages Guida et al., 1986 4 Bagni di Pozzano 14 April 1967 Road damages Guida et al., 1986 5 “Bikini”, Castellammare 1968 Road damages + 1 casualty Budetta & Panico, 2002 6 “Bikini”, Castellammare 1974 Road damages Civita et al., 1975 7 “Pozzano”, Castellammare 1982 Road damages + 1 casualty Budetta & Panico, 2002 8 “Pozzano”, Vico Equense 22 February 1986 Road damages Guida et al., 1986 9 “Pozzano”, Vico Equense March 1986 Road damages Guida et al., 1986 10 “Pozzano”, Vico Equense 25 January 1987 Road damages Budetta & Panico, 2002 11 Meta di Sorrento 1988 Road damages Budetta & Panico, 2002 12 “Seiano” Vico Equense 1998 Road damages Budetta & Panico, 2002 13 Meta di Sorrento 1999 Road damages Budetta & Panico, 2002 14 “Vescovado” Vico Equense 1999 Road damages Budetta & Panico, 2002 15 Meta di Sorrento 2000 Road damages Budetta & Panico, 2002 16 “Vescovado” Vico Equense 2000 Road damages Budetta & Panico, 2002 17 “Punta Orlando” 2001 Road damages Budetta & Panico, 2002
Finally, the rockfall areas impending the road were identi-fied in the inventory and ranked by scoring the categories as shown in Table 8. These categories represent the significant elements of a rock slope that contribute to the overall risk. As can be seen from Fig. 9, the scores recorded for the seven cross sections were ranked in order to identify the most dan-gerous slopes, the total final scores range between 275 and 450. The analysis shows that there is an unacceptable risk and it must be reduced using urgent remedial works.
5 Concluding remarks
The difference in the total final scores between Sects. 1 and 2 (in the direction towards Meta di Sorrento) with respect to all remaining sections is mainly due to Decision Sight Dis-tance (DSD). In fact, the considerable reduction in the
per-centage of DSD for the two traffic directions greatly affects the results. Also the categories Slope Height, Average Vehi-cle Risk and Volume of rockfall/Block size are more sensitive with respect to remaining categories.
In the RHRS’s original method the slopes with scores lower than 300 are classified for remedial works with low urgency, whereas those higher than 500 need immediate sta-bilization measures. It would be better not to assign pre-established values, but in homogeneous areas for geologi-cal characteristics and traffic conditions to employ different remedial works whenever the relative scores have been as-signed. Using a continuum of points allows flexibility in evaluating the relative impact of conditions that are variable by nature. It is to be remembered that this modified Rockfall Hazard Rating System is a preliminary tool for mapping the road risk assessment and then to allow more detailed
Table 6. Decision sight distances (Da) and percent of decision sight
distances (%Da) in the main rockfall risk sections of both lanes of
the Sorrentine road.
Road hazard Da∗(m) D∗a(%) Da∗∗(m) D∗∗a (%) section - distance 1 – (km 21 + 156) 30 71 10 24 2 – (km 21 + 206) 30 71 16 38 3 – (km 21 + 578) 42 100 32 76 4 – (km 21 + 618) 42 100 42 100 5 – (km 21 + 660) 42 100 42 100 6 – (km 21 + 720) 42 100 42 100 7 – (km 21 + 800) 38 90 42 100
D∗a: Decision sight distance in the direction towards Naples
D∗∗a : Decision sight distance in the direction towards Meta di Sorrento
Table 7. Block volume (Vb), block diameter (Db) and related scores according to the modified RHRS method.
Road hazard Vb(m3) Db(m) Rating
section - Distance 1 – (km 21 + 156) 0.13 0.51 6.47 2 – (km 21 + 206) 0.04 0.34 3.47 3 – (km 21 + 578) 0.36 0.71 13.46 4 – (km 21 + 618) 0.14 0.52 6.71 5 – (km 21 + 660) 0.52 0.80 18.72 6 – (km 21 + 720) 0.42 0.75 15.59 7 – (km 21 + 800) 0.09 0.45 5.20
investigations with geothecnical and geomechanical stabil-ity analyses in dangerous areas. Further applications in other geological environments are needed to better check its suit-ability for rockfall risk assessment.
Acknowledgements. The author is grateful to referees M. Parise
and G. F. Wieczorek for their manuscript revision and valuable comments. Funding for this research was provided by CNR -GNDCI (Italian National Research Council - National Group for the Defense against Hydrogeological Disasters).
Edited by: P. Reichenbach
Reviewed by: G. F. Wieczorek and M. Parise
References
Barton, N. (Coordinator): Suggested methods for the quantitative description of discontinuities in rock masses, Int. J. of Rock Mech. and Min. Sc. and Geomech. Abstracts: Int. Soc. for Rock Mech. Commission on Standardization of Laboratory and Field Tests, 15, 319–368, 1978.
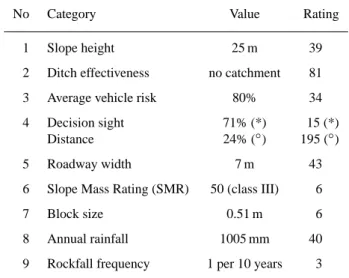
Table 8. Application example of the modified RHRS method: (*)
in the direction towards Naples; (◦) in the direction towards Meta di Sorrento.
No Category Value Rating
1 Slope height 25 m 39 2 Ditch effectiveness no catchment 81 3 Average vehicle risk 80% 34 4 Decision sight 71% (*) 15 (*)
Distance 24% (◦) 195 (◦) 5 Roadway width 7 m 43 6 Slope Mass Rating (SMR) 50 (class III) 6 7 Block size 0.51 m 6 8 Annual rainfall 1005 mm 40 9 Rockfall frequency 1 per 10 years 3
Fig. 9. Total scores recorded for the seven cross sections along
Sorrentine road.
Bieniawski, Z. T.: Engineering Rock Mass Classifications, Wiley, New York, 1989.
Budetta, P.: Risk assessment from debris flows in pyroclastic de-posits along a motorway, Italy, Bull. Eng. Geol. Env., 61, 293– 301, 2002.
Budetta, P. and Panico, M.: Il metodo “Rockfall Hazard Rating Sys-tem” modificato per la valutazione del rischio da caduta massi, Geologia Tecnica ed Ambientale, 2, 3–13, 2002.
Budetta, P., Calcaterra, D., and Santo, A.: Engineering – geological zoning of potentially unstable rock slopes in Sorrentine Penin-sula (Southern Italy), Proc. 7th Int. IAEG Congr., Balkema, Rot-terdam, 2119–2126, 1994.
Bunce, C. M., Cruden, D. M., and Morgenstern, N. R.: Assessment of the hazard from rockfall on a highway, Can. Geotech. J., 34, 344–356, 1997.
Civita, M., De Riso, R., Lucini, P., and Nota d’Elogio, E.: Studio delle condizioni di stabilit`a dei terreni della Penisola sorrentina, Geol. Appl. e Idrogeol., 10, 129–188, 1975.
Consiglio Nazionale delle Ricerche – CNR: Norme tecniche per le costruzioni stradali, Pon 1V, 11–15, 1980.
Crosta, G. and Frattini, P.: Metodi per la valutazione del rischio da fenomeni di instabilit`a di versante, Dip. Scienze Geologiche e Geotecnologie – Universit`a degli Studi di Milano Bicocca – Ufficio Rischi Geologici Regione Lombardia, Milano, 2000. Dai, F. C., Lee, C. F., and Ngai, Y. Y.: Landslide risk assessment
and management: an overview, Eng. Geol., 64, 65–87, 2002. Ente Nazionale per le Strade: Dati sul traffico medio giornaliero al
Bivio Schito e Meta di Sorrento, Unpublished report, 2001. Ferrari, P. and Giannini, F.: Geometria e progetto di strade –
Ingeg-neria stradale, I, ISEDI, Milano, 1975.
Fookes, P. G. and Sweeny, M.: Stabilization and control of local rockfalls and degrading rock slopes, Quart. J. Eng. Geol., 9, 37– 55, 1976.
Guida, M., Pagano, D., and Vallario, A.: I fenomeni franosi della Penisola sorrentina, pubbl. no 33, Dip. Scienze della Terra, Napoli, 1986.
Guzzetti, F.: Landslide fatalities and the evaluation of landslide risk in Italy, Eng. Geol., 58, 89–107, 2000.
Guzzetti, F., Crosta, G., Detti, R., and Agliardi, F.: STONE: a com-puter program for the three-dimensional simulation of rockfalls, Computers and Geosciences 28, 1079–1093, 2002.
Harp, E. L. and Noble, M. A.: An engineering rock classification to evaluate seismic rockfall susceptibility and its application to the Wasatch Front, Bull. of the Assoc. of Engineering Geologists, 30, 295–319, 1993.
Hoek, E.: Practical Rock Engineering, Rocscience, Toronto, 1998. Hungr, O., Evans, S. G., and Hazzard, J.: Magnitude and frequency
of rockfalls and rock slides along the main transportation cor-ridors of southwestern British Columbia, Can. Geotech. J., 36, 224–238, 1999.
Morgan, G. C., Rawlings, G. E., and Sobkowicz, J. C.: Evaluating total risk to communities from large debris flows, in: Geothec-nique and natural hazards, Bi Tech Publishers, Vancouver, 225– 236, 1992.
National Highway Institute: Rockfall Hazard Rating System partic-ipant’s manual, NHI Course No. 130220, U.S. Dept. of Trans-portation, Federal Highway Administration, Publication No. FHWA SA-93–057, 1993.
Paronuzzi, P.: Probabilistic approach for design optimization of rockfall protective barriers, Q. J. Eng. Geol., 22, 175–183, 1989. Pfeiffer, T. J. and Bowen, T.: Computer simulation of rockfalls, Bull. of the Assoc. of Engineering Geologists, 26, 135–146, 1989.
Pfeiffer, T. J., Higgins, J. D., Schultz, R., and Andrew, R. D.: Col-orado rockfall simulation program users manual for version 2.1, Colorado Dept. of Transp., Denver, 1991.
Pierson, L. A., Davis, S. A., and Van Vickle, R.: Rockfall Haz-ard Rating System – Implementation Manual, Federal Highway Administration (FHWA), Report FHWA-OR-EG-90–01, FHWA, U.S. Dep. of Transp., 1990.
Ritchie, A. M.: Evaluation of rockfall and its control, U.S. Depart-ment of Commerce, Bureau of Public Roads, and the Washington State Highway Commission, 1963.
Romana, M.: New adjustment ratings for application of Bieniawski classification to slopes, Proc. Int. Symp. on “The role of rock mechanics”, Zacatecas, 49–53, 1985.
Romana, M.: Practice of SMR classification for slope appraisal, Proc. 5th Int. Symp. on Landslides, Balkema, Rotterdam, 1227– 1229, 1988.
Romana, M.: SMR Classification, Proc. 7th Int. Congr. on Rock Mech., Balkema, Rotterdam, 955–960, 1991.
Scesi, L., Seno, S., Gioia, U., and Mazzucchelli, A.: Pareti rocciose instabili e strade: un sistema di valutazione delle priorit`a di inter-vento, Associazione Georisorse ed Ambiente (GEAM), Torino, 92–102, 2001.
Whiteside, P. G. D.: Discussion on rockfall protection measures, Conf. on Rock Eng. and Excavation in an Urban Env., Institution of Mining and Metallurgy, Hong Kong, 490–498, 1986. Whitman, R. V.: Evaluating calculated risk in geothecnical