HAL Id: halsde-00546980
https://hal.archives-ouvertes.fr/halsde-00546980
Submitted on 30 May 2020
HAL is a multi-disciplinary open access
archive for the deposit and dissemination of
sci-entific research documents, whether they are
pub-lished or not. The documents may come from
teaching and research institutions in France or
abroad, or from public or private research centers.
L’archive ouverte pluridisciplinaire HAL, est
destinée au dépôt et à la diffusion de documents
scientifiques de niveau recherche, publiés ou non,
émanant des établissements d’enseignement et de
recherche français ou étrangers, des laboratoires
publics ou privés.
Changes in soil properties in a fluvisol (calcaric)
amended with coal fly ash
A. Riehl, F. Elsass, J. Duplay, F. Huber, M. Trautmann
To cite this version:
A. Riehl, F. Elsass, J. Duplay, F. Huber, M. Trautmann.
Changes in soil properties in a
fluvisol (calcaric) amended with coal fly ash.
Geoderma, Elsevier, 2010, 155 (1-2), pp.67-74.
Changes in soil properties in a
fluvisol (calcaric) amended with coal fly ash
A. Riehl
a, F. Elsass
b, J. Duplay
a,⁎
, F. Huber
a, M. Trautmann
ca
Laboratoire d'Hydrologie et de Géochimie de Strasbourg, UMR 7517 CNRS, 1 rue Blessig 67084 Strasbourg Cedex, France
b
Institut National de Recherche Agronomique, route de Saint-Cyr 78026Versailles, France
cUMS 830 UDS/CNRS, Laboratoire d'Analyses des Sols et des Formations Superficielles, 3 rue de l'Argonne 67083 Strasbourg Cedex, France
a b s t r a c t
a r t i c l e i n f o
Article history: Received 25 March 2009
Received in revised form 17 November 2009 Accepted 23 November 2009
Available online 16 December 2009 Keywords:
Soil physico-chemical properties Coalfly ash
Amendment Soil geochemistry Microcosms Leaching
Fluidized bed combustion ash (FBC) is a by-product from coal-fired power stations used for many decades in concrete, cement and brick manufacturing and more recently for trace metal immobilization and pesticide retention in soils. Moreover FBC ash has been recommended by some authors as a soil amendment in agriculture for its nutrient supply. In this study silico-aluminous (SiAl) and sulfo-calcic (SCa)fly ashes have been added to afluvisol (calcaric) sampled in the Rhine River plain (Germany) in order to investigate the physical, chemical and physico-chemical possible modifications of the amended soil. Earthworms were introduced into microcosms hydrated with a solution of water and CaCl2(3.7 10− 4mg/L; pH = 6.2) and
stabilized during 7 and 14 weeks. Batch leaching tests were performed during 6 weeks on the amended soil in order to obtain data on the mobilization potential of major elements (NH4+, Na+, K+, Mg2+, Cl−, Ca2+,
NO3−, SO42−, PO43−, H4SiO4) and trace elements (Sr, Ba, V, Zn, Cu, Co, As, Ni, Mo, Cr, Cd, Pb) during ash–soil–
water interactions. The main modification is an increase in pH (≈12) of soil water in soil amended with sulfo-calcic ash, whereas soil pH only slightly changes in the other soil as compared to control soil. This alkaline pH causes a strong mortality of the macrofauna and a higher mobility of Co, Ni and V on the contrary to Cr, Cu, Pb and Zn which are less mobile and more strongly retained by soil. Soil physico-chemical properties remain generally similar to control soil in soil amended with silico-aluminous ash (SiAl) but show major differences in the case of soil amended with sulfo-calcic ash (SCa). The sulfo-calcic ash therefore seems less adapted to integration in soils from an agricultural and farming point of view, contrary to the silico-aluminous ash which increases the cation exchange capacity, thus improving the nutrient and water reserve for plants.
© 2009 Elsevier B.V. All rights reserved.
1. Introduction
In a world context where the management of waste, the efficiency of agriculture as well as the quality of the environment become priorities, the fate of industrial ashes is of great concern. Fluidized bed combustion ash (FBC), a by-product from lignite-fired power stations, has been used in concrete, cement and brick manufacturing for many decades (Saint-Ame, 1998). Recently authors have reported about their efficiency in trace metal immobilization in soils and mine tailings and in pesticide retention in soil (Bertocchi et al., 2006; Majumdar and Singh, 2007; Shaobin Wang and Terdkiatburana, 2008).
Some authors studied the properties of soils after amendment with ash (Aitken et al., 1984; Sikka and Kansal, 1994; Desmukh et al., 2000; Grewal et al., 2001; Kalra et al., 2003). When alkaline,fly ash can be added to increase the pH of acidic soils; it can also act as a soil modifier to upgrade the physical properties and improve the texture, upgrade the chemical and biological quality of soil (increase in cation
exchange capacity, capacity of water retention, nutrient availability) and thus participate in the optimization of plant growth (Chang et al., 1977; Phung et al., 1979; El-Mogazi et al., 2001).
Douay et al. (2002)have tested the effect offly ash integration on the bioavailability of toxic elements in calcium carbonate rich soils but noticed a reduced emergence of the seedlings and delayed growth with respect to the control soil. They explained it by a rise in pH and a poor integration of ashes with the soil. Grumiaux et al. (2007)
evidenced toxicity on earthworms after integration of ash in soil and attributed it to soil pH. However, we think that not only pH but also soil texture and structure, and water retention may have played a role in growth delay of seedlings and difficulty for worms to integrate ashes in soil.
Only few studies were devoted to the physico-chemical modi fica-tions such as water retention and stability, induced by fly ash amendment into calcium carbonate rich soil. The aim of the present study is to investigate these possible changes of afluvisol (calcaric) from the Rhine River plain improved by two types of fly ashes (silico-alumineous and sulfo-calcic ashes) considered as decontaminating media.
⁎ Corresponding author. Tel.: +33 3 90 24 04 24; fax: +33 3 90 24 04 02. E-mail address:[email protected](J. Duplay).
0016-7061/$– see front matter © 2009 Elsevier B.V. All rights reserved. doi:10.1016/j.geoderma.2009.11.025
Contents lists available atScienceDirect
Geoderma
2. Material and methods 2.1. Soil sampling and analyses
The soil used in the present study was taken from a periurban zone in the Rhine River plain, close to Strasbourg city (France). According to the World Reference Base for Soil Resources (IUSS Working Group WRB, 2007) the soil is a haplicfluvisol (calcaric) developed over a carbonated sandy loam formation representative of the river alluvia deposited in the Rhine Graben. It comprises a silty loam layer (0–30 cm) overlying more sandy layers (30–100 cm) corresponding to quaternary Rhine alluvia deposited on a deep clayey layer (100– 140 cm) interpreted as a Rhine overflow deposit. The soil has already been studied byLahd Geagea (2007)who also traced the environ-mental pollution in dust, barks and lichen around the site by Pb, Sr, Nd, and C isotopic ratios, showing a slight contamination in lead in the 0–18 cm A0 horizon, as do most of soils in urban and perinatal areas (Elsass et al., 2006). It was therefore interesting to investigate the influence of fly ash amendment on the physico-chemical properties and trace element retention capacity of this type of soil. The site is located in Germany (UTM 32 coordinates: 570413597N 5384604E;
Riehl, 2008). After digging in a soil profile under the native forest, samples were collected from the surface 0–30 cm depth which corresponds to the A horizon.
The physico-chemical characteristics of thefine earth (sieved at 2 mm) were determined using the following standard analytical procedures: for pH and Eh, the standard procedure NF EN 12176; total organic carbon (TOC) by the volume of lost gas during the total dissolution of carbonates by HCl (volumetric calcimetry, NF ISO 10693); organic matter content (OM) by calcination at 375 °C during 16 h after predrying at 150 °C (NF EN 12875); cation exchange capacity (CEC) by the Metson method (NF X31-130, 1993); structural stability using standard procedure NF X 31-515 (June 2005); bulk mineralogy and clay mineralogy by XRD (Brücker D5000, bulk analysis: 3–65° 2θ scanning angle, clay analysis: 2–30° 2θ scanning angle, 1 s–0.02° upward step, Cu anticathode, wave length λKα1= 1.54056 Å, 30 mA current, 40 kV voltage); C, H, S, N analyses
were performed by the SCA CNRS laboratory in Lyon by thermal conductimetry or IR detection after combustion at 1050 °C for C, H and N, and 1350 °C for S, with a precision of 0.3%; major and trace elements in soil were analysed by ICP-AES and ICP-MS (Jobin Yvon 124 and VG PQ 2+).
2.2. Fly ash selection and analysis
Fly ash is a residue of combustion of carbon fossil material in coal-fired thermal power plants. Ashes are captured by various filtration processes before gases escape to the atmosphere.
These residues are classified in wastes from power stations and other combustion plants and assigned code number 10 01 02 in the waste list of the European community (decision 2001/118/CE, January 16th, 2001 modifying decision 2000/532/CE as regards the list of waste). They are considered as non hazardous waste contrary to wastes of incineration. Considering French legislation, they are neither classified as special industrial waste (Decree 97–517, May 15th, 1997), nor as dangerous waste (MEDD, 1998, 2002).
Fluidized bed combustion ashes were supplied by Surschiste S.A. and collected from the Carling (SiAl) and Gardanne (SCa) coal thermal power plants, France. They result from the combustion of pulverized coal at low temperature (850–880 °C) and are mainly alkaline.
The chemical composition of SiAl and SCafly ashes was obtained by ICP-AES analyses; CEC measures were performed by the Metson method. Scanning electron microscopy (SEM) observations and chemical micro analyses were done on a TESCAN Vega 2 XMU Low vacuum, coupled with a micro analytical device (EDAX PEGASUS).
2.3. Microcosm settings
Terra-cotta flowerpots 17 cm deep were used as microcosm settings. Soil samples from the A horizon (0–30 cm) were homoge-nized and placed in the microcosms and supplemented by FBC moistened ashes (6% in mass of the total mass contained in the microcosms). FBC ash was mixed with the soil by hand.
Five media were tested: artificial soil considered as control (T), artificial soil with silico-aluminous ash (TSiAl (7)) or with sulfo-calcic ash (TSCa (7)) incubated for seven weeks in order to stabilize pH according to the experiments ofGrumiaux et al. (2007)and fourteen weeks (TSiAl (14) and TSCa (14) step at which worms may have gained weight. Control soil (T) as well as soils TSiAl (7) and TSCa (7) were duplicated to examine the analytical reproducibility and heterogeneity of the samples.
Earthworms taken from an untreated biological garden were introduced into each microcosm. As they are qualified as structure engineers of soil (Jongmans et al., 2003) they enable reproducing a natural soil structure in microcosms and form aggregates by mixing ash and soil. Thefirst period of microcosm setting procedure was needed as the introduction of ash in soil caused earthworm mortality in TSCa mixtures, probably due to the increase in pH (Grumiaux et al., 2007). In general even in the best conditions of earthworm survival in microcosms, the mortality was higher in TSCa mixtures than in TSiAl. Microcosms were regularly hydrated with a solution of water and CaCl2(3.7 10−4mg L−1, pH= 6.2). This choice was made to simulate the
pH and ionic strength of natural rainwater, knowing that the rainwater pH in the region ranges between 6.3 and 6.9 (Elsass et al., 2006) and that the ionic strength is nearly 1.10−4mol L−1(Elsass, personal communi-cation, unpublished). This choice is justified by the fact that the pH of water is a key parameter affecting the mobility of trace elements in soil but also in ashes (Jankowski et al., 2006). The choice of the addition of CaCl2to pure water, instead of ammonia as chosen byJankowski et al.
(2006)or of MgCl2(Rousseau, 2003), was justified considering that an
important part of the watering of land comes from the water table or from rivers and has a conductivity of 414 µS cm−1. On the other hand the presence of calcium induces flocculation, but as the soil is already saturated in calcium, the addition of CaCl2will have no side effect (Tessier
et al., 1999). Two samples of the watering solution were analysed by spectrometry (ICP-AES and ICP-MS).
After 7 and 14 weeks, the soils were dried and dry sieved through 2000, 1000, 500, 100 and 50 µm mesh sieves and by hand selection with tweezers of 2 to 5 mm aggregates for structural stability measures. Water adsorption experiments were carried out on less than 500 µm aggregates, considering that they are thefirst aggregates formed by worms after mixing of soil and ash (Marinissen and Didden, 1997; Jongmans et al., 2003), and thus contain the macro and micro-aggregates the most rich in organo-clay assemblages (Christensen, 1992; Puget, 1997).
2.4. Isothermal sorption of water vapour
The method of relative humidityfixed points (HR) was used for the measurements of humidity established at constant ambient tempera-ture over-saturated salt solutions. Relative humidities were chosen according to the scale of relative humidity of air, certified against saturated salt solutions. They are prescribed by the “Organisation Internationale de Métrologie Légale” (1996)according to the descrip-tion in the standard ISO 483 and in the nadescrip-tional standards [NF X 15-014 and 15-119].
Water adsorption experiments were performed at increasing relative humidity (8.8, 14.2, 22.5, 32.8, 45.9, 64.4, 75.2, 84.7, 92.3 and 93%). An amount of 0.5 g of sample previously dried for 24 h at 110 °C was deposited in a glass cup of known mass and placed in a plastic desiccator (2 L) where the relative humidity was kept constant andfixed by an over-saturated salt solution. The sample lies close to
the salt solution, while avoiding the contact with it ( Montes-Hernandez et al., 2003). In that way the hygrothermal balance is quickly and uniformly reached. The desiccators were kept at a constant temperature (25 °C) and atmospheric pressure (about 1 atm) in a cool incubator. The evolution of the water content of samples and of a control cup without sample was measured by weighing every day with a digital balance (accuracy = 0.0001 g) until equilibrium was reached.
2.5. Leaching experiments
The basic principle of the leaching device consists offiltration of percolating water through the soil. The container is a two stage Millipore filtration box for fluid analysis with a 10 cm internal diameter. At the bottom of thefiltration cell were placed successively a pyroxylin 5 µm filter, a layer of fibreglass, and a bed of inert silica balls consisting a mixture of 30% of balls less than 100 µm diameter and 70% of 100 µm diameter, a second bed of silica balls with 70% of balls less than 100 µm diameter and 30% of balls of 100 µm diameter; the whole set allows creating a suction gradient and homogenizing the drainage of the percolating water. In that way, no barrier is created and the capillary force is normal or slightly positive (Perdrial et al., 2008).
The leaching water is the same as the solution used to hydrate the soil in microcosms: pure water added with CaCl2(3.7 10− 4mg L− 1).
Three times a week during six weeks, soil columns were sprayed with 150 mL of leaching solution to simulate heavy rain. The eluates were collected every week and analysed by atomic absorption spectrom-etry (Hitachi Z8200) for Na+, K+, Mg2+and Ca2+, ionic
chromatog-raphy (Dionex) for Cl−, NO2−, NO3−, SO42−, PO43−, Br−, colorimetry
(Technicon) for NH4+and H
4SiO4, and by ICP-MS and AES for trace
elements.
2.6. Statistical analyses
Paired tests on the different data have been done by the Kruskal– Wallis method with a significance level of 0.05 to compare the soils, and treatments. This tool carries out the non-parametric Kruskal– Wallis test for the comparison of more than two independent samples. It also allows non-parametric two by two comparisons (i.e. multiple or“post hoc” comparisons), taking into account the number of groups in the experiment (Siegel and Castellan, 1988). Moreover a multidimensional statistical treatment, the analysis in principal components (PCA) was applied by using the XLSTAT (2008) software in order to determine the correlations between the different variables of soil and eluate data.
3. Results
3.1. Soil andfly ash characteristics
The soil constituents are quartz, calcite, dolomite, microcline, albite, and clays. The clayey fraction consists of 40% of non swelling clay (kaolinite, illite) and 60% of swelling clay (smectite, vermiculite, mixed-layer illite-vermiculite and illite-smectite). The soil is rich in calcium carbonates (17% limestone on average), pH is basic (8.1), Eh slightly negative (−57 mV), CEC low (7.5) and the organic matter content ranges between 3.3% and 6.9%.
Major element analysis shows that soil is Si, Ca and Al rich with a slightly higher Si content in the A1 horizon. The main difference between A0 and A1 is in the texture which is dominantly silty–clayey in A0 and sandy–silty in A1.
Trace element analyses show that the Pb content is higher in the surface horizon (42 ppm) as compared to the lower A1 horizon (27 ppm), but still under thefixed impact value (FIV=400 mg kg− 1
dry matter of soil). Fixed impact values are based on studies of the evaluation of toxicity for the human health within the framework of
generic scenarios of exposure of the populations to these substances. These values take into account the chronic risks for the health of the populations in relation with the current use of sites (INERIS, 2001; BRGM, 2003). The superficial Pb content confirms the anthropogenic influence in that zone as already noticed byElsass et al. (2006)for other soils in the Strasbourg urban area. The enrichment in Pb in the upper horizon can also be related to the organic matter content (6.9% in A0 and 3.3% in A1). All analysed element contents lie below the FIV value (Table 1).
The C/N ratio rather high (27.4) denotes a weak mineralization according to Duchauffour (1995): the lower the nitrogen content, the higher the C/N ratio, the lower the speed of mineralization. This is typical of forest soils under temperate climate.
Thefly ashes used in this study can be qualified by their chemical composition (Roy et al., 1981) and their sulphur content ( Rakotoar-isoa, 2003): SiAl as silico-aluminous and SCa as sulfo-calcic. Quartz, calcite and iron oxides are the common mineral constituents. The SiAl ash also contains feldspar, and SCa ash anhydrite.
The main difference in chemical composition between SiAl and SCa is the silica content (43.7% and 19.9% SiO2 respectively), the
aluminium content (20.5% and 10.6% Al2O3 respectively) and the
calcium content (12.1% and 35.7% CaO, respectively). The S content varies between 2.4% in SiAl and 5.9% in SCa depending on the type of materialfired in the thermal power plant (Lecuyer et al., 2001). Trace element contents are above the FIV value for Cr in SiAl (148 vs. 130 µg g− 1), and for Ni in SCa (398 vs. 140 µg g− 1) (Table 1).
Thefly ashes SiAl and SCa have a cation exchange capacity (CEC) of 2.2 and 5.8 cmol kg− 1 respectively which is very low for SiAl and similar to kaolinite for SCa. The high Ca content results in a high alkalinity of the ashes (13.25 and 13.29 respectively), and Eh is very negative (−320 and −320 mV respectively) indicating reducing conditions in these materials.
Ash particles arefine grained, with a size in general less than 5 µm in SiAl and less than 10 µm in SCa. On average,fine grained particles dominate in both samples as 62% arefine silty and 38% are clayey in SiAl whereas in SCa 85% arefine silty and 15% clayey (Table 1). Particle shapes are diverse with more rounded grains in the coarser fraction and round, angular or laminar grains in thefiner fraction. Coarse silt grains in SiAl look like agglomerates offiner particles whereas in SCa they appear more homogeneous and less aggregated.
3.2. Changes in soil characteristics after FBC ash addition 3.2.1. Chemistry
After 14 weeks of incubation chemical variations are observed in the different mixtures with respect to the control soil, which are related to the nature of the added ash. Soil TSiAl shows an increase in Al (2.1% wt ox.) with respect to the control soil. Soil TSCa is characterized by a significant increase in Ca (5.3% wt ox.). In both cases, there is a decrease in Si (3.6% for TSiAl and 10% for TSCa). The slight decrease in Na in TSCa and slight increase in Fe in TSiAl are within measurement error intervals. The Mg, Mn, Ti and P contents remain unchanged. The concentrations in N are low (0.1–0.2%) and remain constant in the mixtures as well as the H content. The concentration in C in TSCa is significantly higher than in the control soil as well as the S content.
When comparing the evolution of the mixtures from 7 weeks to 14 weeks of incubation one can notice an increase in Si (0.6% with SiAl and 2% with SCa) and a loss Al (2.5% for TSiAl and 0.5% for TSCa). The Ca content increases in TSiAl and decreases in TSCa (Table 1). Concentra-tions in K and Ti also decrease slightly in both mixtures whereas the concentration in Mg slightly increases. Concentrations in Mn, Na and P remain unchanged (Table 1). The Fe content is stable for mixtures with SCa and decreases for mixtures with SiAl. The S content decreases in TSCa after 14 weeks and the N content remains unchanged.
Paired tests show that some trace element contents increase significantly in soils mixed with ash with respect to the control soil. This can be observed after 7 weeks of incubation for Ba, Co, Cu, Ni, Pb, Sr, V, and Zn. Samples containing SCa show the highest Cu, Ni, Sr, and V contents, whereas samples with SiAl show higher Ba, Cr, and Pb contents. Only Pb exceeds the FIV value in all mixtures (859 and 825 µg g−1respectively).
Element contents normalized to control soil show a strong decrease in Ba, Cu, Co, Pb, and V after 14 weeks in TSiAl and TSCa (Fig. 1).
According to paired tests comparisons, the most significant differences between control soil (T) and mixtures with ash (TSiAl and TSCa) are in their Al, Fe, K, Na, P, Sr, V and Ni contents.
3.2.2. Physico-chemical characteristics
3.2.2.1. C/N ratio, CEC, pH, Eh and soil texture. The C/N ratio is very high (N20) and influenced by FBC ash composition. In the case of soils mixed with SiAl ash, the ratio is the lowest after 7 weeks whereas it reaches 42 after 14 weeks. For soils mixed with SCa ash, the C/N value is 31 after 7 weeks and decreases slightly, reaching 26.5 after 14 weeks, a level equivalent to the control soil.
The cation exchange capacity in TSiAl and TSCa which was lower (7.1 and 6.9 respectively) than in control soil (7.8) after 7 weeks, increases in both samples after 14 weeks, and in a higher extent in the case of TSiAl.
The soil pH ranges between 8 and 8.5. There is no significant difference in the pH or Eh values (−50 to −75 mV) for the different samples.
The control soil corresponds to a mixture of the sampled A0 and A1 horizons and can be classified at the border between silty loam and loam. Mixtures TSiAl and TSCa plot in the same domains.
3.2.2.2. Structural stability. Three treatments simulate different conditions of humidity: strong stormy rain or irrigation by submersion for the quick humidification by immersion, moderate rain for slow capillary humidification, and long humidity periods for example in humid winter seasons for mechanical disintegration. The structural stability is high for the control soil (T) and TSCa (Fig. 2). According to the
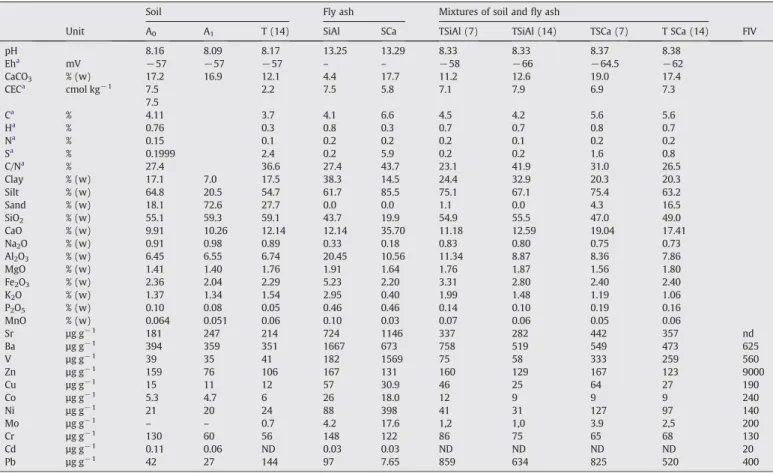
Table 1
Main physical and chemical characteristics of soil and ash used for microcosm experiments (except opposite mention, the used data represent the average of the obtained values for duplicated trials).
Soil Fly ash Mixtures of soil andfly ash
Unit A0 A1 T (14) SiAl SCa TSiAl (7) TSiAl (14) TSCa (7) T SCa (14) FIV
pH 8.16 8.09 8.17 13.25 13.29 8.33 8.33 8.37 8.38 Eha mV −57 −57 −57 – – −58 −66 −64.5 −62 CaCO3 % (w) 17.2 16.9 12.1 4.4 17.7 11.2 12.6 19.0 17.4 CECa cmol kg− 1 7.5 2.2 7.5 5.8 7.1 7.9 6.9 7.3 7.5 Ca % 4.11 3.7 4.1 6.6 4.5 4.2 5.6 5.6 Ha % 0.76 0.3 0.8 0.3 0.7 0.7 0.8 0.7 Na % 0.15 0.1 0.2 0.2 0.2 0.1 0.2 0.2 Sa % 0.1999 2.4 0.2 5.9 0.2 0.2 1.6 0.8 C/Na % 27.4 36.6 27.4 43.7 23.1 41.9 31.0 26.5 Clay % (w) 17.1 7.0 17.5 38.3 14.5 24.4 32.9 20.3 20.3 Silt % (w) 64.8 20.5 54.7 61.7 85.5 75.1 67.1 75.4 63.2 Sand % (w) 18.1 72.6 27.7 0.0 0.0 1.1 0.0 4.3 16.5 SiO2 % (w) 55.1 59.3 59.1 43.7 19.9 54.9 55.5 47.0 49.0 CaO % (w) 9.91 10.26 12.14 12.14 35.70 11.18 12.59 19.04 17.41 Na2O % (w) 0.91 0.98 0.89 0.33 0.18 0.83 0.80 0.75 0.73 Al2O3 % (w) 6.45 6.55 6.74 20.45 10.56 11.34 8.87 8.36 7.86 MgO % (w) 1.41 1.40 1.76 1.91 1.64 1.76 1.87 1.56 1.80 Fe2O3 % (w) 2.36 2.04 2.29 5.23 2.20 3.31 2.80 2.40 2.40 K2O % (w) 1.37 1.34 1.54 2.95 0.40 1.99 1.48 1.19 1.06 P2O5 % (w) 0.10 0.08 0.05 0.46 0.46 0.14 0.10 0.19 0.16 MnO % (w) 0.064 0.051 0.06 0.10 0.03 0.07 0.06 0.05 0.06 Sr µg g− 1 181 247 214 724 1146 337 282 442 357 nd Ba µg g− 1 394 359 351 1667 673 758 519 549 473 625 V µg g− 1 39 35 41 182 1569 75 58 333 259 560 Zn µg g− 1 159 76 106 167 131 160 129 167 123 9000 Cu µg g− 1 15 11 12 57 30.9 46 25 64 27 190 Co µg g− 1 5.3 4.7 6 26 18.0 12 9 9 9 240 Ni µg g− 1 21 20 24 88 398 41 31 127 97 140 Mo µg g− 1 – – 0.7 4.2 17.6 1,2 1,0 3.9 2,5 200 Cr µg g− 1 130 60 56 148 122 86 75 65 68 130 Cd µg g− 1 0.11 0.06 ND 0.03 0.03 ND ND ND ND 20 Pb µg g− 1 42 27 144 97 7.65 859 634 825 520 400 nd: not determined. a
Average value of A0and A1.
Fig. 1. Trace elements contents normalized to control soil (T) in soils after 7 weeks (TSiAl (7), TSCa (7)) and 14 weeks (TSiAl (14), TSCa(14)) incubation.
standardAFNOR (2005), they present“a limited or very weak risk in case of runoff and of diffuse erosion of soil”, in any climatic condition. The soil mixed with SiAl is much less stable in case of stormy or even moderate rain but it will be more stable in regions with a humid winter climate; in that case the risks of runoff and diffuse erosion will be respectively limited or very weak. On average, the structural stability for the three tests will be maximal for the control soil T and minimal for the soil mixed with SiAl (TSiAl).
3.2.2.3. Aggregate water adsorption. The sorption kinetics of water vapour is illustrated inFig. 3for the two sets of relative humidity (32.8% and 92%).
The experimental data (Table 2) show that the adsorption kinetics of water vapour directly depend on the relative humidity (Fig. 3). In fact, the maximal amount of adsorbed water increases when the relative humidity increases. Moreover the sorption behaviour as a function of relative humidity is different between samples: at HR = 32.8% one can observe that the control soil and TSCa show an increase in mass already after 2 days whereas TSiAl shows a sorption effect only after 22 days. The control soil and TSCa show a similar behaviour at 32.8% HR. At HR = 92% all samples show a mass increase after 2 days, but TSiAl and to a greater extent TSCa show a greater ability than control soil to adsorb water. TSCa adsorbs water much faster than TSiAl and T and these differences increase with time. At 92% HR TSiAl shows a behaviour more similar to control soil.
The isothermal adsorption curves (Fig. 3) are of type III according to IUPAC classification (IUPAC, 1994). This type describes adsorption on macro-porous adsorbents with weak adsorbate–adsorbent inter-actions. TSCa, TSiAl and control soil are similarly hydrated at low HR and differentiate around 60% HR where TSCa becomes more hydrated than TSiAl and T. The tendency increases till the experimental maximum HR is reached (97.3%).
According toAranovich and Donohue (1998)type III isotherms have steps for low temperatures such as 25 °C, which can be observed in
our case for the TSCa water sorption isotherm around 65% (Fig. 3). Further experiments should be performed and porosity measures should be done to enable giving an interpretation of this phenomenon. But according to literature studies on clay mineral hydration isotherms, several reasons may lead to such steps; among them, the porosity distribution and particle size distribution in aggregates, the nature of the clay mineral, of the organic matter and of the hydrated cations in the organo-mineral aggregates.
3.3. Soil leaching
The average pH, conductivity and alkalinity values of eluates sampled during 42 days of leaching are given inTable 3. The eluate from the sample TSCa is significantly different from T and TSiAl by high pH, alkalinity and conductivity. The eluate from TSiAl has similar pH but lower alkalinity and higher conductivity than in control soil. The pH decreases with time in TSCa eluate, whereas it increases slightly in TSiAl. Conductivity decreases with time in all eluates.
The soil mixed with SCa ash releases a great amount of cations and anions, particularly Ca2+, SO
4
2−, and NH 4
+and to a lesser extent K+
and Cl−(Table 4). The soil mixed with SiAl releases Ca2+to a lesser
extent, but on the contrary more SO42−, NO3−and Mg2+. The control
soil releases more NO3−and Mg2+than TSCa but less than TSiAl. Most
of the released ions are strongly leached during thefirst 8 days of experiment. No phosphate is detected in all of the eluates.
Trace elements released during the leaching of soils in all samples and at every eluate sampling step are listed inTable 4. The Ni, Mo and Sr concentrations are higher in TSCa than in TSiAl and T eluates. During the first week of leaching TSCa releases most of the elements whereas TSiAl releases Sr, Ba and little Ni, Mo and Cu, and T releases Sr, Ba, Zn and very low amounts of other trace elements. After 28 days, the amounts of elements released are still higher for TSCa than for TSiAl and T but decrease with respect to thefirst 8 days. There is a 10-fold amount of
Fig. 2. Particle size fraction distributions in control soil (T) and soils amended with SiAlfly ash (TSiAl) and SCa fly ash (TSCa) after three treatments for structural stability measures.
released trace elements between TSCa and TSiAl. Moreover the release trend is similar in both cases with an increase in Sr, Co and Ni, and a decrease in Mo in the duration of the leaching experiment.
The statistical Kruskal–Wallis tests performed on T, TSiAl and TSCa eluates show that they all three significantly differ by their contents in major (Mg, Ca, K) and trace elements (Sr, Ba, V, Zn, Cu, Co and Ni). However they are similar in their Fe and Na contents. Concerning Si and Al contents, there is a significant difference between control soil and the mixtures with ash.
3.4. Principal component analysis
Principal component analysis (PCA) was carried out to determine the correlations between the variables and to identify the possible distribution of trace elements within the different mineral phases in order to better explain their release in eluates. PCA using data matrices includes a) major and trace elements, carbonate, C, S and organic matter content (om%), CEC, and particle size distribution in soils for thefirst analysis, and b) chemistry of soils and leachates of soils for the second analysis. The major elements, carbonate, C and organic matter content account for different phases in the soil.
Thefirst analysis (Fig. 4a) showed that two principal components account for 73.89% of the total variance in the data; thefirst factor explaining 49.04% of the total variance, and the second factor 24.84% of the remaining explained variance.
The results showed that it is along thefirst principal component axis that silt, Cu, Sr, P, Pb, and Zn exhibit positive loading and Si, CEC, Na, and sand exhibit negative loading; along the second principal axis, K, clay, Fe, Al, Ba, Co, and Mg showed positive loadings and Ni, C, V, S, Ca, CaCO3
showed negative loadings. Organic matter percentage (om%) and Cr
showed a low loading in the F1–F2 plan and are better represented in the F1–F3 plan: they plot apart from other groups and are well correlated together (R Pearson: 0.74).
This distribution may suggest 4 main groups of elements: 1) the carbonates and sulphates in the silt fraction, 2) the aluminous clay fraction 3) the quartz and feldspars in the sandy fraction and 4) organic matter.
The elements Co, Zn, Cu, Pb and Ba plot within the same quadrant as clay, silt, Fe, Al and Mg and opposite to organic matter and sand. Ni, Sr and V plot within the same quadrant as carbonate and sulphate, and in the opposite quadrant to sand, Si, Na and CEC. Organic matter percentage (om%) and Cr plot in the same quadrant in the F1–F3 plan. The second analysis of soils and eluates (Fig. 4b) showed that two principal components account for 81.23% of the total variance in the data; thefirst factor explaining 52.01% of the total variance, and the second factor 29.23% of the remaining explained variance.
The elements Na, K, Ca, and Sr have high positive loadings along the first axis. The elements P, Ni, Cu and pH have high positive loadings along thefirst axis as well as positive loadings along the second axis. The elements Co and V have positive loadings along F2 in opposition with Mg whereas Zn, Cr, Pb, Si, Al, Fe and Ba have high negative loadings along thefirst axis.
One can distinguish the group along the F1 positive axes which corresponds to the eluates and opposite to the group corresponding to soils (Fig. 4b). Inside the former group, variables Mg, Na, K and Ca are the common elements in T, TSiAl and TSCa eluates. However Ca is distinct from Na and K and strongly correlated to pH, thus characterizing TSCa eluates whereas Mg characterizes T and TSiAl eluates. The trace elements Ni, Co, Cu and Sr plot in the same quadrant as Ca and pH which characterize TSCa eluates. Opposite to that group, Ba, Zn, Pb and Cr are correlated to the Si, Al, Fe phases characterizing T and TSiAl soils. Although positively correlated to Co and Pb, V neither correlates well with SCa eluates, nor with soils and seems distinct from the three main groups. One can notice that no other trace element is strongly correlated to Na, K and Mg, the latter character-izing T and TSiAl eluates.
4. Discussion
Several modifications are observed in soils after integration of ashes and reorganization by worms, but overall the soil mixed with SiAl remains similar in physical properties and leaching behaviour to the control soil whereas soil mixed with SCa shows major differences. The major changes are in the evolution of structural stability. The soil mixed with SiAl shows a weaker stability compared to control soil and TSCa in case of strong leaching. This may be explained by the fact that soil and ash mixtures induced the partial destruction of the initial soil structure and that earthworms formed new casts. This may have induced a decrease in soil aggregate stability as noticed byBinet and Le Bayon (1999) who stated that soil does not always benefit from disturbance by earthworms; newly formed earthworm casts could contribute to soil erosion and losses of nutrients in runoff water. In case of TSCa where the soil water pH is high and earthworm survival is more difficult than in TSiAl, the aggregates may have been less disturbed and therefore remained more stable. Another noticeable difference between TSiAl and TSCa is the water absorption ability of TSCa. Although CEC and clay fraction are higher in TSiAl and characterize it as is shown in the PCA analysis, the soil mixed with SCa adsorbs water more quickly and in higher amounts. Indeed PCA analysis shows that TSCa is mainly characterized by silt but also clay content. Moreover correlations between water uptake at 92.3% humidity and silt content are high (R Pearson: 0.84) which indicates that not only clay but also silt content play a major role in water uptake. The behaviour of TSiAl is close to that of the control soil but adsorbs water more slowly. The water sorption difference between TSiAl and TSCa may also be related to the nature of the adsorbent phases. The major effect may be due to organo-mineral
Table 2
Amount of adsorbed water (gH2O/gdry sample) in function of relative humidity (HR) in
aggregates of control soil and soils amended with Sd (TSiAl) and Sp (TSCa) after 14 weeks of incubation.
Mass of adsorbed water (g H2O/g dry sample)
HR (%) TSiAl TSCa T
6.4 0.00E+00 0.00E+00 0.00E+00 11.3 0.00E+00 0.00E+00 0.00E+00 22.5 0.00E+00 7.37E−04 1.24E−03 43.2 2.73E−03 3.09E−03 2.06E−03 62 6.22E−03 8.22E−03 5.69E−03 75.3 1.12E−02 8.86E−03 1.10E−02 84.2 1.62E−02 2.32E−02 1.49E−02 92 2.26E−02 4.75E−02 1.49E−02 97.3 2.64E−02 4.66E−02 2.46E−02
Table 3
Average pH, conductivity, alkalinity, cation and anion concentrations (mmol/L) in eluates of control soil (T) and soils amended with Sd (TSiAl) and Sp (TSCa) leached during 42 days. T TSCa TSiAl pH 7.76 11.40 8.05 Conductivity 20 °C µS/cm 361 2614 1891 Alkalinity (meq/L) 0.94 12.58 2.18 Cations mmol/L NH4+ 0.01 1.92 0.17 Na+ 0.11 0.16 0.23 K+ 0.17 0.34 0.51 Mg2+ 0.20 0.01 1.59 Ca2+ 1.58 16.65 11.90 ∑ cation charge (meq/L) 3.84 35.73 27.77 Anions mmol/L Cl− 0.14 0.31 0.38 NO3− 2.29 0.53 3.44 SO42− 0.14 9.32 10.52 PO4 0.00 0.00 0.00
∑ cation charge (meq/L) 3.65 32.06 27.04 Neutral species H4SiO4(mmol/L) 0.19 0.16 0.14
aggregates which play an important role in water adsorption. In TSCa aggregate stability is higher than in TSiAl, thus favouring the adsorption. The high C/N ratio in the control soil (27) corresponds to a humus type between mull and moder. The C/N ratio in TSiAl increases after 14 weeks, the contrary is observed in TSCa but in all cases the C/N ratio is high in the mixtures. This denotes a loss of N by leaching, higher in the case of mixtures with SiAl ash, and with less intensity in the case of mixtures with SCa ash.
That leaching effect is probably in relation with the pH of the soil solution. Indeed soil pH is only slightly different between the control soil and mixtures of soil and ash (8–8.5) whereas soil water pH drastically changes between TSiAl (≈8) and TSCa (≈12). This is primarily due to the alkaline minerals contained in the soil and in the ash, such as calcite, dolomite and calcium and magnesium oxides (e.g. lime). This phenomenon has been reported by several authors such as Sheps-Pelleg and Cohen (1999). When ashes interact with water the pH increases due to the dissolution of calcium oxides which is favoured by high surface/volume ratios of thefine grained ash particles.
Cappuyns and Swennen (2008) showed that the soil leaching effect is strongly pH dependent. During their experiments, the As, Cd,
Cu, Fe, Ni, and Zn amounts leached are minimum at weakly acid to alkaline solution conditions (6 to 8) whereas they are maximum at low pH (2); these amounts also increase, but to a lesser extent in high alkaline solutions (pHN10).
These trends are clearly shown in our results and in PCA analysis, where Co, Ni, Cu and V amounts are high in TSCa where pH is high (N10). There is a strong correlation between trace elements, Ca and P amounts in eluates and pH increase. On the contrary, in control soil and TSiAl eluates where pH is low, there is no strong correlation between trace elements and the major elements K, Na, or Mg which characterize these waters. On the other hand Cr, Pb and Zn are strongly and positively correlated with Al, Fe and Si characterizing soils where pH is close to 8. In our experiments, an increase in soil water pH causes a higher mobility of Co, Ni, V, Mo and Sr. However concentrations still remain below regulatory leaching limits for waste except for the TSCa eluates. The elements Cu, Cr, Pb and Zn are less mobile and more strongly retained by soil.
Concerning anions,Cappuyns and Swennen (2008)recorded an increase as a function of pH, in dissolved organic matter, PO43−, and SO42−,
but Cl−is hardly influenced by pH, what was also observed in our
Table 4
ICP-AES trace element concentrations in µg/L in irrigation water (water 1 and 2) and eluates after 1, 2, 3 and 4 weeks of leaching of control soil (T) and soils amended with Sd (TSiAl) and Sp (TSCa). Time (day) Sr Ba V Zn Cu Co As Ni Mo Cr Cd Pb water 1 0.2a 0.2a bLD 1.5a 0.52a 0.008 ND bLD 0.7 0.18 bLD ND water 2 0.2a 0.1a bLD 1.1a 0.26a 0.004 ND bLD bLD 0.15 bLD ND 8 T 361 225 0.8a 78 5.51a 0.348 ND 6.1a 2.3 0.79 2.24 ND TSCa 3544 456 80 9.9a 6.87 13.4 ND 900 291 16.1 1.25 ND TSiAl 1755 428 8.1a 4.8a 42.1 1.84 ND 23.7a 45.7 6.94 0.49 ND 14 T 258 182 1a 107 6.29a 0.285 ND 5.2a 2.9 0.83 1.09 ND TSCa 3315 391 123 3a 9.7 19.2 ND 890 290 11.6 1.32 ND TSiAl 1834 482 15.6a 6.2a 27a 3.29 ND 26.1a 61.7 8.11 0.38 ND 21 T 197 192 1.3a 44 6.99a 0.219 ND 4.3a 3.3 0.85 0.29 ND TSCa 4405 446 195 4.2a 10.6 28.2 ND 1140 425 13.1 1.53 ND TSiAl 1032 274 7a 14a 9a 1.35 ND 13a 27.0 bLD 0.20 ND 28 T 130 184 1.4a 19.3a 6.44a 0.146 ND 3.7a 2.4 0.70 0.22 ND TSCa 3965 383 261 7a 13.1 20.2 ND 700 264 11.0 1.08 ND TSiAl 1772 460 11a 30.5a 10.92a 1.84 ND 20.1a 37.1 10.2 0.38 ND DL: detection limit.
aValues obtained by ICP-MS.
Fig. 4. Projections of the different variables on the factorial plans F1× F2a) chemistry, particle size, carbonate and organic matter content of soils and b) major and trace element
experiments. The carbonate content decreases slightly (−2%) after 14 weeks in TSCa and increases in TSiAl (+2%). Although soil water pH conditions in TSCa and TSiAl are in favour of CaCO3conservation, the
amount of Ca2+ in leachates is high. A large amount of Ca has been
released in eluate during thefirst 8 days of leaching and much lower amounts are recorded with time. Our experiments show a process similar to whatCappuyns and Swennen (2008)have described.
5. Conclusion
In conclusion this work was dedicated to studying in microcosms the physical, chemical and physico-chemical modifications in a fluvisol (calcaric) after integration of a silico-aluminous and a sulfo-calcicfly ash. The different results obtained during an experiment period of 14 weeks in microcosms show that SCa ash seems less well adapted to the integration in soils, mainly because of the basicity of the soil solution which it induces. The SiAl ash seems better adapted for amendment from an agricultural and farming point of view as it allows an improvement in CEC, thus furthering the reserve of nutrients and the adsorption of water as a useful reserve for plants. However it lowers the structural stability of the soil.
Finally, it seems important to remind that these studies were made in the conditions of a calcium carbonate rich soil and that the observed reactions are specific to these basic environments and probably very different from those arising in acid soils.
Acknowledgments
The authors thank Surschiste enterprise for the supply infly ash, and the LHYGES technical staff of XRD, water and geochemical laboratories for the analyses.
References
Aitken, R.L., Campbell, D.J., Bell, L.C., 1984. Properties of Australianfly ash relevant to their agronomic utilization. Aust. J. Soil Res. 22, 443–453.
AFNOR, 2005. Mesure de stabilité d'agrégats de sols pour l'évaluation de la sensibilité à la battance et à l'érosion hydrique. NF X 31-515, 10 pp.
Aranovich, G., Donohue, M.D., 1998. Analysis of adsorption isotherms: Lattice Theory predictions, classification of isotherms for gas–solid equilibria, and similarities in gas and liquid adsorption behavior. J. Colloid Interface Sc. 200, 273–290. Bertocchi, A.F., Ghiani, M., Peretti, R., Zucca, A., 2006. Red mud andfly ash for
remediation of mine sites contaminated with As, Cd, Cu, Pb and Zn. J. Hazard. Mater B134, 112–119.
Binet, F., Le Bayon, R.C., 1999. Space-time dynamics in situ of earthworm casts under temperate cultivated soils. Soil Biol. Biochem. 31, 85–93.
BRGM, 2003. The French approach to contaminated-land management— revision 1. Publication BRGM, BRGM/RP-52276-FR, 148 pp.
Cappuyns, V., Swennen, R., 2008. The application of pHstat leaching tests to assess the pH-dependent release of trace metals from soils, sediments and waste materials. J. Hazard. Mater. 158, 185–195.
Chang, A.C., Lund, L.J., Page, A.L., Warneke, J.E., 1977. Physical properties offly ash amended soils. J. Environ. Qual. 6 (3), 267–270.
Christensen, B.T., 1992. Physical fractionation of soil and organic matter in primary particle size and density separates. Adv. Soil Sci. 20, 1–90.
Desmukh, A., Matti, D.B., Bharti, B., 2000. Soil properties as influenced by fly ash application. J. Soils Crop. 10, 69–71.
Douay, F., Dubouguier, H.C., Pruvot, C., Warin, A., 2002. Evaluation de l'intérêt des cendres LFC pour le phytomanagement des sites contaminés par les métaux lourds. Rapport intermédiaire. Lille, Laboratoire Sols Environnement de l'ISA. 50 pp. Elsass, P., Bouzonville, A., Elsass, F., Fourniguet, G., Gorsy, P., Liewig, N., Morvan, G., Perdrial, N.,
2006. Etude de synthèse de l'état des sols sur le territoire de la communauté urbaine de Strasbourg. Rapportfinal. BRGM/RP-54829-FR. 50 pp.
El-Mogazi, D., Lisk, D.J., Weinstein, L.H.A., 2001. A review of physical, chemical and biological properties offly ash and effects on agricultural ecosystem. Sci. Total Environ. 74, 1–37.
Grewal, K.S., Yadav, P.S., Mehta, S.C., Oswal, M.C., 2001. Direct and residual effect offly ash application to soil on crop yield and soil properties. Crop Res. 21, 60–65. Grumiaux, F., Demuynck, S., Schikorski, D., Lemière, S., Vandenbulcke, F., Leprêtre, A., 2007.
Effect offluidized bed combustion ashes used in metal polluted soil remediation on life history traits of the oligochaeta Eisenia Andrei. Eur. J. Soil Bio. 43, 256–260. INERIS, 2001. Méthode de calcul des valeurs de constat d'impact dans les sols, INERIS
DRC-01-2587/DESP-R01.
IUPAC, 1994. Recommendations. Pure Appl. Chem. 66, 1739.
IUSS Working Group WRB, 2007. World reference base for soil resources 2006,first update 2007. World Soil Resources Reports no. 103. FAO, Rome.
Jankowski, J., Ward, C.R., French, D., Groves, S., 2006. Mobility of trace elements from selected Australianfly ashes and its potential impact on aquatic ecosystems. Fuel 85 (6), 243–256.
Jongmans, A.G., Pulleman, M.M., Balabane, M., van Oort, F., Marinissen, J.C.Y., 2003. Soil structure and characteristics of organic matter in two orchards differing in earthworm activity. Appl. Soil Ecol. 24, 219–232.
Kalra, N., Jain, M.C., Joshi, H.C., Chaudhary, R., Pathak, H., Sharma, S.K., Kumar, V., Kumar, R., Harit, R.C., Khan, S.A., Hussain, M.Z., 2003. Soil properties and crop productivities as influenced by fly ash incorporation in soil. Environ. Monit. Assess. 87, 93–109. Lahd Geagea, M., 2007. Caractérisation chimique et isotopique des aérosols organiques/
inorganiques et détermination de l'impact de la pollution atmosphérique sur l'environnement en milieu urbain. Thèse Université ULP Strasbourg, 185 pp. Lecuyer, I., Gueraud, S., Bursi, J.M., 2001. Different uses of CFB ash— EDF investigations.
EDF R&D, France. 42nd International Energy Agency— Fluidized Bed Conversion (IEA-FBC), May 10–11, 2001, Sidney, Nova Scotia, Canada.
Majumdar, K., Singh, N., 2007. Effect of soil amendments on sorption and mobility of metribuzinin soils. Chemosphere 66, 630–637.
Marinissen, J.C.Y., Didden, W.A.M., 1997. Influence of the enchytraeid worm Buchholzia appendiculata on aggregate formation and organic matter decomposition. Soil Biol. Biochem. 29 (3/4), 387–390.
MEDD, 1998. Ministère de l'Environnement et du Développement Durable. Arrêté du 8 janvier 1998fixant les prescriptions techniques applicables aux épandages de boues sur les sols agricoles pris en application du décret n° 97-1133 du 8 décembre 1997 relatif à l'épandage des boues issues du traitement des eaux usées. JO 31 janvier 1998, NOR: ATEE9760538A
MEDD, 2002. Ministère de l’Environnement et du Développement Durable, Décret no 2002-540 du 18 avril 2002 relatif à la classification des déchets. JO 20 avril 2002, NOR : ATEP0190045D
Montes-Hernandez, G., Duplay, J., Martinez, L., Géraud, Y., Rousset-Tournier, B., 2003. Influence of interlayer cations on the water sorption and swelling-shrinkage of MX80 bentonite. Appl. Clay Sci. 23 (5–6), 309–321.
Organisation Internationale de Métrologie Légale, 1996. Échelle d'humidité relative de l'air certifiée par rapport à des solutions saturées de sels, 10 pp.
Perdrial, N., Elsass, F., Liewig, N., 2008. New technique for in-situ sampling of particulate matter and colloids in soil and atmospheric fallout. Colloids Surf., A Physicochem. Eng. Asp. 317, 742–746.
Phung, H.T., Lam, H.V., Lund, L.J., Page, A.L., 1979. The practice of leaching Boron and salts fromfly ash amended soils. Water Air Soil Pollut. 12, 247–254.
Puget, P., 1997. Distribution des matières organiques dans des agrégats de sols limoneux cultivés. Conséquences sur la stabilité structurale des agrégats et sur la biodégradation des matières organiques. Thèse Université Paris XII-Val de Marne, 164 pp. Rakotoarisoa, Z. 2003. Prédiction du comportement environnemental des résidus de
procédés thermiques (RPT) utilisés comme matériaux de travaux plublics. Thèse INS Lyon, 254 pp.
Riehl, A., 2008. Réactivité d'un sol en zone urbaine industrialisée après incorporation d'un polluant et de cendres de remédiation Rapport stage M2, Université ULP, Strasbourg, 30 pp.
Rousseau, M., 2003. Transport préférentiel de particules dans un sol non saturé: de l'expérimentation en colonne lysimétrique à l'élaboration d'un modèle à base physique. Thèse INP Grenoble, 216 pp.
Roy, W.R., Thierry, R.G., Schuller, R.M., 1981. Coalfly ash: a review of the literature and proposed classification system with emphasis on environmental impacts. Environ. Geol. Notes 96, 1–69.
Saint-Ame, A., 1998. Surschiste et la valorisation des cendres de charbon. Mines et Carr. 80, 18–21.
Shaobin Wang, T., Terdkiatburana, M.O., 2008. Single and co-adsorption of heavy metals and humic acid onfly ash. J. Separation Purif. Technol. 58, 353–358. Sheps-Pelleg, S., Cohen, H., 1999. Evaluation of the leaching potential of trace elements
from coal ash to the (goundwater) aquifer. International Ash Utilization Symposium on Materials for the Next Millennium Lexington, KY, U.S., Center for Applied Research. University of Kentucky.
Siegel, S., Castellan, N.J., 1988. In: Siegel, S., Castellan, N.J. (Eds.), Non Parametric Statistics for the Behavioral Sciences. McGraw-Hill, New York.
Sikka, R., Kansal, B.D., 1994. Characterization of thermal power plantfly ash for agronomic purposes and to identify pollution hazards. Bioresour. Technol. 50, 269–273. Tessier, D., Bigorre, F., Bruand, A., 1999. La capacité d'échange: outil de prévision des