HAL Id: hal-00298198
https://hal.archives-ouvertes.fr/hal-00298198
Submitted on 28 Sep 2007HAL is a multi-disciplinary open access
archive for the deposit and dissemination of sci-entific research documents, whether they are pub-lished or not. The documents may come from teaching and research institutions in France or abroad, or from public or private research centers.
L’archive ouverte pluridisciplinaire HAL, est destinée au dépôt et à la diffusion de documents scientifiques de niveau recherche, publiés ou non, émanant des établissements d’enseignement et de recherche français ou étrangers, des laboratoires publics ou privés.
Precipitation variations of Longxi, northeast margin of
Tibetan plateau since AD 960 and its relationship with
solar activity
L. Tan, Y. Cai, L. Yi, Z. An, L. Ai
To cite this version:
L. Tan, Y. Cai, L. Yi, Z. An, L. Ai. Precipitation variations of Longxi, northeast margin of Ti-betan plateau since AD 960 and its relationship with solar activity. Climate of the Past Discussions, European Geosciences Union (EGU), 2007, 3 (5), pp.1037-1061. �hal-00298198�
CPD
3, 1037–1061, 2007 Precipitation variations of Longxi related to solar activity L. Tan et al. Title Page Abstract Introduction Conclusions References Tables Figures ◭ ◮ ◭ ◮ Back Close Full Screen / EscPrinter-friendly Version Interactive Discussion
Clim. Past Discuss., 3, 1037–1061, 2007 www.clim-past-discuss.net/3/1037/2007/ © Author(s) 2007. This work is licensed under a Creative Commons License.
Climate of the Past Discussions
Climate of the Past Discussions is the access reviewed discussion forum of Climate of the Past
Precipitation variations of Longxi,
northeast margin of Tibetan plateau since
AD 960 and its relationship with solar
activity
L. Tan1,3, Y. Cai1, L. Yi2,3, Z. An1, and L. Ai1,3
1
State Key Laboratory of Loess and Quaternary Geology, Institute of Earth Environment, Chinese Academy of sciences, Xi’an, 710075, China
2
Yantai Institute of Coastal Zone Research for Sustainable Development, Chinese Academy of Sciences, Yantai, 264003, China
3
Graduate School of Chinese Academy of Sciences, Beijing, 100039, China Received: 14 September 2007 – Accepted: 17 September 2007
– Published: 28 September 2007
Correspondence to: L. Tan ([email protected])
CPD
3, 1037–1061, 2007 Precipitation variations of Longxi related to solar activity L. Tan et al. Title Page Abstract Introduction Conclusions References Tables Figures ◭ ◮ ◭ ◮ Back Close Full Screen / EscPrinter-friendly Version Interactive Discussion
Abstract
The precipitation variations of Longxi area, northeast margin of Tibetan plateau since AD 960 are reconstructed from Chinese historical documentary records. It shows that since AD 960, the precipitation of Longxi fluctuantly decreased to the lowest in the end stage of 17th century and 18th century. After this period, the precipitation gradually
5
increased. Three short wet periods of Longxi in the last millennium were: from the end of 10th century to the early of 11th century, from the end of 12th century to the early of 13th century and the first half of 20th century. The precipitation variations of Longxi coincide well with variations of the Northern Hemisphere temperature and the atmospheric14C concentration, the modeled solar output, the reconstructed total solar
10
irradiance, which shows that solar activity may be the main driving force of precipita-tion variaprecipita-tions of Longxi on multi-decadal to centennial scales in the last millennium. Synchronous variations of Longxi precipitation and Northern Hemisphere temperature may be ascribed to the same control of solar activity. Solar activity controls remotion of the north edge of Asian summer monsoon by affecting Asia summer monsoon
inten-15
sity, East Asian winter monsoon intensity and the locations of westerlies, thus further dominates precipitation variations of Longxi.
1 Introduction
Longxi area, lies in northeast Tibetan plateau margin, is within the transition zone to the Loess plateau. The climate falls into semi-arid temperature zone. Meteorological
20
records show that annual rainfall varied greatly. For example, during AD 1937–2003, the lowest annual rainfall in Lanzhou was 189 mm in year 1980 and the highest was 547 mm in year 1978, In Longxi county, the lowest annual rainfall was 362 mm in year 1997 and the highest annual rainfall came to 818 mm in year 1967. According to his-torical and geographical features, we define this area as today’s Lanzhou area, Dingxi
25
area and the close-by Wushan County, Huining County, Gangu County, Qin’an County, 1038
CPD
3, 1037–1061, 2007 Precipitation variations of Longxi related to solar activity L. Tan et al. Title Page Abstract Introduction Conclusions References Tables Figures ◭ ◮ ◭ ◮ Back Close Full Screen / EscPrinter-friendly Version Interactive Discussion
as shown in Fig. 1.
Longxi area is an important origin of upstream Yellow River civilization and cradled the famous Majiayao culture, the Qijia culture, the Xindian culture and the Siwa cul-ture in the Neolithic Age (An et al., 2003). Climate research of this area is critical to a good understanding of the relationship between human society development and
5
environmental changes. Because of the lack of geological and biological materials, high resolution climate records in this area during the past 2000 years or 1000 years are still not publicly seen. However, China has abundant historical documents which contain much information of climate changes. This paper reconstructed the precipi-tation variations of Longxi area since AD 960 based on related historical records, the
10
relationship between precipitation variations of Longxi and solar activity in the last mil-lennium are also discussed. It shows solar activity maybe the main force that drives the synchronous variations of precipitation in northeast margin of Tibetan plateau and the Northern Hemisphere temperature on multi-decadal to centennial scales in the last millennium.
15
2 Historical documents: sources and description
2.1 Sources
The historical climate records before Ming and Qing Dynasty mainly come from Chroni-cles of emperors called Benji and chapter Wuxingzhi (Five Elements Chapter) of official chronicle of each dynasty. The origins of historical climate records in Ming and Qing
20
Dynasty are abundant, including official chronicle of Ming and Qing Dynasty (Ming Shi and Qing Shi), Donghua Lu (Records of Donghua), Donghua Xu Lu (Extended Records of Donghua), Luzheng Xu Gao (Extended draft of Luzheng), and each local chronicle called Zhi. The historical climate documents in the early period of Republic of China mainly come from government report of Gansu province and Rescue History of China
25
(Deng, 1937) and local chronicle of each county. There are meteorological records in 1039
CPD
3, 1037–1061, 2007 Precipitation variations of Longxi related to solar activity L. Tan et al. Title Page Abstract Introduction Conclusions References Tables Figures ◭ ◮ ◭ ◮ Back Close Full Screen / EscPrinter-friendly Version Interactive Discussion
the latter period of Republic of China. Some documents used in this paper are also from Gansu Xin Tong Zhi (Newly Whole Records of Gansu) which was compiled in Emperor Guangxu period (AD 1875–1908) of Qing Dynasty, Draft of Whole Records of Gansu(Liu, 1936) and Abstract History of Gan Qing Ning Area (Mu, 1936) as well as Catalogue of Disasters in China (Chen,1939), Brief Nature Disaster Records in each
5
period of Gansu province (Zhao,1984) and Collection of weather records in China in the last 3000 years (Zhang, 2004). Target counties of Longxi area are selected as modern Dingxi city, Lanzhou city and their administrated counties, and Wushan county, Huining county, Gangu county, Qin’an county. We also refer to historical climate records from neighborhood such as Pingliang, Tianshui, Longnan, Linxia, Gannan.
10
2.2 Description
Longxi area belonged to central Han’s power after Northern Song Emperor Shenzong (AD 1068–1085), after Northern Song (AD 960–1127) deceased, Jin (AD 1115–1234) captured Longxi in AD 1131, In AD 1234, Mongolians conquered Jin, following year e.g. AD 1235., General Wang Shixian of Jin surrendered to Mongolians, Longxi area
15
since after was part of Mongolia & Yuan (AD 1206–1368). In Ming (AD 1368–1644) and Qing (AD 1644–1911) time, Longxi area was inland of China.
The historical documentary records show that the first half of Northern Song (AD 960–1127) was wet, and it was gradually dry during the latter half of Northern Song time. We put all the drought/flood years of Longxi during this time in Table 1. From
20
Table 1, we can see that in Northern Song, floods mostly occurred in 90’s of the 10th century and the first two decades of 11th century, while droughts mostly occurred in 70–80’s of 11th century. We found during this period, there was a serious drought in AD 1078–1082 that lasted 4–5 years and affected most of northwest China. Droughts at Jin (AD 1115–1234) time mainly focused on the latter half of the 12th century, there
25
was a short wet period in the early 13th century. After this, climate turned drier in entire Mongolia & Yuan (AD 1206–1368) time.
Ming (AD 1368–1644) and Qing time (AD 1644–1911) of China is roughly correspond 1040
CPD
3, 1037–1061, 2007 Precipitation variations of Longxi related to solar activity L. Tan et al. Title Page Abstract Introduction Conclusions References Tables Figures ◭ ◮ ◭ ◮ Back Close Full Screen / EscPrinter-friendly Version Interactive Discussion
to “Little Ice Age” of Europe (Lamb, 1965; Bradley& Jones, 1992). Because of a stable society and closer in time, there are abundant historical materials and therefore more detailed records on climate. In general, dry climate went through the entire Ming and Qing time.
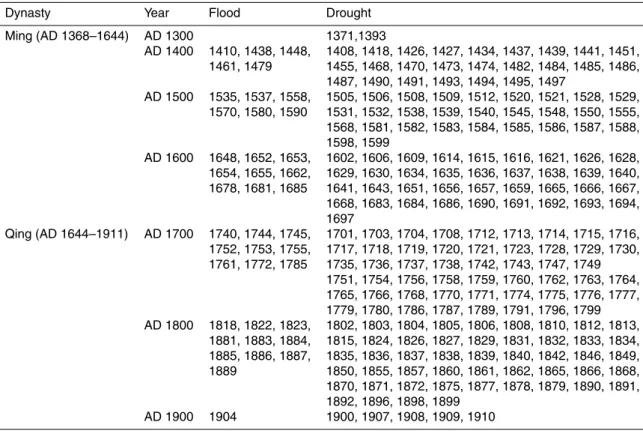
At Ming Dynasty, Longxi was extremely dry, there were two severe droughts: one
5
began from 1480’s to 1530’s, lasted for half a century, no wet climate was recorded; the other drought lasted even longer, from 1580’s till the end of Ming (AD 1644), about 65 years (Table 2). These two droughts were large in time scale and degree of dryness (records of “man eat man” can be found everywhere), gave society heavy strokes, the later one was possibly an important cause for the fall of Ming Dynasty.
10
It was still dry in Qing time, Table 2 shows that only at 1650’s, 1750’and 1880’s condition changed. There were also two severe droughts in Qing time, one began from 1680’s to 1740’s, lasted about 60 years; the other one began from 1820’s to 1870’s, lasted more than 50 years. The former drought did not bring much harm to the society as it occurred during the famous “Kangxi and Qianlong’s Prosperity”, and historical
15
documents also show appropriate countermeasures (hand out money, call off taxes). The latter one was different. The strength of the nation decreased after “Kangxi and Qianlong’s Prosperity”, plus the impacts of wars (two opium wars: AD 1840–1842; AD 1856–1860, Taiping Tianguo movement (AD 1851–1864) and other rebellions of farmers ( Nian Army, Muslim rebellion in Shaanxi & Gansu) etc. ), countermeasures
20
were weak, many places were “ bodies died from hunger fill the street”, “man eat man”, “ exchanged children and eat”.
At Republic of China (AD 1912–1949), instrumental records began to be available.
3 Parameterization of historical climate records
Historical climate records have accurate dates and clear climatic information, but they
25
are usually qualitative descriptions. For comparing the climate records with other ar-eas’, they need to be parameterized. Since the 1970s, Chinese climatologists have
CPD
3, 1037–1061, 2007 Precipitation variations of Longxi related to solar activity L. Tan et al. Title Page Abstract Introduction Conclusions References Tables Figures ◭ ◮ ◭ ◮ Back Close Full Screen / EscPrinter-friendly Version Interactive Discussion
cooperated to extract climatic information from more than 2000 kinds of historical doc-uments for the last 500 years beginning in AD 1470, they used the method of 5-level classification to estimate series of yearly drought/flood (D/F) level in the main rainy season at 120 sites covering the entire country and gained great success (Central Meteorological Bureau, 1981).
5
As the climate reconstruction in this paper started from AD 960 with the lack of historical climate records in early time, we firstly classify the historical records in 5 levels year by year as D/F index using traditional classification method. The classification is mainly according to the occurred time, affected area and the degree of drought and flood in spring, summer or autumn (Zhang, 1983), detailed standards are as follows:
10
Wet, heavy rain last for a long time or occur in a large area; Mildly wet, sustaining rain in spring or autumn do not make disaster or heavy rain in just local area; Fitting climate, Big harvest year or raining (dry) in spring and dry (raining) in autumn; Mildly dry, drought just in one month, within season do not make disaster or drought just in local area; Dry, big drought last for several months, span two seasons or occur in
15
a large area (Zhang, 1983). Considering our research region is located in semi-arid zone, we make small changes to the standards. When there were records like “Big harvest year”, we consider mildly wet in those year than the normal year. As Longxi area is in northwest China, and the historical documents are less than east and center part of China, sometimes we also refer to historical climate records from neighborhood.
20
In this case, the D/F level will be assigned to the lower grade.
Then we introduce Yan’s method to define averaged D/F level (see Yan et al., 1991, 1993 for details). Considering the semi-arid zone, the times and details of drought records were far more than that of flood records in Longxi, we make some revision to this method and define averaged D/F index as follows:
25 Gi = 1, a ≥ 0.7 0, 0.4 ≤ a ≤ 0.6 −1, a ≤ 0.3
In which a=Ni/N, Ni is the times of great drought in the ith unit interval, N is the sum of 1042
CPD
3, 1037–1061, 2007 Precipitation variations of Longxi related to solar activity L. Tan et al. Title Page Abstract Introduction Conclusions References Tables Figures ◭ ◮ ◭ ◮ Back Close Full Screen / EscPrinter-friendly Version Interactive Discussion
times of great drought and great flood in the same interval. Moreover, we set up two subsidiary levels, Gi=0.5 (0.6<a<0.7) and Gi=−0.5 (0.3<a<0.4). These two levels are used to describe the averaged D/F status when both drought and flood occur but great droughts (great floods) were a little more than great floods (great droughts).
Considering our target region is located in semi-arid zone and the historical
doc-5
ument recorded places are concentrated in a small area, when there were no great drought and great flood records, thus N=0, Gi mainly rest with minor drought and mi-nor flood records. We also set Gi=1(−1) when there were all mimi-nor drought (mimi-nor flood) records but no great drought (great flood) records and the number of times of minor drought (minor flood) records was more than 1/2 of the years of the interval. If
10
the number was less than 1/2 of the years during the interval, we set Gi=0.5 (−0.5). If there were both minor drought records and minor flood records, when minor drought records were more than minor flood records, we define Gi=0.5, otherwise Gi=−0.5. By this way, the great disaster and the minor disaster are both considered. In this paper, we set the interval as 10 years.
15
The meteorological precipitation records here started from 1937, in order to link it to the precipitation series reconstructed by historical documents, we firstly graded the yearly meteorological precipitation records with 5-level-method (see Central Meteoro-logical Bureau, 1981 and Zhang, 1983 for details), then calculate the averaged D/F level of every 10 years. When there were both meteorological precipitation records
20
and historical climate records, we mainly use the meteorological records (Gong et al., 1983). The result of parameterization is show in Fig. 2.
4 Reliability test
4.1 Origin of historical climate documents
The historical documents used in this paper mainly come from two sources: dynasties’
25
histories compiled by office and local chronicles written by office entrusted bookmen. 1043
CPD
3, 1037–1061, 2007 Precipitation variations of Longxi related to solar activity L. Tan et al. Title Page Abstract Introduction Conclusions References Tables Figures ◭ ◮ ◭ ◮ Back Close Full Screen / EscPrinter-friendly Version Interactive Discussion
We believe even if the official histories may contain some falsity for political reasons, the records on climate are reliable. As china is an agricultural country, agriculture was regarded as one of the most important thing in each dynasty and much attention was paid to climate disaster, especially when the country was stable and flourishing. To preventing possible mendacious reports of natural disasters, some dynasties such
5
as Qing Dynasty even set several different systems at the same time and crosscheck climate reports (Gong et al., 1983).
The climate records coming from local chronicles are also reliable, because they were mainly from local archives (Zhang, 1983). Meanwhile, many of the local chroni-cles cited in this paper were written in early time, such as Qingyangfu Zhi was written
10
in emperor JiaJing period (AD 1522–1566) of Ming Dynasty, Lintaofu Zhi was writ-ten in emperor Wanli period (AD 1573–1619) of Ming Dynasty, Andingxian Zhi and Gongchang fu Zhi were written in emperor Kangxi period (AD 1662–1722) of Qing Dy-nasty, these books should actually record the important climate changes in the area. Furthermore, some great disasters appeared in different historical documents.
15
Thus, the historical climate records used in this paper are reliable. 4.2 Historical climate referred sites
Most parts of China are affected by Asian monsoon and the precipitation mainly con-centrated on May–October (Zhang, 1991), therefore we use the correlation of an-nual precipitation in May–October of Lanzhou, Longxi, Zhangxian, Lintao, Tianshui,
20
Pingliang and Longnan from 1945 to 2004 (precipitation record in Zhangxian is from 1967 to 2004) to test the rationality of historical climate referred sites. We set the an-nual precipitation in May–October from 1945 to 2004 in Longxi county as standard, correlation analysis show that precipitation in May–October of the other six sites are significantly correlated with those of Longxi county at 0.01 level. All of this show that
25
the selection of historical climate referred cites is reasonable.
CPD
3, 1037–1061, 2007 Precipitation variations of Longxi related to solar activity L. Tan et al. Title Page Abstract Introduction Conclusions References Tables Figures ◭ ◮ ◭ ◮ Back Close Full Screen / EscPrinter-friendly Version Interactive Discussion
4.3 Result of parameterization
The traditional 5-level classification method is mature in historical climate research and has gained a lot of successes (Central Meteorological Bureau, 1981; Zhang, 1983; Zhang et al., 1997), here we test the method of 10-year averaged D/F level. We unite the yearly D/F level records of resent 500 years in Lanzhou (Central Meteorological
5
Bureau, 1981) using the method of average D/F level to get 10-year averaged D/F series (the black line in Fig. 3). From the comparison in Fig. 3, we can see that the averaged D/F method can actually reflect the primary D/F series (Fig. 3).
Meanwhile, from the comparison of reconstructed average D/F series of Longxi and Lanzhou (Central Meteorological Bureau, 1981), we find they are well correlated with
10
each other in recent 500 years (Fig. 4).
5 Discussion
5.1 Comparisons among precipitation variations of Longxi since AD 960 and other records
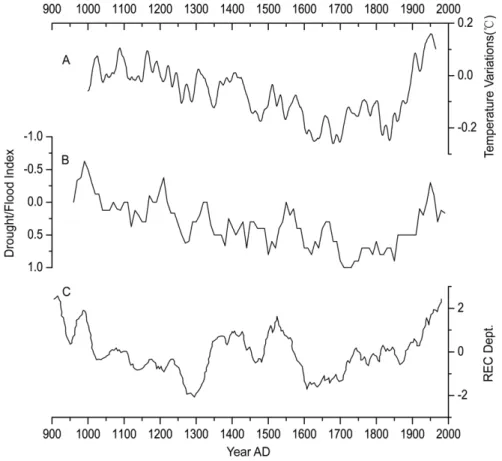
Comparing the precipitation variations of Longxi since AD 960 with the precipitation
15
variations of Dulan area, northeastern of Tibetan plateau reconstructed by tree-ring (Liu et al., 2006) (Fig. 5), we find the low frequency variation of these two series are well correlated. These indicate that the precipitation in the northeast margin and the northeastern of Tibetan plateau varied synchronously on multi-decadal to centennial scales and the precipitation variations of these two areas are probably controlled by
20
the same factor. At the same time, we compare the precipitation of Longxi area with the North Hemisphere temperature in the last millennium (Crowley, 2000), and find both the trend and the main peaks are well corresponded in two series, high precipitation of Longxi corresponding to high temperature of North Hemisphere, and vise versa (Fig. 5). These suggest that the precipitation variations of the northeast margin of the Tibetan
25
CPD
3, 1037–1061, 2007 Precipitation variations of Longxi related to solar activity L. Tan et al. Title Page Abstract Introduction Conclusions References Tables Figures ◭ ◮ ◭ ◮ Back Close Full Screen / EscPrinter-friendly Version Interactive Discussion
plateau has close relationship with temperature variations of North Hemisphere on multi-decadal to centennial scales, similar results also showed in the research of Dulan tree-rings (Liu et al., 2006).
5.2 Main driving force of precipitation variations of Longxi in the last millennium Longxi area is located in the east part of northwest China and in the north edge of
5
Asian summer monsoon (Qian, 2004). The precipitation there is affected by Indian summer monsoon, East Asia summer monsoon, East Asia winter monsoon and west-erlies. Tang (Tang, 2006) has studied the north edge of Asian summer monsoon in northwest China by meteorological data from 1951 to 2000, he found the precipitations of east part of northwest China, the location of north edge of Asian summer monsoon
10
were positive correlated with Indian summer monsoon index and East Asian summer monsoon index. When Indian summer monsoon and East Asian summer monsoon are stronger, the north edge lies more northward and the precipitation of east part of north-west China also increases. On the contrast, when the Indian summer monsoon and East Asian summer monsoon are weaker, the north edge of Asian summer monsoon
15
lies more southward and the precipitation of east part of northwest China decreases. There are many high resolution records both in ocean and continent show that so-lar activity drives the Holocene Asian summer monsoon variations on multi-decadal to centennial scales (von Rad et al., 1999; Wang and Sarnthein, 1999; Hong et al., 2001; Neff et al., 2001; Fleitmann et al., 2003; Dykoski et al., 2005; Wang et al., 2005;
20
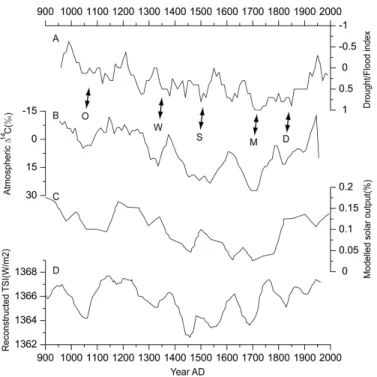
Dong et al., 2006). We compare precipitation variations of Longxi with solar activity reflected by atmospheric 14C concentration (Stuiver and Braziunas, 1989; Stuiver et al.,1991,1998), the modeled solar output (Perry, 1994), the reconstructed total solar irradiance (TSI) (Bard et al., 2000), we find there is good correlation between precip-itation and solar activity on multi-decadal to centennial scales in the last millennium
25
(Fig. 6). It is showed in Fig. 6 that there are five minima of solar activity known as Oort (AD 1010–1050), Wolf (AD 1280–1340), Spoerer (AD 1420–1530), Maunder (AD 1645–1715) and Dalton (AD 1795–1820) during the last millennium, each period of
CPD
3, 1037–1061, 2007 Precipitation variations of Longxi related to solar activity L. Tan et al. Title Page Abstract Introduction Conclusions References Tables Figures ◭ ◮ ◭ ◮ Back Close Full Screen / EscPrinter-friendly Version Interactive Discussion
solar activity minimum corresponded to dry period of Longxi and strong solar activity period corresponded to wet period of Longxi area. The good corresponding shows that the precipitation variation of Longxi, northeast margin of Tibetan plateau on multi-decadal to centennial scales in the last millennium maybe controlled by solar activity. 5.3 Precipitation of Longxi, Northern Hemisphere temperature and solar activity
5
A lot of studies show that, solar activity is the main force that drives the regional climate changes in the Holocene (Kilian et al., 1995; Stuiver et al., 1997; van Geel et al., 1999; Yu and Ito, 1999; Crowley, 2000; Hong et al., 2000; Perry and Hsu, 2000; Bond et al., 2001; Hodell et al., 2001; Neff et al., 2001; Speranza et al., 2002; Fleitmann et al., 2003; Frisia et al., 2003; Hu et al., 2003; Kilcik, 2005; Ogurtsov et al., 2005; Wang
10
et al., 2005; Xu et al.,2006; Barron and Bukry, 2007; Haltia-Hovi et al., 2007; Rodolfo Rigozo et al., 2007). The synchronous variations of precipitation of Longxi and North Hemisphere temperature on multi-decadal to centennial scales may be ascribed to the same control of solar activity. Solar activity can not only change the total solar irradi-ance on the earth that directly affect the earth surface temperature, but the variability
15
can be also remarkably amplified by changes of ultraviolet radiation and clouds(Ney, 1959; Pudovkin and Raspopov, 1992; Haigh, 1999; Shindell et al., 1999; van Geel et al., 1999; Tinsley, 2000). Therefore small solar variability may lead to remarkable earth surface temperature variations. The mechanism for solar activity driving precipitation of Longxi may probably be: since oceanic and terrestrial heat capacity are different,
20
when the solar activity strengthens, temperature on land increases quickly, the exis-tence of Tibetan plateau further magnifies such differences between Asian continent and its surrounding ocean, Asian summer monsoon strengthens, East Asian winter monsoon weakens, the north edge of Asian summer monsoon moves northward and the precipitation of Longxi increases. Meanwhile, the increase of solar activity will force
25
the westerlies to move northward (Haigh, 1996), thereby Asian summer monsoon will move northward into the northwest inner land to bring rainfall there. On the contrast, when solar activity weakens, the temperature of land decreases quickly, winter
CPD
3, 1037–1061, 2007 Precipitation variations of Longxi related to solar activity L. Tan et al. Title Page Abstract Introduction Conclusions References Tables Figures ◭ ◮ ◭ ◮ Back Close Full Screen / EscPrinter-friendly Version Interactive Discussion
soon strengthens (Xiao et al., 2006), summer monsoon weakens, north edge of Asian summer monsoon lies more southward, synchronously westerlies move south ward causing the decrease of precipitation of Longxi.
6 Conclusions
Generally speaking, since AD 960, the climate of Longxi was fluctuating dry until to the
5
driest in the period from the end stage of 17th century to 18th century. After this period the precipitation gradually increased in fluctuations. There were only three short wet periods: from the end of 10th century to the early of 11th century, from the end of 12th century to the early of 13th century and the first half of 20th century.
The precipitation variations of northeast margin of Tibetan plateau and northeast
10
Tibetan plateau are consistent in the last millennium and are well correlated with aver-age temperature variations in North Hemisphere on multi-decadal to centennial scales. Good coherences among the precipitation variations of Longxi and variations of at-mospheric14C concentration, the modeled solar output, the reconstructed total solar irradiance show that solar activity may be the main driving force of precipitation
varia-15
tions of Longxi area on multi-decadal to centennial scales in the last millennium. The synchronous variations of Longxi precipitation and Northern Hemisphere temperature may be ascribed to the same control of solar activity. Solar activity controls the south to north motion of north edge of Asian summer monsoon by affecting Asia summer mon-soon intensity, East Asian winter monmon-soon intensity and the locations of westerlies,
20
thus further dominates precipitation variations of Longxi.
Acknowledgements. We wish to thank H. Xu, J. Chen and H. Long for their help to this
work. This study was supported by the National Basic Research Program of China grant 2004CB720206; National Science Foundation of China grants 40403001 and 40531003; State Key Laboratory of Loess and Quaternary Geology of China grant SKLLQG 0615.
25
CPD
3, 1037–1061, 2007 Precipitation variations of Longxi related to solar activity L. Tan et al. Title Page Abstract Introduction Conclusions References Tables Figures ◭ ◮ ◭ ◮ Back Close Full Screen / EscPrinter-friendly Version Interactive Discussion
References
An, C. B., Feng, Z. D., Tang, L. Y., and Chen, F. H.: Environmental change and cultural transition at 4 cal. Ka BP in central Gansu, Acta. Geogr. Sin., 58(5), 743–748, (in Chinese with English abstract), 2003.
Bard, E., Raisbeck, G., Yiou, F., and Jouzel, J.: Solar irradiance during the last 1200 years
5
based on cosmogenic nuclides, Tellus, 52B(3), 985–992, 2000.
Barron, J. A. and Bukry, D.: Solar forcing of Gulf of California climate during the past 2000 yr suggested by diatoms and silicoflagellates, Mar. Micropaleontol., 62(2), 115–139, 2007. Bond, G., Kromer, B., Beer, J., Muscheler, R., Evans, M. N., Showers, W., Hoffmann, S.,
Lotti-Bond, R., Hajdas, I., and Bonani, G.: Persistent solar influence on North Atlantic climate
10
during the Holocene, Science, 294, 2130–2136, 2001.
Bradley, R. S. and Jones, P. D.: When was the ‘Little Ice Age’?: in: Proceedings of the In-ternational Symposium on the “Little Ice Age”, edited by: Mikame, T., Tokyo Metropolitan University, Tokyo, Japan, 1–4, 1992.
Central Meteorological Bureau: Atlas of flood and drought in China in the last 500 years, Map
15
Press, Beijing, China, (in Chinese), 1981.
Chen, G. Y.: Catalogue of disasters in China, Shanghai Press, Shanghai, China, 1939 (in Chinese).
Crowley, T. J.: Causes of climate change over the past 1000 years, Data archived at the World Data Center for Paleoclimatology, Boulder, Colorado, USA, Science, 289, 270–277, 2000.
20
Deng, T.: Rescue history of China, The Commercial Press, Shanghai, China, 40–48 pp., (in Chinese), 1937
Dong, J. G., Kong, X. G., and Wang, Y. J.: The East Asian Monsoon climate changes at Mt. Shennongjia and its relation to shift of Intertropical Convergence Zone during the Holocene, Quaternary Sci., 26(5), 827–834, (in Chinese with English abstract), 2006 .
25
Dykoski, C. A., Edwards, R. L., Cheng, H., Yuan, D. X., Cai, Y. J., Zhang, M. L., Lin, Y. S., Qing, J. M., An, Z. S., and Revenaugh, J.: A high-resolution, absolute-dated Holocene and deglacial Asian monsoon record from Dongge Cave, China, Earth Planet. Sci. Lett., 233(1– 2), 71–86, 2005.
Fleitmann, D., Burns, S. J., Mudelsee, M., Neff, U., Kramers, J., Mangini, A., and Matter, A.:
30
Holocene forcing of the Indian Monsoon recorded in a stalagmite from southern Oman, Sci-ence, 300, 1737–1739, 2003.
CPD
3, 1037–1061, 2007 Precipitation variations of Longxi related to solar activity L. Tan et al. Title Page Abstract Introduction Conclusions References Tables Figures ◭ ◮ ◭ ◮ Back Close Full Screen / EscPrinter-friendly Version Interactive Discussion
Frisia, S., Borsato, A., Preto, N., and McDermott, F.: Late Holocene annual growth in three Alpine stalagmites records the influence of solar activity and the North Atlantic Oscillation on winter climate, Earth Planet. Sci. Lett., 216(3), 411–424, 2003.
Gong, G. F., Zhang, P. Y., Wu, X. D., and Zhang, J. R.: Research methods of climate changes in historical time, Science Press, Beijing, China, 18–56 pp., (in Chinese), 1983.
5
Haigh, J. D.: The impact of solar variability on climate, Science, 272, 981–984, 1996.
Haigh, J. D.: Modelling the impact of solar variability on climate, J. Atmos. Sol-Terr. Phy., 61(1), 63–72, 1999.
Haltia-Hovi, E., Saarinen, T., and Kukkonen, M.: A 2000-year record of solar forcing on varved lake sediment in Eastern Finland, Quaternary Sci. Rev., 26(5–6), 678–689, 2007.
10
Hodell, D. A., Brenner, M., Curtis, J. H., and Guilderson, T.: Solar forcing of drought frequency in the Maya lowlands, Science, 292, 1367–1370, 2001.
Hong, Y. T, Liu, D. S., Jiang, H. B.,, Zhou, L. P., Beer, J., Hong, B., Zhu, Y. X., Li, H. D, Leng, X. T., Qin, X. G., Wang, Y., Lin, Q. H., and Zeng, Y. Q.: Evidence for solar forcing of climate variation from δ18O of peat cellulose, Sci. China(Ser. D), 43(2), 217–224, 2000.
15
Hong, Y. T., Wang, Z. G., Jiang, H. B., Lin, Q. H., Hong, B., Zhu, Y. X., Wang, Y., Xu, L. S., Leng, X. T., and Li, H. D.: A 6000-year record of changes in drought and precipitation in northeastern China based on a δ13C time series from peat cellulose, Earth Planet. Sci. Lett., 185(1-2), 111–119, 2001.
Hu, F. S., Kaufman, D., Yoneji, S., Nelson, D., Shemesh, A., Huang, Y., Tian, J., Bond, G.,
20
Clegg, B., and Brown, T.: Cyclic variation and solar forcing of Holocene climate in the Alaskan subarctic, Science, 301, 1890–1893, 2003.
Kilcik, A.: Regional sun-climate interaction, J. Atmos. Sol-Terr. Phy., 67(16), 1573–1579, 2005. Kilian, M. R., van der, P. J., and van Geel, B.: Dating raised bogs: new aspects of AMS14C
wiggle matching, a reservoir effect and climatic change, Quaternary Sci. Rev., 14(10), 959–
25
966, 1995.
Lamb, H. H.: The early medieval warm epoch and its sequel, Palaeogeogr. Palaeocl., 1, 13–37, 1965.
Li, J. Z., Wang, D. Q., and Liu, B. C.: Commentary on Dufu’s poetries, Gansu People’s Press, Lanzhou, China, 122, 180, 251, 269 pp., (in Chinese), 1985.
30
Liu, Y., An, Z. S., Ma, H. Z., Cai, Q. F., Liu, Z. Y., Kutzbach, J. K., Shi, J. F., Song, H. M., Sun, J. Y., Yi, L., Li, Q., Yang, Y. K., and Wang, L.: Precipitation variation in the northeastern Tibetan Plateau recorded by the tree rings since 850 AD and its relevance to the Northern
CPD
3, 1037–1061, 2007 Precipitation variations of Longxi related to solar activity L. Tan et al. Title Page Abstract Introduction Conclusions References Tables Figures ◭ ◮ ◭ ◮ Back Close Full Screen / EscPrinter-friendly Version Interactive Discussion
Hemisphere temperature, Sci. China (Ser. D), 49(4), 408–420, 2006.
Liu, Y. F.: Draft of whole records of Gansu, 1936, in: Wu, J.(Eds.): Document series of north-west china(27), Lanzhou Historical document Press, Lanzhou, China, (in Chinese), 1990. Mu, S. Q.: Abstract history of Gan Qing Ning area, Junhua Press, Lanzhou, China, (in Chinese),
1936.
5
Neff, U., Burns, S. J., Mangini, A., Mudelsee, M., Fleitmann, D., and Matter, A.: Strong coher-ence between solar variability and the monsoon in Oman between 9 and 6 kyr ago, Nature, 411, 290–293, 2001.
Ney, E. P.: Cosmic radiation and the weather, Nature, 183, 451–452, 1959.
Ogurtsov, M. G., Helama, S., Eronen, M., and Lindholm, M.: Centennial-to-millennial
fluctua-10
tions in July temperatures in North Finland as recorded by timberline tree rings of Scots pine, Quaternary Res., 63(2), 182–188, 2005.
Perry, C.A.: Comparison of solar luminosity model with paleoclimatic data, in: Institute for Tertiary-Quaternary Studies (TER-QUA), edited by: W. Dort, Symposium Series 2, 25–37, 1994.
15
Perry, C. A. and Hsu, K. J.: Geophysical, archeological, and historical evidence support a solar-output model for climate change, PNAS, 97(23), 12 433–12 438, 2000.
Pudovkin, M. I. and Raspopov, O. M.: The mechanism of action of solar activity on the state of lower atmosphere and meteorological parameters, Geomag. Aeron., 32, 593–608, 1992. Qian, W. H.: Meteorology, Peking university Press, Beijing, China, 185–186, (in Chinese),
20
2004.
Rodolfo Rigozo, N., Roger Nordemann, D. J., Evangelista da Silva H., Pereira de Souza Echer M., and Echer, E.: Solar and climate signal records in tree ring width from Chile (AD 1587– 1994), Planet. Space Sci., 55, 158–164, 2007.
Shindell, D., Rind, D., Balachandran, N., Lean, J., and Lonergan, P.: Solar cycle variability,
25
ozone and climate, Science, 284, 305–308, 1999.
Speranza, A., Van Geel, B., and Van der Plicht, J.: Evidence for solar forcing of climate change at ca. 850 cal BC from a Czech peat sequence, Global Planet. Change, 35(1), 51–65, 2002. Stuiver, M. and Braziunas, T. F.: Atmospheric14C and century scale solar oscillations, Nature,
338, 405–408, 1989.
30
Stuiver, M., Braziunas, T. F., Becker, B., and Kromer, B.: Climatic, solar, oceanic, and geo-magnetic influences on Late-Glacial and Holocene atmospheric14C/12C change, Quaternary Res., 35(1), 1–24, 1991.
CPD
3, 1037–1061, 2007 Precipitation variations of Longxi related to solar activity L. Tan et al. Title Page Abstract Introduction Conclusions References Tables Figures ◭ ◮ ◭ ◮ Back Close Full Screen / EscPrinter-friendly Version Interactive Discussion
Stuiver, M., Braziunas, T. F., Grootes, P. M., and Zielinski, G. A.: Is there evidence for solar forcing of climate in the GISP2 oxygen isotope record?, Quaternary Res., 48(3), 259–266, 1997.
Stuiver, M., Reimer, P. J., Bard, E., Beck, J. W., Burr, G. S., Hughen, K. A., Kromer, B., McCor-mac, G., van der Plicht, J., and Spurk, M.: INTCAL98 radiocarbon age calibration, 24000-0
5
cal BP, Radiocarbon, 40(3), 1041–1083, 1998.
Tang, X.: Study on the north edge of summer monsoon over northwest China, Doctoral disser-tation of Peking University, 2006.
Tinsley, B. A.: Influence of solar wind on the global electric circuit, and inferred effects on cloud microphysics, temperature and dynamics in the troposphere, Space Sci. Rev., 94(1–2), 231–
10
258, 2000.
van Geel, B., Raspopov, O. M., Renssen, H., van der Plicht, J., Dergachev, V. A., and Meijer, H. A. J.: The role of solar forcing upon climate change, Quaternary Sci. Rev., 18(3), 331–338, 1999.
von Rad, U., Schaaf, M., Michels, K. H., Schulz, H., Berger, W. H., and Sirocko, F.: A 5000-yr
15
record of climate change in varved sediments from the oxygen minimum zone off Pakistan, north eastern Arabian Sea, Quaternary Res., 51(1), 39–53, 1999.
Wang, L. and Sarnthein, M.: Holocene variations in Asian monsoon moisture: a bidecadal sediment record from the South China Sea, Geophys. Res. Lett., 26(18), 2889–2892, 1999. Wang, Y. J., Cheng, H., Edwards, R. L., He, Y. Q., Kong, X. G., An, Z. S., Wu, J. Y., Kelly, M.
20
J., Dykoski, C. A., and Li, X. D.: The Holocene Asian Monsoon: links to solar changes and North Atlantic climate, Science, 308, 854–857, 2005.
Xiao, S. B., Li, A. C., Liu, J. P., Chen, M. H., Xie, Q., Jiang, F. Q., Li, T. G., Xiang, R., and Chen, Z.: Coherence between solar activity and the East Asian winter monsoon variability in the past 8000 years from Yangtze River-derived mud in the East China Sea, Palaeogeogr.
25
Palaeocl., 237(2–4), 293–304, 2006.
Xu, H., Hong, Y. T., Lin, Q. H., Zhu, Y. X., Hong, B., and Jiang, H. B.: Temperature responses to quasi-100-yr solar variability during the past 6000 years based on δ18O of peat cellulose in Hongyuan, eastern Qinghai-Tibet Plateau, China, Palaeogeogr. Palaeocl., 230(1–2), 155– 164, 2006.
30
Yan, Z. W., Ye, D. Z., and Wang, C.: Climatic jumps in the flood/drought historical chronology of central China, Clim. Dynam., 6(3–4), 153–160, 1991.
Yan, Z. W., Li, S. Y., and Wang, X. C.: An analysis of decade-to-century-scale climatic jumps in 1052
CPD
3, 1037–1061, 2007 Precipitation variations of Longxi related to solar activity L. Tan et al. Title Page Abstract Introduction Conclusions References Tables Figures ◭ ◮ ◭ ◮ Back Close Full Screen / EscPrinter-friendly Version Interactive Discussion
history, Sci. Atmos. Sin., 17(6), 663–672, (in Chinese with English abstract), 1993.
Yu, Z. C. and Ito, E.: Possible solar forcing of century-scale drought frequency in the northern Great Plain, Geology, 27(3), 263–266, 1999.
Zhang, D. E.: The method for reconstruction of climate series for the last 500 years and its reli-ability, in: Central Meteorological Bureau(Eds.):Collected Papers of Meteorological Science
5
and Technology (4), Meteorological Press, Beijing, China, 17–26 pp., (in Chinese), 1983. Zhang, D. E., Liu, C. Z., and Jiang, J. M.: Reconstruction of six regional dry/wet series and
their abrupt changes during the last 1000 years in east China, Quaternary Sci., 1, 1–11, (in Chinese with English abstract), 1997.
Zhang, D. E.: Collection of weather records in China in the last 3000 years, Jiangsu Education
10
Press, Nanjing, China, (in Chinese), 2004.
Zhang, J. C.: China climate pandect, Meteorological Press, Beijing, China, 125–148 pp., (in Chinese), 1991.
Zhao, S. Y.: Brief nature disaster records in each period of Gansu province, Gansu People’s Press, Lanzhou, China, (in Chinese), 1984.
15
CPD
3, 1037–1061, 2007 Precipitation variations of Longxi related to solar activity L. Tan et al. Title Page Abstract Introduction Conclusions References Tables Figures ◭ ◮ ◭ ◮ Back Close Full Screen / EscPrinter-friendly Version Interactive Discussion
Table 1. Time table of droughts and floods occurred in Longxi during the period of Northern Song, Jin and Mongolia & Yuan Dynasty.
Dynasty Year Flood Drought
Northern Song AD 900 964, 979, 990, 993, 994, 999 968, 974, 992 (AD 960–1127) AD 1000 1000, 1008, 1009, 1010, 1014, 1017, 1018, 1020, 1025, 1039, 1066 1016, 1027, 1058, 1064, 1069, 1067, 1070, 1074, 1076, 1078, 1079, 1077, 1099 1080, 1081, 1082, 1088 Jin (AD 1115–1234) AD 1100 1103, 1109, 1124, 1138, 1158, 1102, 1107, 1123, 1132, 1136, 1142, 1178, 1186, 1143, 1154, 1160, 1174, 1176, 1182, 1189, 1190, 1191, 1193, 1194, 1184, 1187, 1197 Mongolia &Yuan AD 1200 1205, 1206, 1209, 1221, 1225 1201, 1212, 1213, 1216, 1226, 1248, 1266, 1268, 1280, 1285, 1290, 1295, 1296 (AD 1206–1368) AD 1300 1311, 1318, 1320, 1324, 1325, 1302, 1308, 1312, 1315, 1323, 1328, 1326 1329, 1331, 1334, 1336, 1358, 1359 1054
CPD
3, 1037–1061, 2007 Precipitation variations of Longxi related to solar activity L. Tan et al. Title Page Abstract Introduction Conclusions References Tables Figures ◭ ◮ ◭ ◮ Back Close Full Screen / EscPrinter-friendly Version Interactive Discussion
Table 2. Time table of droughts and floods occurred in Longxi during the period of Ming and Qing Dynasty.
Dynasty Year Flood Drought
Ming (AD 1368–1644) AD 1300 1371,1393 AD 1400 1410, 1438, 1448, 1408, 1418, 1426, 1427, 1434, 1437, 1439, 1441, 1451, 1461, 1479 1455, 1468, 1470, 1473, 1474, 1482, 1484, 1485, 1486, 1487, 1490, 1491, 1493, 1494, 1495, 1497 AD 1500 1535, 1537, 1558, 1505, 1506, 1508, 1509, 1512, 1520, 1521, 1528, 1529, 1570, 1580, 1590 1531, 1532, 1538, 1539, 1540, 1545, 1548, 1550, 1555, 1568, 1581, 1582, 1583, 1584, 1585, 1586, 1587, 1588, 1598, 1599 AD 1600 1648, 1652, 1653, 1602, 1606, 1609, 1614, 1615, 1616, 1621, 1626, 1628, 1654, 1655, 1662, 1629, 1630, 1634, 1635, 1636, 1637, 1638, 1639, 1640, 1678, 1681, 1685 1641, 1643, 1651, 1656, 1657, 1659, 1665, 1666, 1667, 1668, 1683, 1684, 1686, 1690, 1691, 1692, 1693, 1694, 1697 Qing (AD 1644–1911) AD 1700 1740, 1744, 1745, 1701, 1703, 1704, 1708, 1712, 1713, 1714, 1715, 1716, 1752, 1753, 1755, 1717, 1718, 1719, 1720, 1721, 1723, 1728, 1729, 1730, 1761, 1772, 1785 1735, 1736, 1737, 1738, 1742, 1743, 1747, 1749 1751, 1754, 1756, 1758, 1759, 1760, 1762, 1763, 1764, 1765, 1766, 1768, 1770, 1771, 1774, 1775, 1776, 1777, 1779, 1780, 1786, 1787, 1789, 1791, 1796, 1799 AD 1800 1818, 1822, 1823, 1802, 1803, 1804, 1805, 1806, 1808, 1810, 1812, 1813, 1881, 1883, 1884, 1815, 1824, 1826, 1827, 1829, 1831, 1832, 1833, 1834, 1885, 1886, 1887, 1835, 1836, 1837, 1838, 1839, 1840, 1842, 1846, 1849, 1889 1850, 1855, 1857, 1860, 1861, 1862, 1865, 1866, 1868, 1870, 1871, 1872, 1875, 1877, 1878, 1879, 1890, 1891, 1892, 1896, 1898, 1899 AD 1900 1904 1900, 1907, 1908, 1909, 1910 1055
CPD
3, 1037–1061, 2007 Precipitation variations of Longxi related to solar activity L. Tan et al. Title Page Abstract Introduction Conclusions References Tables Figures ◭ ◮ ◭ ◮ Back Close Full Screen / EscPrinter-friendly Version Interactive Discussion
Fig. 1.Location of Longxi area. ISM and EASM represent Indian summer monsoon and East Asian summer monsoon respectively.
CPD
3, 1037–1061, 2007 Precipitation variations of Longxi related to solar activity L. Tan et al. Title Page Abstract Introduction Conclusions References Tables Figures ◭ ◮ ◭ ◮ Back Close Full Screen / EscPrinter-friendly Version Interactive Discussion
Fig. 2.10-year averaged D/F series of Longxi since AD 960 (−1, wet; −0.5, mildly wet; 0, fitting climate; 0.5, mildly dry; 1, dry), the black line represents 5-point AA moving averaged result.
CPD
3, 1037–1061, 2007 Precipitation variations of Longxi related to solar activity L. Tan et al. Title Page Abstract Introduction Conclusions References Tables Figures ◭ ◮ ◭ ◮ Back Close Full Screen / EscPrinter-friendly Version Interactive Discussion
Fig. 3.Comparison of annual D/F series and 10-year averaged D/F series of Lanzhou, the grey line indicates annual D/F level, the black line represents 10-year averaged D/F level.
CPD
3, 1037–1061, 2007 Precipitation variations of Longxi related to solar activity L. Tan et al. Title Page Abstract Introduction Conclusions References Tables Figures ◭ ◮ ◭ ◮ Back Close Full Screen / EscPrinter-friendly Version Interactive Discussion
Fig. 4.Comparison of D/F series between Longxi and Lanzhou. The thin line represents 5-point AA moving averaged result of 10-year averaged D/F series of Longxi, the thick line represents 5-point AA moving averaged result of 10-year averaged D/F series of Lanzhou.
CPD
3, 1037–1061, 2007 Precipitation variations of Longxi related to solar activity L. Tan et al. Title Page Abstract Introduction Conclusions References Tables Figures ◭ ◮ ◭ ◮ Back Close Full Screen / EscPrinter-friendly Version Interactive Discussion
Fig. 5.Comparison of D/F series of Longxi (B), Northern Hemisphere temperature (A)(Crowley, 2000) and precipitation reconstructed series of Dulan (C) from tree ring after 40-year moving average (REC, the reconstructed curve)(Liu et al., 2006).
CPD
3, 1037–1061, 2007 Precipitation variations of Longxi related to solar activity L. Tan et al. Title Page Abstract Introduction Conclusions References Tables Figures ◭ ◮ ◭ ◮ Back Close Full Screen / EscPrinter-friendly Version Interactive Discussion
Fig. 6. Comparison of variations between precipitation of Longxi and solar activity since AD 960. The atmostpheric 14C comes from Stuiver et al. (1998) (B), the modeled solar output series comes from Perry (1994) (C), the reconstructed total solar irradiance (TSI) series comes from Bard et al. (2000) (D). The letters O, W, S, M, D in (B) represent five minima of solar activity known as Oort (AD 1010–1050), Wolf (AD 1280–1340), Spoerer (AD 1420–1530), Maunder (AD 1645–1715) and Dalton (AD 1795–1820) during the last millennium.