HAL Id: hal-00298931
https://hal.archives-ouvertes.fr/hal-00298931
Submitted on 19 Feb 2008HAL is a multi-disciplinary open access
archive for the deposit and dissemination of sci-entific research documents, whether they are pub-lished or not. The documents may come from teaching and research institutions in France or abroad, or from public or private research centers.
L’archive ouverte pluridisciplinaire HAL, est destinée au dépôt et à la diffusion de documents scientifiques de niveau recherche, publiés ou non, émanant des établissements d’enseignement et de recherche français ou étrangers, des laboratoires publics ou privés.
Modeling for transboundary water resources planning
and allocation
D. Juízo, R. Lidén
To cite this version:
D. Juízo, R. Lidén. Modeling for transboundary water resources planning and allocation. Hydrology and Earth System Sciences Discussions, European Geosciences Union, 2008, 5 (1), pp.475-509. �hal-00298931�
HESSD
5, 475–509, 2008
Water sharing in transboundary water
resources systems
D. Ju´ızo and R. Lid ´en
Title Page Abstract Introduction Conclusions References Tables Figures ◭ ◮ ◭ ◮ Back Close
Full Screen / Esc
Printer-friendly Version
Interactive Discussion Hydrol. Earth Syst. Sci. Discuss., 5, 475–509, 2008
www.hydrol-earth-syst-sci-discuss.net/5/475/2008/ © Author(s) 2008. This work is distributed under the Creative Commons Attribution 3.0 License.
Hydrology and Earth System Sciences Discussions
Papers published in Hydrology and Earth System Sciences Discussions are under open-access review for the journal Hydrology and Earth System Sciences
Modeling for transboundary water
resources planning and allocation
D. Ju´ızo1and R. Lid ´en2
1
Universidade Eduardo Mondlane, Faculdade de Engenharia, Av. de Moc¸ambique, CP 257, Km 1.5, Maputo, Moc¸ambique
2
Lund University, Department of Water Resources Engineering, PO Box 118, 221 00 Lund, Sweden
Received: 9 January 2008 – Accepted: 11 January 2008 – Published: 19 February 2008 Correspondence to: D. Ju´ızo ([email protected])
HESSD
5, 475–509, 2008
Water sharing in transboundary water
resources systems
D. Ju´ızo and R. Lid ´en
Title Page Abstract Introduction Conclusions References Tables Figures ◭ ◮ ◭ ◮ Back Close
Full Screen / Esc
Printer-friendly Version
Interactive Discussion Abstract
International water resources agreements for transboundary rivers in southern Africa are based on system analysis models for water planning and allocation. The Wa-ter Resources Yield Model (WRYM) developed in South Africa has so far been the only model applied in official joint water resources studies aimed to form water-sharing
5
agreements. The continuous discussion around the model performance and grow-ing distress over it begrow-ing South African, where it was originally developed, while South Africa is one of the interested parties in the process, results in an increased controversy over the system analysis results that are often only meant to guide in selecting the op-tions for water resources management in a given set of scenarios. The objective of this
10
study was therefore to assess the model performance of two other models; WAFLEX and WEAP21 in the Umbeluzi River Basin system where the WRYM was previously applied as part of a Joint River Basin Study. A set of basin development scenarios was equally tested in the three models and the results compared. The results show that the three models all are possible tools for system analysis of river basins in southern
15
Africa, although the structure and complexity of the models are different. The obtained level of satisfaction for specific water users could, however, vary depending on which model was used, which causes uncertainties. The reason for the diverse results is the structurally different ways of describing allocation and prioritization of water in the three models. However, the large degrees of freedom in all system models cause even larger
20
uncertainty in the results since the model user can, intentionally or unintentionally, di-rect the results to favor certain water users. The conclusion of this study is therefore that the choice of model does not per se affect the decision of best water allocation and infrastructure layout of a shared river basin. The chosen allocation and prioritization principles for the specific river basin and the model user’s experience and integrity are
25
HESSD
5, 475–509, 2008
Water sharing in transboundary water
resources systems
D. Ju´ızo and R. Lid ´en
Title Page Abstract Introduction Conclusions References Tables Figures ◭ ◮ ◭ ◮ Back Close
Full Screen / Esc
Printer-friendly Version
Interactive Discussion 1 Introduction
Water resources systems are generally complex with both qualitative and quantitative factors governing water resources availability (Raju and Pillai, 1999). In southern Africa the high climatic variability further adds complexity. Both the large seasonal variations and the interannual variations, with long dry spells, makes infrastructural solutions
nec-5
essary to assure water availability at all times. The role of reservoirs in water resources management in Southern Africa is highlighted by Van der Zaag and Bolding (2005).
However, building infrastructures will not on its own ensure water availability and eq-uitable water allocation between countries and users of a particular river basin. The system of natural and regulated water resources must be optimized and managed for
10
sustainable use of the water resources. In southern Africa, water resources allocation between different users and between different riparian countries is therefore commonly based on system analysis tools. System analysis tools are adequate to evaluate and propose the best management strategies towards maximization of benefits for a given number of users under given objective functions in the catchment. As pointed out by
15
Dent (2001) “. . . a model is a tool to help organize a negotiation or learning process in which its primary function is to provide a framework for thinking by enabling partici-pants to make their implicit assumptions explicit in a systematic manner”. Despite being a simplification of a complex water resources system, a system analysis model gives the opportunity for decision makers to know beforehand the consequence of a chosen
20
management option or scenario. These tools are therefore important instruments for authorities and governments to adopt policies for water resources management in both national and transboundary river basins. However, because the stakeholders or coun-tries objectives often are conflicting it is necessary that the model or software used is considered unbiased.
25
In southern Africa the countries have not yet agreed in the set of decision support tools that should apply in the optimization process. The experience from the already implemented joint system analysis studies in Umbeluzi and Incomati rivers in southeast
HESSD
5, 475–509, 2008
Water sharing in transboundary water
resources systems
D. Ju´ızo and R. Lid ´en
Title Page Abstract Introduction Conclusions References Tables Figures ◭ ◮ ◭ ◮ Back Close
Full Screen / Esc
Printer-friendly Version
Interactive Discussion Africa (Consultec and BKS Acres, 2000; SWECO and Associates, 2005) has shown
preference to the Water Resources Yield Model (WRYM) as the tool adopted for sys-tem analysis. The experience from these studies, however, shows that the results obtained from WRYM are not easily understood by the stakeholders, and government representatives of different countries bear some suspicion about the results from the
5
system analysis. The lack of trust in the system analysis tool has prevented a smooth negotiation on transboundary water resources allocation, focusing the discussion on the nature and properties of the tools rather than the strategies that can be applied to optimize water resources allocation between countries.
Water resources system analysts are challenged to produce a system analysis
10
model that considers both the legal framework and the true behavior in the system. Stakeholders often share water resources at very local level and rely mostly on cus-tomary principles embodied in local level institutions (Van der Zaag and Bolding, 2005). Integrating small stakeholders in a large-scale river basin management thus needs har-monization of local and regional interests. In the case a water release in a large basin
15
targets the most downstream user, e.g. environment flow to the estuary, all the local water users along the river must have a corresponding objective not to use this wa-ter, otherwise the reserved water will gradually be allocated between the local users starting with the most upstream community. This situation is even more difficult in transboundary rivers. In such a situation the question is: how complex should a
sys-20
tem analysis model be to handle this scale problem but at the same time be sufficiently transparent and uncomplicated to give stakeholders information for setting and accept-ing allocation criteria?
This study examines the role that decision support tools play in the agreement pro-cess by evaluating three different system analysis model packages for water allocation
25
for the same river basin, the Umbeluzi River in Swaziland and Mozambique. The ob-jective is to compare these models in terms of complexity, reliability of results, trans-parency and to assess whether the model selection may affect the decision of best water allocation and infrastructure layout of a shared river basin.
HESSD
5, 475–509, 2008
Water sharing in transboundary water
resources systems
D. Ju´ızo and R. Lid ´en
Title Page Abstract Introduction Conclusions References Tables Figures ◭ ◮ ◭ ◮ Back Close
Full Screen / Esc
Printer-friendly Version
Interactive Discussion
2 Material and methods
Because the WRYM is the preferred model tool for system analysis of international river basins in the SADC region (Carmo Vaz and Van der Zaag, 2003) a comparative analysis of model performance was conducted through applying two other models in a river basin where the WRYM had been applied. As a case study it was chosen to
5
do the assessment in the Umbeluzi River in which the WRYM has previously been set up as part of the Joint Umbeluzi River Basin Study (JURBS) that aimed to prepare the baseline for a new water resources sharing agreement between Swaziland and Mozambique (SWECO and Associates, 2005). The Umbeluzi River basin was chosen because it is a relatively simple water resources system which is faced with some of
10
the core challenges of transboundary rivers in southern Africa: high climatic variability, scarce water resources, upstream contra downstream users, large-scale contra small-scale users and significant environmental flow requirements. The challenges for water resources management in the Umbeluzi River basin have previously been studied by Juizo et al. (2006).
15
The basis for the study was that the different models would apply the same inputs and configuration as was used in the study by SWECO and Associates (2005). As a first step the WRYM model runs by SWECO and Associates were reproduced to simu-late a set of different development scenarios for the Umbeluzi River basin. Secondly a spreadsheet based system analysis model, WAFLEX, and a corresponding GIS based
20
software, WEAP21, were set up for the Umbeluzi River and applied for the same devel-opment scenarios. The WAFLEX model has been used previously in analyzing other river basins in SADC region, namely the Incomati, Maputo and Save (Sengo et al., 2005; De Groot, R. and Oosterwijk, W., 2006; Symphorian et al., 2003). While the WEAP21 was used in the Olifants river a tributary to Limpopo river (L ´evite and Sally,
25
HESSD
5, 475–509, 2008
Water sharing in transboundary water
resources systems
D. Ju´ızo and R. Lid ´en
Title Page Abstract Introduction Conclusions References Tables Figures ◭ ◮ ◭ ◮ Back Close
Full Screen / Esc
Printer-friendly Version
Interactive Discussion 2.1 The Umbeluzi River basin
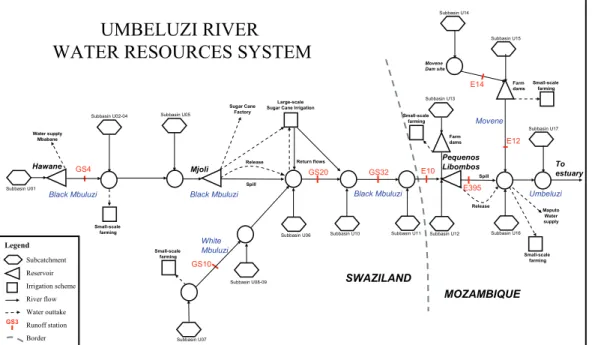
The headwater of the Umbeluzi River is located in Swaziland close to its western bor-der with South Africa (Fig. 1). The river flows in an easterly direction and discharges into the Indian Ocean via the Espirito Santos estuary south of Maputo City in Mozam-bique. The total catchment area of the Umbeluzi River basin is 5400 km2 (SWECO
5
and Associates, 2005). 40% of the area is in Mozambique, 58% in Swaziland and only 2% in South Africa. Two major tributaries join the main river, the White Umbeluzi in Swaziland and the Movene in Mozambique.
The altitude increases from the sea level to almost 2000 m a.s.l. in the western part. Rainfall varies from 500 mm/year in the lower parts to 1500 mm/year in the
mountain-10
ous part. The basin experiences two distinct seasons; the rainy season from November to April and the dry season between May and October. Two major dams are located in the basin. The Mnjoli Dam, with total capacity of 152 million m3 was built in 1978 with purpose to secure water for the sugar cane estates in eastern Swaziland. The Pequenos Libombos Dam in Mozambique, with total capacity of 385 million m3, was
15
constructed in 1987 mainly to secure the urban water supply for the Maputo City. The intake and water treatment plant for Maputo City is located some kilometers down-stream of the Pequenos Libombos and the dam is therefore constantly releasing a minimum flow to allow for water supply. In addition, a small dam in the upper basin in Swaziland, the Hawane (2.75 million m3), supplies the capital Mbabane with fresh
20
water.
The largest water user in the Umbeluzi basin is irrigation (Table 1). The sugar cane estates in eastern Swaziland stand for more than 70% of the present water demand. The total estimated present water demand for surface water is 350 million m3/year but is forecasted to increase to 586 million m3/year by the year 2025. The available water,
25
under natural conditions, is estimated to be 535 million m3/year (SWECO and Asso-ciates, 2005). The two countries have a number of small-scale users distributed in the catchment and because of the water scarcity many proposals exist to build storage infrastructure.
HESSD
5, 475–509, 2008
Water sharing in transboundary water
resources systems
D. Ju´ızo and R. Lid ´en
Title Page Abstract Introduction Conclusions References Tables Figures ◭ ◮ ◭ ◮ Back Close
Full Screen / Esc
Printer-friendly Version
Interactive Discussion A simplified schematic of the Umbeluzi water resources system, for the present
in-frastructure development, is shown in Fig. 2. In the schematic is shown the subbasins generating natural runoff, main water users, channels links, dams and diversion chan-nels. Scattered water users have been aggregated according to their location. Return flows from irrigation areas have been included for the large-scale schemes.
5
2.2 System analysis models
Water allocation in a river basin is usually a two step process as given in Fig. 3. In the first step (A) hydrological modeling is applied to simulate the distributed rainfall and runoff processes in the catchment. This model is normally calibrated against ob-served flow sequences at selected stations along the basin. Given that, in most cases,
10
observed runoff is already influenced by water uses the hydrological model is used to obtain naturalized or virgin flows of the catchment that represent the natural runoff conditions.
The naturalization of runoff is done by removing the known historic water uses from the model. For the Umbeluzi these values were obtained from the PITMAN
rainfall-15
runoff model set up by SWECO and Associates (2005). The second level (B) of the system analysis concerns testing development scenarios of river basin development and water use. The model itself uses input of naturalized flow, river channels, dam characteristics, environmental flow requirements and scenarios of water use and af-forestation. Different models approach water allocation differently but are all based on
20
water balance in a network of nodes symbolizing the physical components of a river basin and links representing conduits of water between nodes (Wang et al., 2003). Al-location principles and priorities for different uses are normally set in the models based on national and international policies and, in the transboundary case, on water sharing agreements if existing.
HESSD
5, 475–509, 2008
Water sharing in transboundary water
resources systems
D. Ju´ızo and R. Lid ´en
Title Page Abstract Introduction Conclusions References Tables Figures ◭ ◮ ◭ ◮ Back Close
Full Screen / Esc
Printer-friendly Version
Interactive Discussion 2.2.1 Water Resources Yield Model (WRYM)
WRYM was developed in South Africa by the BKS consulting firm based on the Cana-dian ACRES Reservoir Simulation Program (Mackenzie and Van Rooyen, 2003). It relies on a solver that optimizes the water allocation in a river system based on a set of penalties for storage, channels and demands at various nodes and links. It minimizes
5
a cost function based on storage and allocation deficit cost but also between different forms of storage in a catchment (Mackenzie and Van Rooyen, 1999). At the core of this model is a penalty structure used in the decision about storing or allocating water in the system. Penalties are assigned to links supplying water reservoirs and other sources to users and to distinguish between different forms of storage in reservoirs nodes and
10
across the catchment. Grossmann et al. (1995) gives details of the use of network theory in linear programming to solve water allocation problems of water resources systems.
In the example shown in Table 2, the storage in the dam has been divided into four zones. The upper zone is above the full supply level (FSL) and has therefore a very
15
high penalty. The second zone is between FSL and the 90% capacity. This zone has a penalty of 2 units. The third zone represents the water between the 90% level and the dead storage level (DSL). Water in this zone has a penalty of 20 units and represents the main working storage for the reservoir. The water between the DSL and the bottom of the dam has a relatively very high value of 10 000 units. Thus the model will never
20
draw water from this zone to meet the downstream demand. The four penalties used in the example have the effect of restricting the working storage of the dam to the second and third zones. In the model there are possibilities to have more zones than shown in the example.
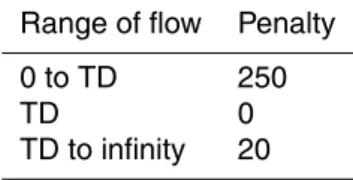
Table 3 shows a typical penalty structure for a channel with a specified target draft
25
(TD). Failing to meet the target draft results in a penalty of 250 units. If the target draft is supplied, there is a zero penalty and if it is exceeded, the excess flow results in a penalty of 20 units. For further explanation of the penalty structure of the WRYM model,
HESSD
5, 475–509, 2008
Water sharing in transboundary water
resources systems
D. Ju´ızo and R. Lid ´en
Title Page Abstract Introduction Conclusions References Tables Figures ◭ ◮ ◭ ◮ Back Close
Full Screen / Esc
Printer-friendly Version
Interactive Discussion see the User Guide – 4.1.1 (Mackenzie and Van Rooyen, 1999).
In WRYM the network is analyzed for each time period and solved with the selected penalty structures. The network solver will minimize the penalties for each time step by choosing the best allocation of water to the different users. It will also choose the most attractive route (i.e. minimum penalty) for transferring the water from the storage
5
zones to the demand centers.
The WRYM is widely used in southern Africa and is the chosen tool by the South African Department of Water Affairs and Forestry for system analysis of all the river basins in South Africa (Carmo Vaz and Van der Zaag, 2003).
2.2.2 Water Allocation Flow model in Excel (WAFLEX)
10
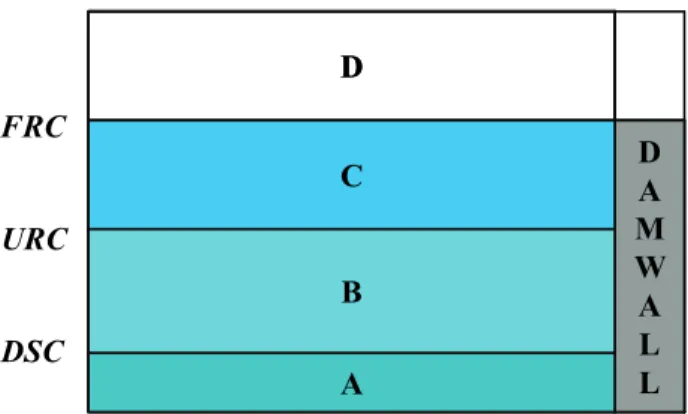
The WAFLEX model was first introduced by Savenije (1995) for water resources simu-lation. It is a simple water balance model that uses the basic spreadsheet capacity to simulate complex systems. It is easy to build and very transparent as everything takes place in Excel spreadsheets. Water allocation strategies of this model are based on a comparison of demand and availability. Reservoir operation is based on the division of
15
the storage in different forms as given in Fig. 4.
The storage is divided in four zones. If the level of storage is under the Dead Storage Curve (DSC), no water will be released. If the level of storage is between the DSC and the Utility Rule Curve (URC) the release will be rationed as a factor of the demand. This is also known as hedging rules (Draper and Lund, 2004). The reduction factor which
20
is set by the model user is triggered at the URC threshold and is fixed throughout the deficit period. If the level of storage is between URC and Flood Rule Curve (FRC) the demands will be fully satisfied. At last, if the level of storage is above FRC the reservoir spills. In the WAFLEX, subsequent to reservoir release, the water is available to satisfy the demands in first come first serve order. It is, however, also possible to
25
build more complex models by developing Macros that are routines designed to impose a designed sequence of allocating water to downstream users.
HESSD
5, 475–509, 2008
Water sharing in transboundary water
resources systems
D. Ju´ızo and R. Lid ´en
Title Page Abstract Introduction Conclusions References Tables Figures ◭ ◮ ◭ ◮ Back Close
Full Screen / Esc
Printer-friendly Version
Interactive Discussion The demand module calculates in upstream direction to determine the demands for the
reservoir release. The supply module calculates in downstream direction of the flow. Reservoir releases are calculated using macros in which the operation rule curves are used and the demands are determined by the demand module (Symphorian et al., 2003). This computation also includes reservoir losses through evaporation.
5
2.2.3 Water Evaluation and Planning system (WEAP21)
WEAP21 was developed by Stockholm Environment Institute (SEI) and is widely used as a system analysis model (Sieber et al., 2002). WEAP21 operates on the basic principle of water balancing, accounting between supply and demand at various system nodes. WEAP21 also has a GIS function allowing the user to visualize the network on
10
the screen and interactively modify or update the inputs of the model. In recent years this software has become popular in various research related to climate adaptation within UN organizations and others especially in research on effect of climate change on agriculture (Rosenzweig et al., 2004; Yates et al., 2005; Joyce et al., 2006).
The reservoir operation is similar to that of WAFLEX. During the rationing period
15
only a fraction of the storage is available for release. However, an added complexity in this model is the possibility of using a priority rule to give preference for use of certain reservoirs for satisfying the demands. A reservoir with lower priority will empty faster than those with higher priorities. Furthermore, in the WEAP21 model there is a possibility of controlling the water that is supplied to different users once it is released
20
from the reservoir. This is done through a priority rule that set preferences to higher valued uses such as urban water supply and environmental water requirements as compared to other water uses; the same range of priority values applies. In essence the mix of the set of supply and storage priority assigned to the network will drive the model and the water allocation.
HESSD
5, 475–509, 2008
Water sharing in transboundary water
resources systems
D. Ju´ızo and R. Lid ´en
Title Page Abstract Introduction Conclusions References Tables Figures ◭ ◮ ◭ ◮ Back Close
Full Screen / Esc
Printer-friendly Version
Interactive Discussion 2.2.4 Comparison of the models
All three models are explicit system analysis models and depend on input of distributed naturalized inflow calculated by other methods.
The main differences of the three models are how the decision to allocate water from storage is done. The WRYM is flexible in the way it approaches water allocation to
5
different users in a catchment. The numerical optimization is essentially limited to the users downstream each reservoir. However, in case there are complex interconnec-tions of reservoirs in the basin these can be incorporated in the model. The WEAP21 essentially follows a priority rule of allocation. The system water reallocation is driven by water user priority versus reservoir priority allowing downstream users to benefit
10
from any given upstream reservoir in the catchment. Also the allocation between users along the system will follow a priority rule given high preference to high value users. In WAFLEX water is allocated to downstream nodes connected to reservoirs. In order to enable an upstream reservoir to support a downstream it is necessary to build auxiliary functions that can only capture information from the time step before the one in
compu-15
tation. In other words it is more a compensation function than a direct support between the reservoirs. In the case where reservoirs are located in tributaries feeding to a down-stream down-stream leading to a user, the WRYM penalty structure allows for reservoirs to conjunctively operate to satisfy these demands in the catchment. The reservoirs with lowest penalties will be mobilized first to meet deficits of supply by another concurrent
20
reservoir. WEAP21 on the other hand is mostly based on comparative value of the reservoir and the user in question. Normally, users should have high priority value as-sociated with their demands in order to profit from water in storage in a given reservoir. The order in which dams will be mobilized to meet the different deficits in downstream nodes is given by the priority in filling that is assigned to the reservoirs.
25
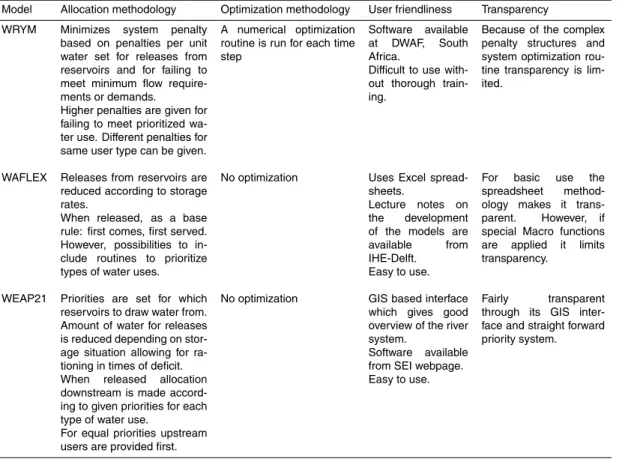
Table 4 gives a comparison of the main features and differences of the three system analysis models used in the Umbeluzi River basin.
HESSD
5, 475–509, 2008
Water sharing in transboundary water
resources systems
D. Ju´ızo and R. Lid ´en
Title Page Abstract Introduction Conclusions References Tables Figures ◭ ◮ ◭ ◮ Back Close
Full Screen / Esc
Printer-friendly Version
Interactive Discussion 2.3 System configurations
The schematic in Fig. 2 together with identified sites for new dams and expected future water outtakes was used as basis for all models. Naturalized monthly inflows from 1925 to 1999 for all the subbasins of the Umbeluzi River, produced by SWECO and Associates (2005), were used as input to all three models. As a basis for the water
5
allocation, priorities were generally set according to the policies in southern Africa (SADC, 2000). All other inputs values such as reservoir net-evaporation, precipitation and demands for different scenarios are equally based on the study by SWECO and Associates (2005).
SWECO and Associates (2005) used a calibration methodology to set the penalty
10
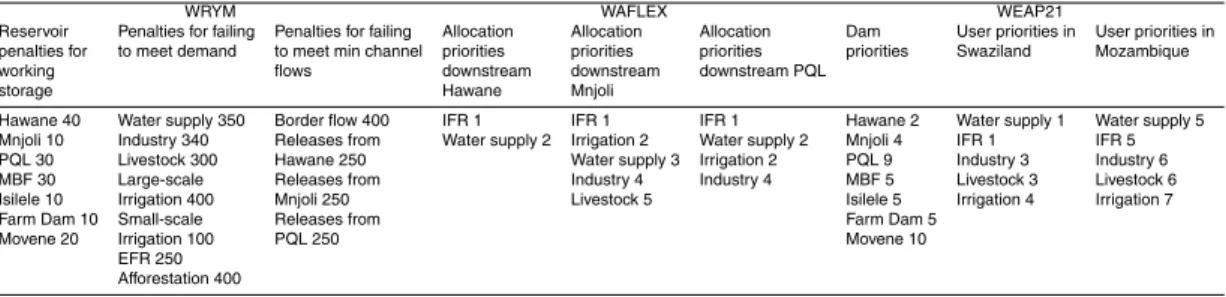
structure of the model. The basis for the calibration was the knowledge of present water management in the river basin and the observed runoff records. Realistic penalties could thus be found through an iterative process where simulated and observed river runoff was compared. In a similar manner the priorities for reservoirs and water uses were set in the WAFLEX and the WEAP21 (Table 5).
15
Table 5 shows that to enable a description of the historic and present water manage-ment in the Umbeluzi River basin the model parameters were set to values that partly contradict the international and national water policies. For instance, for failing to meet the demands of large-scale scale irrigation in Swaziland the WRYM penalties are set even higher than failing to meet urban water supply demands. On the other hand, the
20
WRYM has included an equally high penalty for failing to meet the set minimum border flow determined by the 1976 bi-lateral agreement between the countries (Juizo et al., 2006) aiming at supporting the Maputo City.
In WAFLEX a central demand and supply module was introduced, which enabled to put the abstraction nodes downstream of the reservoirs in the order of preference.
25
Trough this module, irrigation was prioritized downstream of the Mnjoli Dam in favor for domestic water supply, while the opposite was made downstream of Pequenos Libombos (Table 5).
HESSD
5, 475–509, 2008
Water sharing in transboundary water
resources systems
D. Ju´ızo and R. Lid ´en
Title Page Abstract Introduction Conclusions References Tables Figures ◭ ◮ ◭ ◮ Back Close
Full Screen / Esc
Printer-friendly Version
Interactive Discussion The WEAP21 parameters were also set according to the present praxis that the
dams as first priority support the local users. The relatively lower priorities (higher values) set for the Mozambique users and the Pequenos Libombos dam (Table 5) give the effect that no water from the Swaziland reservoirs is allocated to Mozambican users.
5
It should thus be noted that the internationally and nationally adopted policies for allocation (e.g. SADC 2000) are not strictly followed by the system analysis model, despite that they are stated as a basis for the modeling. The reason is that water resources have not, and are presently not, allocated according to these policies on the catchment scale in the Umbeluzi River. As a choice the model developer, in this
10
case SWECO and Associates (2005) and the authors, thus chose to describe the river systems as it works today rather than how it would work if the SADC protocol was strictly followed.
The three models were developed to simulate three scenario developments in the basin (Table 6) targeting mainly three main demands in the system (i) urban water
sup-15
ply; (ii) irrigation development and (iii) environmental flow releases to the estuary for present (2005) and future conditions (2025). Scenario 1 uses the present infrastruc-ture, while the other two scenarios include development of new dams. The specific demands for all present and future users were set equal in the three system analysis models.
20
3 Results
The results of the three models were compared in terms of level of satisfaction for different users and the dam behavior. The level of satisfaction is the ratio between supplied water and demand for the whole period of modeling.
The models’ natural runoff input covered a period of 75 years (1925–1999). Through
25
the long series, the models can thus provide estimates of the available water re-sources for different demand and infrastructure scenarios taking into account the climatic variability of southern Africa.
HESSD
5, 475–509, 2008
Water sharing in transboundary water
resources systems
D. Ju´ızo and R. Lid ´en
Title Page Abstract Introduction Conclusions References Tables Figures ◭ ◮ ◭ ◮ Back Close
Full Screen / Esc
Printer-friendly Version
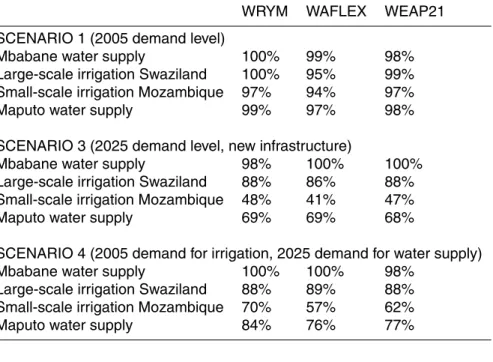
Interactive Discussion Despite differences in the level of satisfaction that can be seen for specific demands
and scenarios, all models perform similarly (Table 7). As expected when comparing 2005 and 2025 (Scenarios 1 and 3) the level of satisfaction decreases for the large users (e.g. large-scale irrigation and Maputo City). It shows that the additional stor-age capacities introduced are not sufficient to balance the increased water demand
5
(Table 1) on the catchment scale. Only for small users in the upper Umbeluzi and in the tributaries, the additional reservoir storages compensate for the increased demand (e.g. for Mbabane water supply). Even when irrigation development is restricted and new infrastructure is put in place (Scenario 4), the level of satisfaction for urban water supply to Maputo does not reach acceptable levels.
10
A comparison of the dynamics of the main reservoirs (exemplified for Mnjoli Dam in Figure 5) confirms that the three models perform similarly.
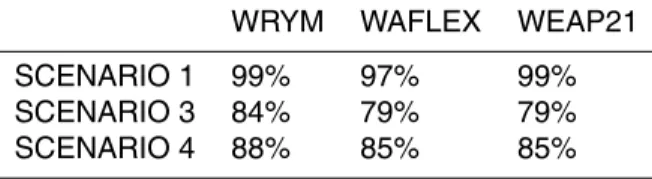
A more detailed examination of the results of the three models shows that the WRYM model has a totally larger level of satisfaction for all users, although the difference is not large (Table 8). For specific users the models may also give different results. An
15
example is the small-scale irrigation that shows significant differences in satisfaction levels for the three models (Table 7). Since satisfaction levels are closely linked to the production yield the different model results may therefore affect the judged feasibility of these irrigation schemes. Also the satisfaction levels for Maputo City show varying levels, although all three models predict levels far below what is acceptable for urban
20
supply for both Scenario III and IV.
Another way of expressing how the models performed in meeting demands is to calculate the assurance of supply (Wurb, 2005), i.e. for how many months of the total period the demand was fully supplied. All three model results for assurance of supply were similar to those for satisfaction levels. A trend was, however, that assurance of
25
supply is generally lower than satisfaction level for the users located in small tributaries with limited upstream storages.
HESSD
5, 475–509, 2008
Water sharing in transboundary water
resources systems
D. Ju´ızo and R. Lid ´en
Title Page Abstract Introduction Conclusions References Tables Figures ◭ ◮ ◭ ◮ Back Close
Full Screen / Esc
Printer-friendly Version
Interactive Discussion
4 Discussion
The results of the three system analysis models applied for the Umbeluzi River basin in this study revealed two general and essential findings:
1. Different system analysis models may give differences in satisfaction levels for specific water users although the same governing input variables are used.
5
2. The degrees of freedom in all three system analysis models are very large and thus the model user has huge power to allocate water although the models are generally described to follow the internationally accepted allocation principles. The differences in satisfaction levels for specific water users found in this study most probably depend on the different ways water allocation and prioritization are structurally
10
handled in the three models. In general terms the prioritization between different users were described similarly in all models but the exact levels of satisfaction still differed. In the water scarce situation, as described by scenario 3 where total demand is higher than the available water resources, all three models gave higher level of satisfaction to the large-scale irrigation in Swaziland compared to all the downstream users in
15
Mozambique. So in general terms all models allocated water as intended. But the level of satisfaction calculated with the three models for specific users could vary with up to 10–20% units, especially for smaller users. Such differences may give a significant difference in the long-term feasibility of the applied agriculture. On the other hand, the application of the three models showed that for large-scale users all three models gave
20
similar satisfaction levels as seen by Table 7.
The differences in satisfaction levels due to the different structure of the models are, however, completely overridden by the different results that can be obtained through changing the allocation priorities in the models. The set up of the three system anal-ysis models for Umbeluzi River illustrated that the allocation principles stated by the
25
HESSD
5, 475–509, 2008
Water sharing in transboundary water
resources systems
D. Ju´ızo and R. Lid ´en
Title Page Abstract Introduction Conclusions References Tables Figures ◭ ◮ ◭ ◮ Back Close
Full Screen / Esc
Printer-friendly Version
Interactive Discussion users set up the prioritization according to how the water has been allocated
histori-cally. The reason was that the model users judged this as the most probable scenario in the future. The Mnjoli Dam was constructed by, and for, the sugar cane estates in Swaziland and the Pequenos Libombos dam was constructed by the Government of Mozambique for water supply to Maputo City. History shows that it is very difficult to
5
change allocation patterns and, faced with the task to predict future water resources management, the model user chose the most likely allocation forecast, which is that things will be as they always have been. SWECO and Associates (2005) made a sen-sitivity analysis for the Umbeluzi River basin and found that by changing the penalties in the WRYM model to favor the downstream Maputo water supply the assurance of
10
supply could be increased with 30% for the City and that overall satisfaction levels could be slightly increased for the whole catchment. This of course led to decreased assurances of supply for the upstream irrigation schemes. If the prioritizations for water user types in Swaziland and Mozambique in the WEAP21 (Table 6) were set equal, the results would have been similar. Then water would have been drawn from the Mnjoli to
15
support Maputo City before allocating water to the irrigation schemes.
What is essential is whether the stakeholders realize that these choices have been made by the model user. The system analysis models are generally described to follow the international praxis of water allocation, and even if the input data and parameters are reported in detail the stakeholders normally lack the knowledge to comprehend
20
them. This is why the transparency and user friendliness of the models are important factors in the system analysis. If there is no understanding or transparency of the sys-tem analysis modeling, considerable trust must exist between the stakeholders and the model user (Chapman et al., 1995). Such trust has been developed between the De-partment of Water Affairs and Forestry and the consultants running the WRYM in South
25
Africa. Despite that the WRYM model is complicated to use and has limited trans-parency it is therefore chosen as the preferred tool in South Africa for water resources allocation. In transboundary rivers in southern Africa the same trust does not exist between the model users, which are often South African, and the other governments
HESSD
5, 475–509, 2008
Water sharing in transboundary water
resources systems
D. Ju´ızo and R. Lid ´en
Title Page Abstract Introduction Conclusions References Tables Figures ◭ ◮ ◭ ◮ Back Close
Full Screen / Esc
Printer-friendly Version
Interactive Discussion acting as stakeholders.
It may therefore be necessary to review the process of water resources planning and allocation in transboundary rivers in southern Africa. An important step is to agree on the allocation principles and the modeling procedure before the models are applied. This goes beyond the general principles already agreed in the SADC protocol. The
5
principles and procedures may be different depending on the local or regional situation for the different rivers. This step also includes the choice of model tool, model user and a procedure on how to make the modeling transparent to as many stakeholders as possible. Capacity building of the stakeholders is obviously a key factor in this process. This study may give advice on the choice of system analysis tool. All three models
10
applied to the Umbeluzi Rivers have the functions necessary to make a system analysis of water resources in a river basin in southern Africa. The WEAP model, by its priority rule base allocation, seems to give the best possibility to maximize water use in a whole river basin by allowing reservoirs to support each other in times of scarcity. For river basin systems that are even more complicated and where water has a high
15
price, e.g. systems including large hydropower schemes or large interbasin transfers for thermo power cooling that require high reliability of supply, the WRYM models may be advantageous to the WAFLEX and WEAP21.
The numerical optimization to find the least penalty for each time step may be the reason why the WRYM gives totally slightly higher satisfaction levels than the two other
20
models, as seen by Table 8. On the other hand, the simpler allocation algorithm used in the WAFLEX model, basically upstream to downstream for each water use type, may be more close to how water is actually allocated in reality in the river basins. It may therefore be more close to the actual future satisfaction levels taking into account human’s inability to operate a whole river system optimally. The WAFLEX and the
25
WEAP21 also have an advantage in being more transparent and user friendly com-pared to the WRYM.
The use of all three models, however, demands thorough understanding of system analysis. The experience of applying the three models to the Umbeluzi River is that
HESSD
5, 475–509, 2008
Water sharing in transboundary water
resources systems
D. Ju´ızo and R. Lid ´en
Title Page Abstract Introduction Conclusions References Tables Figures ◭ ◮ ◭ ◮ Back Close
Full Screen / Esc
Printer-friendly Version
Interactive Discussion mistakes are easily made when the individual penalties and priorities are set. Neither of
the models have any quality assurance module, which means that it is up to the model user’s experience and knowledge to identify errors and judge the reasonability of the model results. The application of the three system analysis models to the Umbeluzi River basin further showed that there is not one single solution for the water allocation.
5
Depending on the parameters set or the model used, different results can be obtained as seen in Table 7. None of these results can be said to be more correct than the other.
5 Conclusions
In this study we have investigated the implications of applying three different system analysis models for water allocation in an international river basin. The results show
10
that the three models, WRYM, WAFLEX and WEAP21, all are adequate tools for sys-tem analysis of river basins in southern Africa, although the structure and complexity of the models are different. The obtained level of satisfaction for specific water users could, however, vary depending on which model was used, which causes uncertainties if an individual model is applied directly for studying the feasibility of water
demand-15
ing development. The reason for the diverse results is the structurally different ways of describing allocation and prioritization of water in the three models. However, the large degrees of freedom in all system models cause even larger uncertainty in the results since the model user can, intentionally or unintentionally, direct the results to favor certain water users. These uncertainties are often unknown for the stakeholders
20
and policy makers, who use the results of the system analysis models to plan future water allocation.
The water allocation in Umbeluzi River for future development scenarios is faced with considerable difficulties as the future demands can not be fully met even with an increase in reservoir storages. This study shows that planning of future water allocation
25
in this transboundary river is difficult through straightforward application of system anal-ysis models. Prior to modeling, the main stakeholders have to agree on the specific
HESSD
5, 475–509, 2008
Water sharing in transboundary water
resources systems
D. Ju´ızo and R. Lid ´en
Title Page Abstract Introduction Conclusions References Tables Figures ◭ ◮ ◭ ◮ Back Close
Full Screen / Esc
Printer-friendly Version
Interactive Discussion allocation principles and the modeling procedure to apply for the specific river basin
in question. General principles such as the SADC protocol are not sufficient basis for the system analysis. To enable joint agreement on the principles to apply and to quality assure the results, significant capacity of system analysis must exist among the main stakeholders. Furthermore, transparency of the system analysis modeling is a
5
key for the joint acceptance of the results. Alternatively, trust must be built between the stakeholders and the system analysis model users, something that is difficult in transboundary river basins.
This study illustrates the possibility for the introduction of other modeling packages for water resources allocation in transboundary rivers in southern Africa beyond the
10
WRYM, which has been adopted as the preferred tool but has been questioned be-cause of its complexity and limited transparency. For complex river basin systems the WRYM model most probably is the best tool but in many cases the WAFLEX and WEAP21 may be good alternatives. The advantage of these models compared to the WRYM is that they are relatively user friendly and transparent.
15
The conclusion of this study is that the choice of model does not per se affect the decision of best water allocation and infrastructure layout of a shared river basin. The chosen allocation and prioritization principles for the specific river basin and the model user’s experience and integrity are more important factors to find the optimal and equi-table allocation. This has to be realized by stakeholders and policy makers in order to
20
improve the water resources planning and allocation in transboundary rivers in south-ern Africa. This study also shows the importance of river basin conceptualization as a key element in preparation for allocation.
Acknowledgements. This work received financial support from SIDA-SAREC. The authors are
thankful to all those who provided data for this research. We also wish to thank SEI for providing
25
HESSD
5, 475–509, 2008
Water sharing in transboundary water
resources systems
D. Ju´ızo and R. Lid ´en
Title Page Abstract Introduction Conclusions References Tables Figures ◭ ◮ ◭ ◮ Back Close
Full Screen / Esc
Printer-friendly Version
Interactive Discussion References
Carmo Vaz, A. and Van der Zaag, P.: Sharing the Incomati waters: co-operation
and competition in the balance: From potential conflict to co-operation potential,
UNESCO/IHP/WWAP/IHP-VI/ Technical Documents in Hydrology/ PC-CP Series/ n. 14, 2003.
5
Chapman, R. A., Manders, P. T., Scholes, R. J., and Bosch, J. M: Who should get the wa-ter?, Decision support for water resource management, Water Sci. Technol., 32(5–6), 37–43, 1995.
Consultec and BKS Acres: Joint Inkomati Basin Study: Phase 2, Tripartite Permanent Technical Committee, Kingdom of Swaziland – Republic of Mozambique – Republic of South Africa,
10
2000.
De Groot, R. and Oosterwijk, W.: Water Resources Study of the Maputo River Basin: Creating a water resources yield model for the Maputo river basin, M. Sc. report, Delft University of Technology (TU-Delft), Delft, The Netherlands, 2006.
Dent, M.: Installed water resource modelling systems for catchment management agencies,
15
Water SA, 27(3), 333–340, 2001.
Draper , A. J. and Lund, J. R.: Optimal Hedging and Carryover Storage Value, J. Water Res. Pl.-ASCE, 130(1), 83–87, 2004.
Grossmann, W., Guariso, G., Hitz, M. and Wethner, H.: A Min Cost Solution for Dynamic Assignment Problems in Networks with Storage Devices, Manage. Sci., 41(1), 83–93, 1995.
20
Joyce, B., Vacu ˜na, S., Dale, L., Hanemann, M., Purkey, D., and Yates, D.: Climate change im-pacts on water for agriculture in California: A case study in the Sacramento Valley, California Climate Change Center, White Paper, CEC-500-2005-194-SF, California, USA, 2006. Juizo, D., Lid ´en, R., and Carmo Vaz, A.: Remaining Challenges for bi-national agreements on
shared water: The Umbeluzi case, Water Policy Journal, 8, 231–253, 2006.
25
Le Roy, E.: A study of the development of water resources in the Olifants catchment, South Africa: Application of the WEAP model, M. Sc. report, Imperial College, London, 2005. L ´evite, H. and Sally, H: Linkages between Productivity and equitable allocation of water, Phys.
Chem. Earth, 27, 825–830, 2002.
Mackenzie, R. S. and Van Rooyen, P. G.: Water Resources Yield Model : User Guide – Release
30
HESSD
5, 475–509, 2008
Water sharing in transboundary water
resources systems
D. Ju´ızo and R. Lid ´en
Title Page Abstract Introduction Conclusions References Tables Figures ◭ ◮ ◭ ◮ Back Close
Full Screen / Esc
Printer-friendly Version
Interactive Discussion
Mackenzie, R. S. and Van Rooyen, P. G.: Management large water resources systems,
un-published, available at: www.liemberger.cc/downloads/publicationsfiles/mckenzie%203.pdf,
2003.
Raju, K. S. and Pillai, C. R. S.: Multicriterion decision making in river basin planning and development, Eur. J. Oper. Res., 112, 249–257, 1999.
5
Rosenzweig, C., Strzepek, K. M., Major, D. C., Iglesias, A., Yates, D. N., McCluskey, A., and Hillel, A.: Water resources for agriculture in a changing climate: international case studies, Global Environ. Chang., 14, 345–360, 2004.
SADC: Revised Protocol on Shared Watercourses in the Southern African Development Com-munity (SADC), 2000.
10
Savenije, H. H. G.: Spreadsheets: Flexible tools for integrated management of water resources in river basins, IAHS Publications, 231, 741–744, 1995.
Sengo, D. J., Kachapila, A., van der Zaag, P., Mul, M., and Nkomo, S.: Valuing the environ-mental water pulses into the Incomati estuary: Key to achieving equitable and sustainable utilisation of transboundary waters, Phys. Chem. Earth, 30, 648–657, 2005.
15
Sieber, J., Huber-Lee, A., and Raskin, P.: WEAP: Water Evaluation And Planning System User Guide (for WEAP21), Stockholm Environmental Institute – Boston, and Tellus Institute, User Guide for WEAP21, Boston, MA, 2002.
SWECO in association with Consultec Lda, Impacto Lda, BKS, Knight Pi ´esold: Joint Umbeluzi River Basin Study: Final Report, Report prepared for the Government of the Republic of
20
Mozambique and the Government of the Kingdom of Swaziland, 2005.
Symphorian, G. R., Madamombe, E., and Van der Zaag, P.: Dam operation for environmental water releases; the case of Osborn Dam, Save Catchment, Zimbabwe, Phys. Chem. Earth, 28, 985–993, 2003.
Van der Zaag, P. and Bolding, A.: Water governance in the Pungwe river basin: institutional
lim-25
its to the upscaling of hydraulic infrastructure, abstract no. 9, Paper prepared for the session “Transboundary water governance: Issues learned in the Southern Africa” of the 6th Open Meeting of the Human Dimensions of Global Environmental Change Research Community, 12 October 2005, University of Bonn, Bonn, 2005.
Wang, L. F. and Hipel, W. K.: Cooperative water resources allocation based on equitable rights,
30
Proceedings of the 2003 IEEE International Conference on Systems, Man and Cybernetics, 5–8 October, Washington, USA, 2003.
HESSD
5, 475–509, 2008
Water sharing in transboundary water
resources systems
D. Ju´ızo and R. Lid ´en
Title Page Abstract Introduction Conclusions References Tables Figures ◭ ◮ ◭ ◮ Back Close
Full Screen / Esc
Printer-friendly Version
Interactive Discussion
Wurb, R. A.: Modeling river/reservoir system management, water allocation, and supply relia-bility, J. Hydrol., 300, 100–113, 2005.
Yates, D., Siber, J., Purkey, D., and Huber-Lee, A.: WEAP21-A Demand-, Priority-, and Preference-Driven Water Planning Model Part1: model characteristics, Water Int., 30(4), 487–500, 2005.
HESSD
5, 475–509, 2008
Water sharing in transboundary water
resources systems
D. Ju´ızo and R. Lid ´en
Title Page Abstract Introduction Conclusions References Tables Figures ◭ ◮ ◭ ◮ Back Close
Full Screen / Esc
Printer-friendly Version
Interactive Discussion
Table 1. Water Demands in Umbeluzi River (MCM/yr) Source: SWECO & Associates (2005)
Swaziland Mozambique 2005 2025 2005 2025 Irrigation 229 292 17 39 Urban 12 21 75 182 Other 12 21 5 32 Total 253 334 97 252
HESSD
5, 475–509, 2008
Water sharing in transboundary water
resources systems
D. Ju´ızo and R. Lid ´en
Title Page Abstract Introduction Conclusions References Tables Figures ◭ ◮ ◭ ◮ Back Close
Full Screen / Esc
Printer-friendly Version
Interactive Discussion
Table 2. Example of reservoir zones and penalty structure in the WRYM. Source: WRYM User
Guide – 4.1.1.
Storage Penalty Elevation
1000 100% 1548.96 2 90% 1547.99 20 0% 1533.00 10 000 Bottom 1521.95
HESSD
5, 475–509, 2008
Water sharing in transboundary water
resources systems
D. Ju´ızo and R. Lid ´en
Title Page Abstract Introduction Conclusions References Tables Figures ◭ ◮ ◭ ◮ Back Close
Full Screen / Esc
Printer-friendly Version
Interactive Discussion
Table 3. Example of link penalty in the WRYM. Source: WRYM User Guide – 4.1.1.
Range of flow Penalty
0 to TD 250
TD 0
HESSD
5, 475–509, 2008
Water sharing in transboundary water
resources systems
D. Ju´ızo and R. Lid ´en
Title Page Abstract Introduction Conclusions References Tables Figures ◭ ◮ ◭ ◮ Back Close
Full Screen / Esc
Printer-friendly Version
Interactive Discussion
Table 4. Summarized comparison of the three system analysis models used in the study. All
models run on a monthly time step.
Model Allocation methodology Optimization methodology User friendliness Transparency WRYM Minimizes system penalty
based on penalties per unit water set for releases from reservoirs and for failing to meet minimum flow require-ments or demands.
Higher penalties are given for failing to meet prioritized wa-ter use. Different penalties for same user type can be given.
A numerical optimization routine is run for each time step
Software available at DWAF, South Africa.
Difficult to use with-out thorough train-ing.
Because of the complex penalty structures and system optimization rou-tine transparency is lim-ited.
WAFLEX Releases from reservoirs are reduced according to storage rates.
When released, as a base rule: first comes, first served. However, possibilities to in-clude routines to prioritize types of water uses.
No optimization Uses Excel spread-sheets.
Lecture notes on the development of the models are available from IHE-Delft.
Easy to use.
For basic use the spreadsheet method-ology makes it trans-parent. However, if special Macro functions are applied it limits transparency.
WEAP21 Priorities are set for which reservoirs to draw water from. Amount of water for releases is reduced depending on stor-age situation allowing for ra-tioning in times of deficit. When released allocation downstream is made accord-ing to given priorities for each type of water use.
For equal priorities upstream users are provided first.
No optimization GIS based interface which gives good overview of the river system.
Software available from SEI webpage. Easy to use.
Fairly transparent through its GIS inter-face and straight forward priority system.
HESSD
5, 475–509, 2008
Water sharing in transboundary water
resources systems
D. Ju´ızo and R. Lid ´en
Title Page Abstract Introduction Conclusions References Tables Figures ◭ ◮ ◭ ◮ Back Close
Full Screen / Esc
Printer-friendly Version
Interactive Discussion
Table 5. Configuration used for the three system models applied for the Umbeluzi River basin.
PQL=Pequenos Libombos, IFR=Instream Flow Requirements, EFR=Estuarine Flow Require-ments.
WRYM WAFLEX WEAP21
Reservoir Penalties for failing Penalties for failing Allocation Allocation Allocation Dam User priorities in User priorities in penalties for to meet demand to meet min channel priorities priorities priorities priorities Swaziland Mozambique
working flows downstream downstream downstream PQL
storage Hawane Mnjoli
Hawane 40 Water supply 350 Border flow 400 IFR 1 IFR 1 IFR 1 Hawane 2 Water supply 1 Water supply 5 Mnjoli 10 Industry 340 Releases from Water supply 2 Irrigation 2 Water supply 2 Mnjoli 4 IFR 1 IFR 5 PQL 30 Livestock 300 Hawane 250 Water supply 3 Irrigation 2 PQL 9 Industry 3 Industry 6 MBF 30 Large-scale Releases from Industry 4 Industry 4 MBF 5 Livestock 3 Livestock 6 Isilele 10 Irrigation 400 Mnjoli 250 Livestock 5 Isilele 5 Irrigation 4 Irrigation 7
Farm Dam 10 Small-scale Releases from Farm Dam 5
Movene 20 Irrigation 100 PQL 250 Movene 10
EFR 250 Afforestation 400
HESSD
5, 475–509, 2008
Water sharing in transboundary water
resources systems
D. Ju´ızo and R. Lid ´en
Title Page Abstract Introduction Conclusions References Tables Figures ◭ ◮ ◭ ◮ Back Close
Full Screen / Esc
Printer-friendly Version
Interactive Discussion
Table 6. Scenario development for Umbeluzi river basin.
Scenario Description Comment
1 • 2005 for all users demands including environmental Assessment of current situation. requirements;
• 2005 infrastructure (Dams at Hawane, Mnjoli and Pequenos Libombos).
3 • 2025 demand for all users including environmental Impact of additional infrastructure requirements; in meeting future demands. • Additional infrastructure, dams at Mbuluzi Falls,
Isilele and Movene.
4 • 2005 irrigation demand in both countries; The existing IncoMaputo Agreement • 2005 industrial demand Maputo proposes that countries should reorient • 2025 demand for domestic water supply. there high demand uses to other system • Environmental requirements; with available water. In this scenario • Additional infrastructure, dams at Mbuluzi Falls, system performance is tested for Isilele and Movene. increased demands except for
irrigation that is assumed to be developed in the Maputo River basin.
HESSD
5, 475–509, 2008
Water sharing in transboundary water
resources systems
D. Ju´ızo and R. Lid ´en
Title Page Abstract Introduction Conclusions References Tables Figures ◭ ◮ ◭ ◮ Back Close
Full Screen / Esc
Printer-friendly Version
Interactive Discussion
Table 7. Level of satisfaction for the main users.
WRYM WAFLEX WEAP21
SCENARIO 1 (2005 demand level)
Mbabane water supply 100% 99% 98%
Large-scale irrigation Swaziland 100% 95% 99%
Small-scale irrigation Mozambique 97% 94% 97%
Maputo water supply 99% 97% 98%
SCENARIO 3 (2025 demand level, new infrastructure)
Mbabane water supply 98% 100% 100%
Large-scale irrigation Swaziland 88% 86% 88%
Small-scale irrigation Mozambique 48% 41% 47%
Maputo water supply 69% 69% 68%
SCENARIO 4 (2005 demand for irrigation, 2025 demand for water supply)
Mbabane water supply 100% 100% 98%
Large-scale irrigation Swaziland 88% 89% 88%
Small-scale irrigation Mozambique 70% 57% 62%
HESSD
5, 475–509, 2008
Water sharing in transboundary water
resources systems
D. Ju´ızo and R. Lid ´en
Title Page Abstract Introduction Conclusions References Tables Figures ◭ ◮ ◭ ◮ Back Close
Full Screen / Esc
Printer-friendly Version
Interactive Discussion
Table 8. Total level of satisfaction for all users in the Umbeluzi River.
WRYM WAFLEX WEAP21
SCENARIO 1 99% 97% 99%
SCENARIO 3 84% 79% 79%
HESSD
5, 475–509, 2008
Water sharing in transboundary water
resources systems
D. Ju´ızo and R. Lid ´en
Title Page Abstract Introduction Conclusions References Tables Figures ◭ ◮ ◭ ◮ Back Close
Full Screen / Esc
Printer-friendly Version
Interactive Discussion
Figure 1
HESSD
5, 475–509, 2008
Water sharing in transboundary water
resources systems
D. Ju´ızo and R. Lid ´en
Title Page Abstract Introduction Conclusions References Tables Figures ◭ ◮ ◭ ◮ Back Close
Full Screen / Esc
Printer-friendly Version Interactive Discussion Subbasin U13 Pequenos Libombos E10 Toestuary
Subbasin U10 Subbasin U11
GS20 Umbeluzi Subbasin U02-04 GS4 Subbasin U01 GS10 Subbasin U07 White Mbuluzi Black Mbuluzi Black Mbuluzi
UMBELUZI RIVER
WATER RESOURCES SYSTEM
MOZAMBIQUE SWAZILAND GS3 Subbasin U05 Mjoli Water supply Mbabane Sugar Cane Factory Large-scale Sugar Cane Irrigation
Subbasin U06 Subbasin U08-09 GS32 Subbasin U12 E395 Movene Dam site Subbasin U15 E12 Subbasin U14 E14 Subbasin U17 Subbasin U16 Maputo Water supply Return flows Farm dams Farm dams Release Small-scale farming Small-scale farming Small-scale farming Small-scale farming Small-scale farming Hawane Black Mbuluzi Release Spill Spill Legend Subcatchment Reservoir Irrigation scheme River flow Water outtake Runoff station Border Movene
Figure 2 Simplified Umbeluzi River basin system model schematic
HESSD
5, 475–509, 2008
Water sharing in transboundary water
resources systems
D. Ju´ızo and R. Lid ´en
Title Page Abstract Introduction Conclusions References Tables Figures ◭ ◮ ◭ ◮ Back Close
Full Screen / Esc
Printer-friendly Version
Interactive Discussion Hydrological
rainfall/runoff model
Rainfall Data & Calibration parameters
Historical development & Observed flow for calibration
Naturalized or virgin runoff Rainfall and evaporation reservoir data Dam and river characteristics Water use scenarios Environmental flow requirements
System Analysis Model
Agreements/Conventions/ Law allocation strategies
Water balances Dam storage trajectory System Yield Flow regime compliance Environmental requirements met?
User satisfaction
B A
Fig. 3. Modeling for water resources allocation in international rivers. A and B denote the two
HESSD
5, 475–509, 2008
Water sharing in transboundary water
resources systems
D. Ju´ızo and R. Lid ´en
Title Page Abstract Introduction Conclusions References Tables Figures ◭ ◮ ◭ ◮ Back Close
Full Screen / Esc
Printer-friendly Version Interactive Discussion A B D A M W A L L C D A B D A M W A L L C D FRC URC DSC
HESSD
5, 475–509, 2008
Water sharing in transboundary water
resources systems
D. Ju´ızo and R. Lid ´en
Title Page Abstract Introduction Conclusions References Tables Figures ◭ ◮ ◭ ◮ Back Close
Full Screen / Esc
Printer-friendly Version Interactive Discussion 0 50 100 150 200 0 48 96 144 192 240 288 336 384 432 480 528 576 624 672 720 768 816 864 S to re d v o lu m e timestep (months) Mnjoli Dam
WAFLEX WRYM WEAP21
m ill io n ( m 3 )
Fig. 5. Model performance for Mnjoli dam operation for Scenario 3. Reservoir trajectory during