HAL Id: hal-00298644
https://hal.archives-ouvertes.fr/hal-00298644
Submitted on 19 May 2005
HAL is a multi-disciplinary open access
archive for the deposit and dissemination of sci-entific research documents, whether they are pub-lished or not. The documents may come from teaching and research institutions in France or abroad, or from public or private research centers.
L’archive ouverte pluridisciplinaire HAL, est destinée au dépôt et à la diffusion de documents scientifiques de niveau recherche, publiés ou non, émanant des établissements d’enseignement et de recherche français ou étrangers, des laboratoires publics ou privés.
Phreatic surface fluctuations within the tropical
floodplain paddy field of the Yom River, Thailand
S. Chuenchooklin, T. Ichikawa, S. Patamatamkul, V. Sriboonlue, C.
Kerdpitaksa
To cite this version:
S. Chuenchooklin, T. Ichikawa, S. Patamatamkul, V. Sriboonlue, C. Kerdpitaksa. Phreatic sur-face fluctuations within the tropical floodplain paddy field of the Yom River, Thailand. Hydrology and Earth System Sciences Discussions, European Geosciences Union, 2005, 2 (3), pp.731-760. �hal-00298644�
HESSD
2, 731–760, 2005 Phreatic surface fluctuations within the tropical floodplain S. Chuenchooklin et al. Title Page Abstract Introduction Conclusions References Tables Figures J I J I Back CloseFull Screen / Esc
Print Version
Interactive Discussion
EGU Hydrol. Earth Sys. Sci. Discuss., 2, 731–760, 2005
www.copernicus.org/EGU/hess/hessd/2/731/ SRef-ID: 1812-2116/hessd/2005-2-731 European Geosciences Union
Hydrology and Earth System Sciences Discussions
Papers published in Hydrology and Earth System Sciences Discussions are under open-access review for the journal Hydrology and Earth System Sciences
Phreatic surface fluctuations within the
tropical floodplain paddy field of the Yom
River, Thailand
S. Chuenchooklin1, T. Ichikawa2, S. Patamatamkul3, V. Sriboonlue3, and C. Kerdpitaksa4
1
Graduate School Khon Kaen University, Khon Kaen, 40002, Thailand
2
School of Engineering, Kyushu Tokai University, Toroku, Kumamoto, Japan
3
Faculty of Engineering, Khon Kaen University, Khon Kaen, 40002, Thailand
4
Faculty of Engineering, Kasetsart University, Bangkok, 10900, Thailand Received: 11 March 2005 – Accepted: 20 April 2005 – Published: 19 May 2005 Correspondence to: S. Chuenchooklin ([email protected])
© 2005 Author(s). This work is licensed under a Creative Commons License.
HESSD
2, 731–760, 2005 Phreatic surface fluctuations within the tropical floodplain S. Chuenchooklin et al. Title Page Abstract Introduction Conclusions References Tables Figures J I J I Back CloseFull Screen / Esc
Print Version
Interactive Discussion
EGU
Abstract
The fluctuation of phreatic surfaces in tropical floodplain was studied for the lower part of the Yom’s river basin at Phichit Province in Thailand. The simple water balance budget model was applied to estimate the groundwater recharge. The hydrologic com-ponents i.e. average rainfall, surface runoff, and deep percolation were calculated by
5
using climatologically recorded and measured data. The Penman-Monteith’s evapo-transpiration method was used to estimate potential evapoevapo-transpiration for crop water requirement based on climatic data. The 49-points of field infiltration and theirs distri-bution over the floodplain were measured using ring-infiltrometers. The surface water and phreatic surface deviations from the existing 22-observation wells nearby the Yom
10
River daily observed continuously for 3 years. The observed river water levels and phreatic surface water levels were agreed very well with R2 approx. 0.90. The rising or recessing of those fluctuations was depended on the inundated depth over flood-plain or the amount of groundwater withdrawal for crop consuming. Understanding and quantifying the phreatic surface fluctuations in lowland paddy field is crucial for further
15
floodplain management.
1. Introduction
In a large floodplain area of a large river in tropical-monsoon zone with high intense rainfall during rainy season, its hydrological parameters and components are difficult to determine due to complex physical conditions. Usually, flood occurs when there is
20
too much water over specific area by rainwater, additional flow entering from adjacent upstream area, and overbank flow from the river itself. The period of inundation will be based on floodplain morphology, and hydrogeological characteristics. Moreover, the great amount of withdrawal of both surface and subsurface waters for crop consuming especially paddy in floodplain will affect the change of phreatic surfaces. Those
phys-25
HESSD
2, 731–760, 2005 Phreatic surface fluctuations within the tropical floodplain S. Chuenchooklin et al. Title Page Abstract Introduction Conclusions References Tables Figures J I J I Back CloseFull Screen / Esc
Print Version
Interactive Discussion
EGU from the field. The infiltration which is one of the major hydrologic components of
wa-ter penetrating from the ground surface into the soil that might percolates contribute, further and to groundwater storage, observations should be investigated using field ex-periments. It is an indicator that can be used to estimate potential loss by mean of soil hydraulic conductivity if a long period of time of the field measurement was undertaken.
5
The relationship of penetrated water and testing period can be fitted using the simplest Kostiakov’s model (Chow et al., 1988). The most common model for estimation of parameters is the water budget model.
This paper aims to contribute to the hydrological knowledge of a river reach within a tropical floodplain, particularly the relations between the surface water and the phreatic
10
surface of the river’s interconnecting aquifer.
2. Study area
A 3-year programmed of water table monitoring and supplementary experiments were undertaken from the years 2001 to 2004 at Phopratabchang District, a paddy field area was situated on floodplain of the Yom River in Phichit Province, Thailand (Fig. 1). The
15
lower part of the main river is occupied by an extensive alluvial plain which flood usually occurs in this part during the rainy season from July to September corresponding to monsoon and typhoons effects. It is the typical season characterized by a pronounced long rainy season and produces around 90% of the annual rainfall amount. Its average annual rainfall over the overall basin is 1434 mm, and rainy day equals 80 days. The
20
focused site covers an area of 153 km2 (inner zone in Fig. 1 and Fig. 2) lying on the west of the Yom River bounded by 3-local roads (no. 117 on the west, no. 1276 on the north, and no. 1070 on the south) and flood protection dikes (RID’s dike on the east) which was chosen to conduct investigation of gains and losses from flood and water table fluctuations. It was located in a larger basin (1698 km2) in Fig. 1 included
25
7 major catchments are namely Banglai, Dannoi, Huaipakwan, Lamnang, Rangnok, Saichanuanyai, and Thainam and 7 floodplain’s catchments along the Yom River which
HESSD
2, 731–760, 2005 Phreatic surface fluctuations within the tropical floodplain S. Chuenchooklin et al. Title Page Abstract Introduction Conclusions References Tables Figures J I J I Back CloseFull Screen / Esc
Print Version
Interactive Discussion
EGU was lying between 2 sites of observed river stages belonging RID (Royal Irrigation
Department) namely Y17 (Samngam) at upstream and Y5 (Phothale) at downstream with the river length between those 2 stages of 71 880 km.
The inundated area occupies by some 50% of the inner area (153 km2) in Fig. 3 which occurs by overbank flowing from the river and overland flow from upstream
catch-5
ment’s runoff (Fig. 2). Moreover, its topography is very flat with average ground surface level of+32.88 m above mean sea-level (MSL) and average slope of 0.000138. There are 3-local streams flowing through this area and connecting to the Yom river namely Phairob (catchment’s area of 74 km2), Nongkla (catchment’s area of 92 km2), and Dongsualuang (catchment’s area of 59 km2) with average stream slope of 0.000286.
10
The streams have regulated structures namely Dannoi, Saichanuanyai, and Lamnang near the river’s confluences, respectively.
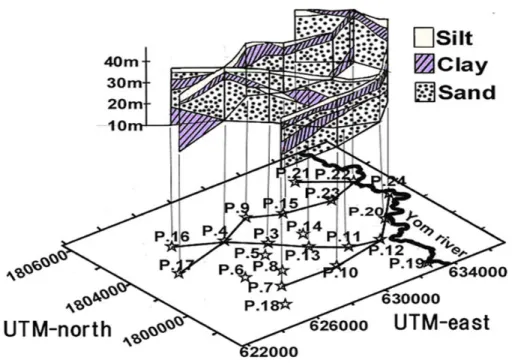
Its geomorphology conforms by shallow clay or silt at the ground surface as the top layer and thick sand layer as unconfined aquifer beneath the top soil (Fig. 3). The e ffec-tive porosity (ηe) of this aquifer was averaged to 0.083 (Mekpruksawong et al., 2004).
15
There were 22-observation wells (OW) ranged 15–30 m depth which was constructed by KTU (Kyushu Tokai University, Japan) and RID (Royal Irrigation Department) to monitor the change of phreatic surface levels (GWL) every 10 min. Some 15-OWs ly-ing on floodplain (50.414 km2) were namely P3, P7, P8, P9, P10, P11, P12, P13, P14, P15, P20, P21, P22, P23, and P24, respectively. Moreover, there was a river stage
20
(Dlog) lying at the right bank of the Yom river upstream of Phopratabchang Bridge in order to recorded the change of daily river water level (RWL).
High-yield-variety (HYV) paddy (86% of total area) was grown 2 times a year. There were many shallow groundwater wells drilled and groundwater is utilized as supple-mentary water requirement for crop. The cropping pattern is shown in Fig. 4.
HESSD
2, 731–760, 2005 Phreatic surface fluctuations within the tropical floodplain S. Chuenchooklin et al. Title Page Abstract Introduction Conclusions References Tables Figures J I J I Back CloseFull Screen / Esc
Print Version
Interactive Discussion
EGU
3. Material and methods
3.1. Topographical map and conceptual model
Unfortunately, due to lack of topographical data, contour-lines were constructed based on available data which were collected from RID, Highway Department (HWD), Royal Thai Survey Department (RTSD), Department of Land Development (DLD), and
De-5
partment of Environmental Quality Promotion (DEQP) and geographic information sys-tems (GIS)’s maps with 1:50 000 scale. The existing ground surveyed was done dur-ing the construction of OWs. Moreover, the inundated mappdur-ing was sketched usdur-ing aerial and satellite imaging maps which used to verify those contour-lines. The re-lations among inundated extents versus pool levels were plotted which used to
esti-10
mate daily flooded storage changed. This paper applied Arc-View’s GIS and surface programs as the tools for plotting those contour-lines and flood extensive over flood-plain. The conceptual blocks model was applied using Thiessen’s polygon for drawing each OW’s serviced area (Fig. 5) which were used for infiltration and phreactic surface changes estimation by applying the water budgeting equations. The overall floodplain
15
area (50.414 km2) was bounded by surrounding roads with the average ground surface elevation of 32.88 m (MSL). Most land-uses in this area is paddy (89.6%), others were residential areas included upland crop and orchard (7.4%), and water body and bare land (3.0%).
3.2. Model description and existing parameters
20
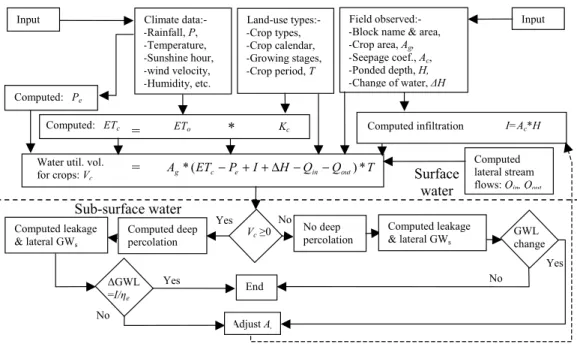
The water budget model for studying surface and subsurface waters over the consid-ered floodplain was applied (Fig. 6). The losses by infiltration (I) and evapotranspiration (ET ), and inundated extensive over the catchment’s area were models within 3 cate-gories: 1) non-flooded (upland), 2) semi-flooded, and 3) fully flooded (lowland). Firstly, if the value of effective rainfall (Pe) was less than the amount of infiltration capacity
dur-25
ing the same period of time, then there was no flood occurred and upper soil surface 735
HESSD
2, 731–760, 2005 Phreatic surface fluctuations within the tropical floodplain S. Chuenchooklin et al. Title Page Abstract Introduction Conclusions References Tables Figures J I J I Back CloseFull Screen / Esc
Print Version
Interactive Discussion
EGU would be unsaturated. The actual infiltrating water would be equaled to such effective
rainfall value and would be flown downward as gaining as raising water table in such considered block. Secondly, in case of continuing rainfall and infiltration with less than the amount of effective rainfall, then flood extensive would be occurred over the consid-ered block. For both cases, the daily river water stage in the Yom River was less than
5
the ground surface elevation (upland). Thirdly, if the river water level (RWL) was higher than ground surface elevation and the riverbank or levee (floodplain), flood discharge could be estimated as the flow over broad crested weir. The flood extensive would be occurred on a consequence of the RWL. The actual potential infiltration capacity could be the rate of final infiltration value that nearly equaled to the rate of hydraulic
conduc-10
tivity (K ) because of ground surface was saturated. The keeping water depth in paddy field in each block during growing season was averaged by 0.05 m with 0.02–0.08 m in variant. However, during wet season and flood period, depth of water above ground was varied and ranged from 0.2 to 3.0 m. The amount of infiltration would be varied by head of water according to Darcy’s Law as the rate of seepage.
15
In case of none flooded (Fig. 7), the continuity equation for the hydrological pro-cesses measured over a certain period of time (t) will be budgeted as:
I= (P − ET ) + (Qi n− Qout) −∆S (1) P-ET can be considered as effective rainfall volume (Pe). Whereas Qi n is the total volume of upstream runoff water from every lateral streams and over-bank flow from the
20
river, Qoutis the total volume of runoff water flow out from the considered downstream boundary through the regulators at the end of lateral streams, I is the infiltration or seepage volume, and∆S is the change of storage volume. The stream discharges via those regulated structures will be considered as the flow volume via their channels.
For the case of flooded, it is assumed that there is no any plant grown in such period,
25
and then ET can be considered as existing evaporation (E ). The extra-inflow (Qi n) can be computed as the discharge across the levee or roads along the river.
The total amount of infiltrated water from surface to subsurface of the 3-cases over the year will be recharged to the unconfined aquifer and increased phreatic surface
HESSD
2, 731–760, 2005 Phreatic surface fluctuations within the tropical floodplain S. Chuenchooklin et al. Title Page Abstract Introduction Conclusions References Tables Figures J I J I Back CloseFull Screen / Esc
Print Version
Interactive Discussion
EGU level during inundated period. However, during growing season, if rainfall is less than
crop water requirement withdrawal of groundwater from shallow wells will be occurred which affects the recessing of phreatic surface levels.
The first parameter, P , was the weighted values from actual daily rainfall amount at every rain gauge which was estimated by the Thiessen polygons method which located
5
at the districts namely Phichit, Samngam, Saingam, Phopratabchang, Phothale, and Kanuworalaksaburi. There was an automatically rain gauge with 5-min time interval recorded and located at Neonkwang School (P3) in the middle part of the inner zone. It was used for the study of rainfall intensity-duration-frequency and surface runoff over the catchments.
10
To estimate crop water requirement (ETc), the FAO’s potential evapotranspiration (ETo) using combined Penman-Monteith’s (P-M) equation (Doorenbos et al., 1977) was applied. Whereas all parameters for this equation were applied by using stan-dard climatologically data recorded by the MD (Thai Meteorological Department) at the Phichit Agricultural Research Station in Phichit Province. Those included daily solar
ra-15
diation (sunshine hour), air temperature (maximum and minimum), humidity and wind speed data. Then ETc for each kind of crop during growing season in none flooded catchments could be estimated as ETo multiplied by crop coefficients (Kc) at each growing stages which assumed to be the amount of groundwater consumed.
The loss from surface water was considered as flux over the catchments (I) getting
20
from field infiltration experiment using ring-infiltrometer and fitted by empirical Kosti-akov’s infiltration model. The accumulated depth into the soil (D) versus recording times (t) would be equaled to the amount of infiltrated water (F ). However, during the saturated condition or longer time of infiltration has been taken, F can be replaced by saturated hydraulic conductivity (K ) [mm/d] varied by head. The seepage coefficient
25
(Ac) [mm/d/m] was introduced as the rate of infiltrated per head of ponded water above the ground surface (Mekpruksawong et al., 2004).
Ac = K/H (2)
The results of field infiltration would be weighed by Thiessen Polygon’s area of each 737
HESSD
2, 731–760, 2005 Phreatic surface fluctuations within the tropical floodplain S. Chuenchooklin et al. Title Page Abstract Introduction Conclusions References Tables Figures J I J I Back CloseFull Screen / Esc
Print Version
Interactive Discussion
EGU observation well to represent the spatially distribution of fluxes and Ac over the
catch-ment’s area.
To estimate lateral inflow (Qi n) from upstream sub-catchments entering the inner zone, the method of ungauged basin with lack of rainfall and stream flow data was applied using the neighboring catchment’s data of topographical and watershed
char-5
acteristics. The synthetic hydrograph using Snyder and US Army Corps of Engineers method (US.ACE, 1994; Chow et al., 1988) was applied to compute the peak discharge (qp) and the hygrograph shape. The basin characteristics including the stream length (L) [km], stream length measure from the centered of basin to outlet point (Lc) [km], average stream slope (S), catchment’s area (A) [km2], effective rainfall (Pe) [mm] and
10
Ct, Cp, a1, a2getting from those relationships in linear regression from the neighboring basins were applied to compute the peak discharge, lag-time from the duration of rain-fall to the peak discharge(tp) [h], and base time (tb). Therefore, lateral inflows (Qi n) and their hydrographs entering the inner zone could be sketched. However, the extra Qi nthat might be spilled out from the river across the levee or road along the river
en-15
tering the inner zone with length of 3.95 km and altitude of 33.58 m (MSL) during flood season. Qout as discharge via the open channel of the streams, road structures, and tail regulators was considered (Chow et al., 1988).
The area of flood extensive over the floodplain was studied according to daily river stage recorded at the middle reach of the Yom River (Dlog). Moreover, occasional field
20
water stage observation during flood period at the upstream boundary (Wangjik) along the main road (Rd.#1276) through the feeder roads and observation wells in the inner zone and down to the last section at downstream boundary (Phaitapho) along the other main road (Rd.#1070) was investigated and used to sketch the water surface profiles. Therefore, the relationship among flooded height above natural ground surface versus
25
inundated area and temporary flood storage would be fitted. Due to the limitation of the numbering of observation points in floodplain, the assumption of water surface level at every point along each cross sectional profiles would be the same value as the river water surface level (RWL). Therefore, flood flow patterns could be presented
HESSD
2, 731–760, 2005 Phreatic surface fluctuations within the tropical floodplain S. Chuenchooklin et al. Title Page Abstract Introduction Conclusions References Tables Figures J I J I Back CloseFull Screen / Esc
Print Version
Interactive Discussion
EGU at each return period of flood occurrences using the Gumbel’s distribution. Then the
inundated depth at any point along floodplain cross-section would be used as flux head in the infiltration model and used to study the change of phreatic surface level (GWL). Moreover, the standard-step method in the river hydraulic analysis’s HEC-RAS model (US.ACE, 2001) was applied during the first year that without the stage recorder at
5
Dlog yet. The cross-sectional profiles with average step length of 5–6 km which the upstream boundary water level at Y17 was used as initial condition and for computing stages along the Yom River at cross-sectional profiles, through the inner zone and down to the last section at Y5.
The change of phreatic surface levels in sub-surface water part (Fig. 7) would be
10
compared to the computed recharge over the effective porosity. The effects from lateral groundwater inflow (GWi n) and outflow (GWout) from adjacent blocks and leakage to the lower aquifer might affected the change of phreatic surfaces which could be further computed using Darcy’s equation based on the change of the slope of the water table between the blocks (Mekpruksawong et al., 2004).
15
4. Results and discussions
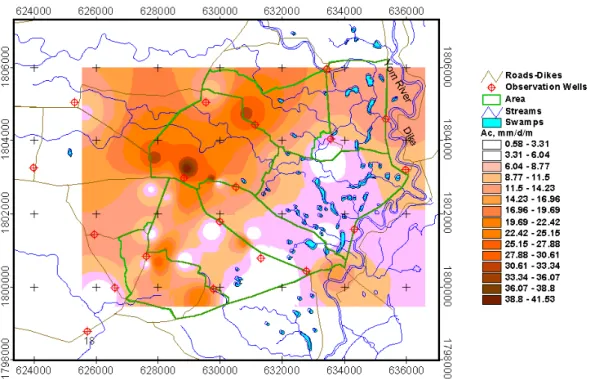
The summary of the configuration of 15-OW Thiessen blocks are namely P03, P07, P08, P09, P10, P11, P12, P13, P14, P15, P20, P21, P22, P23, and P24, and 49-field infiltration points (Fig. 5) were shown in Table 1. These included the serviced area (A) of each OW, ground elevation, F , Ac, K whereas the isohyets of field Ac before block
20
averaging was presented in Fig.8. The final infiltration (approx. K ) in the upstream basins connecting the inner zone (153 km2) was averaged to 9.386 and 3.375 mm/d for the first day and longer period (30 days) of ponded water, respectively. The average infiltration rate (Fav g) and time relationships in Kostiakov’s model was shown to be F = 9.386 t−0.3007 [mm/d] with R2 = 0.9947. The initial infiltration (F ), however, in
25
the inner zone (50.414 km2) was averaged 4.925 mm/d and the final infiltration in the floodplain zone was 1.355 mm/d (1.568×10⁻⁶cm/s) with Ac of 16.245 mm/d/m of head
HESSD
2, 731–760, 2005 Phreatic surface fluctuations within the tropical floodplain S. Chuenchooklin et al. Title Page Abstract Introduction Conclusions References Tables Figures J I J I Back CloseFull Screen / Esc
Print Version
Interactive Discussion
EGU of ponded water (Table 1).
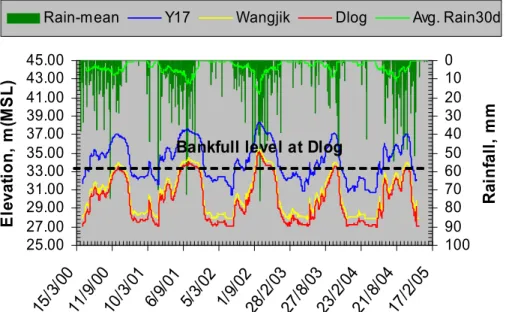
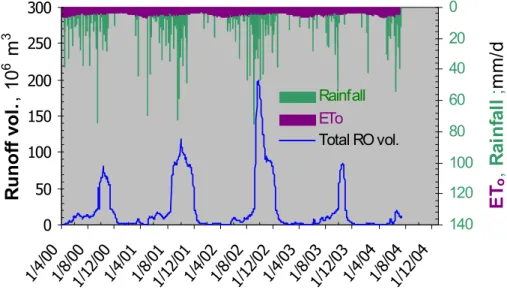
The 4-years daily data recorded of P and elevation of river water stage (Fig. 9) was shown that flood peak in 2001 was less than flood in 2002 which was highest peak. The comparison between P , ETo, F , and runoff in the inner zone from the upstream boundary at Wangjik via Dlog to the downstream boundary at Phaitapho
5
were presented in daily (Fig. 10) and annually (Fig. 11) with annual P of 1103.6 mm, ETo of 1515.8 mm, F at the upstream area of 723.1 mm (69.14% of annual rainfall), Qi nfrom upstream basins (225.137 km2) entering the inner zone of 634.2 mm (57.5% of annual rainfall. Whereas the mean daily of ETo, F were equaled to 4.15, 2.12 mm, respectively.
10
The average characteristics and results of Snyder’s synthetic unit hydrographs for 3-subbasins in the inner zone were; the average slope of 0.000286, unit discharge (qp) of 1.788 cu.m/s/mm, and lag time (tp) of 12.3 h, respectively. The local stream discharge was very small compare to the river and floodplain flow that will not affect the flood extent. However, it contributed and combined to the overbank flow from the Yom River
15
during inundated period.
The characteristic of flooded elevation, inundated extent, and temporary storage vol-ume between Wangjik to Phaitapho was presented (Fig. 12). The result of flood extent was used to draw flood flow patterns in Fig. 13 (Chuenchooklin et al., 2003) and com-parative of inundated extent in 3-years (Fig. 14). The comparison between RWL and
20
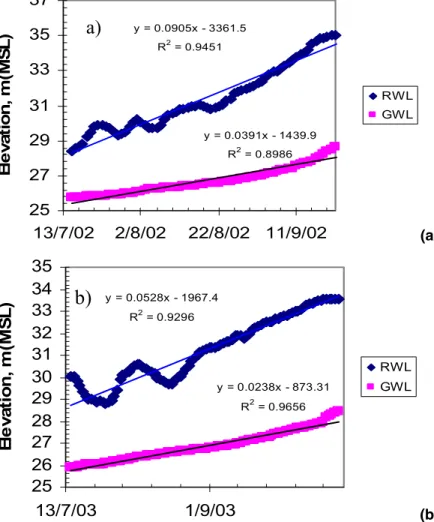
GWL was presented in Fig. 15 and Fig. 16. The lag-time between rising and reces-sion limbs of those hydrographs in the year 2002 and 2003 were 75 days and 105 days (during rising limb), and 10 days and 6 days (during recession limb), respectively. Those trend lines in Fig. 16 during rising and recession limbs were fitted with R2equal to 0.90 (Chuenchooklin et al., 2004). The difference on slope of those trend lines and
25
time delayed during rising and falling limbs were shown because of flood volume and ponded time in the year 2002 was more and longer than in the year 2003. However, the data of water table hydrographs of some OWs along the river e.g. P20, P22, and P24 were less affected by the change of river water levels.
HESSD
2, 731–760, 2005 Phreatic surface fluctuations within the tropical floodplain S. Chuenchooklin et al. Title Page Abstract Introduction Conclusions References Tables Figures J I J I Back CloseFull Screen / Esc
Print Version
Interactive Discussion
EGU The computation of recession constant (Krb) for baseflow separation into
ground-water flow (Krg) and interflow (Kri) during the years 2000–2003 were fitted average of 0.783 and 0.936, respectively and R2=0.9672. The amount of annual baseflow per total runoff via the measuring point was averaged to 0.107. However, during dry sea-son (January to May), there is no baseflow in the river because of the withdrawal for
5
crop and human consumption has been taken by farmers and communities using small pumping machines along the river. Therefore, the baseflow is decreasing as the result showed that the trend line of the minimum GWL in dry season (P7, P11, and P14) is slightly decreasing with the rate of 0.10 m per year (Fig. 15).
The simulation using water budget for each polygon showed that the averaged losses
10
rate from paddy field percolated to the uppermost aquifer layer was very high with 2650 m3/d/km2. Total annually infiltrated water was 26 million m3during inundated pe-riod (90 days) in year 2002 over floodplain paddy field area (50.414 km2) with about 5730 m3/d/km2. The averaged daily P-M’s ETo was 4.1 mm which produced the total potential loss by this phenomenon and for dry seasonal crop water requirement
com-15
puting of 34 million m3with about 75% of gross area.
5. Conclusions
From the study using water budget model, the distributions of infiltration fluxes over floodplain have a directly effect to the phreatic surfaces through flood extent over the land surface during inundated period. The daily flood storage and inundated area in
20
the study site could be estimated from the corresponding local lateral inflows, overflow from the bank-full level. The generated database from existing topographic contours and basin characteristics using GIS techniques coupling to hydrologic models could be applied to compute flood. Most of the floods were produced by overflowing from the riverbank because of total sub-catchments area were smaller than whole river basin
25
sizing. Flood risk map could be developed corresponding to hydrological statistics, and hydrodynamic model, should be extended to the local administration officers and
HESSD
2, 731–760, 2005 Phreatic surface fluctuations within the tropical floodplain S. Chuenchooklin et al. Title Page Abstract Introduction Conclusions References Tables Figures J I J I Back CloseFull Screen / Esc
Print Version
Interactive Discussion
EGU farmers in order to change or shift cropping pattern in floodplain for avoiding flood.
The main cause of inundated extent in this study area was over-bank flow from the river rather than the flow from surface runoff over its catchment’s area. The influences from inundated zone leaded to the increasing of phreatic surface too. If higher inun-dated depth by flood occurred then the slope-line of GWL on the rising limb would be
5
steeper than fewer floods which were already discussed on Fig. 15 and Fig. 16. On the other hand, the downward slope of trend line of GWL occurs which might be influenced by the greater amount of groundwater withdrawal than amount of flood recharging. The fluctuation of phreatic surface was mainly influenced by flooded recharge and ground-water withdrawal. For the conservation of phreatic surface in flooded zone, further
10
study about flood reduction through artificial recharge from the zone with high infil-tration flux e.g. farm-ponds and sandpits should be carried out. Understanding and quantifying the phreatic surface fluctuations in lowland paddy field is crucial for further floodplain management.
Acknowledgements. The authors wish to thank the following institutions for supporting this
15
research program: the Graduate School Khon Kaen University, Naresuan University, Kyushu Tokai University, King Mongkut Institute of Technology at Lardkrabang, and the Royal Irrigation Department.
References
Chow, V. T., Maidment, D. R., and Mays, L. W.: Applied Hydrology, McGraw-Hill International
20
Editions, 1988.
Chuenchooklin, S., Ichikawa, T., and Patamatamkul, S.: Flood flow pattern and distribution of infiltration over large floodplain and natural groundwater recharge area, Annual Journal of Hydraulic Engineering, JSCE, 47, 211–216, 2003.
Chuenchooklin, S., Ichikawa, T., and Patamatamkul, S.: The effect of flood changes on phreatic
25
surface in large floodplain in Phichit, Proceedings: 2nd APHW Conference, 5–8 July 2004, Singapore, Vol. 1, 32–42, 2004.
HESSD
2, 731–760, 2005 Phreatic surface fluctuations within the tropical floodplain S. Chuenchooklin et al. Title Page Abstract Introduction Conclusions References Tables Figures J I J I Back CloseFull Screen / Esc
Print Version
Interactive Discussion
EGU
Doorenbos, J. and Pruitt, W. O.: Guidelines for lease predicting crop water requirements, FAO Irrigation and Drainage Paper, Vol. 24, 1977.
Ichikawa, T., Mekpruksawong, P., Chuenchooklin, S., Aramaki, S., and Patamatamkul, S.: Groundwater and irrigation problem in flood Chaophraya river basin: in case of Phichit study area, Proceedings: 14th Asian agricultural symposium on environmental management for
5
resource conservation, 9–10 December 2004, Chiengmai, Thailand, 1, 83–99, 2004. Mekpruksawong, P., Ichikawa, T., Aramaki, S., and Yamada, T.: Hydrogeological condition and
groundwater behavior in low land, Thailand, J. Japan Soc. Hydrology & Water Resources, 17, 1, 32–42, 2004.
U.S. Army Corps of Engineers (US.ACE): Flood-Runoff Analysis, Engineering and design,
En-10
gineer Manual no. EM 1110-2-1417, 1994.
U.S. Army Corps of Engineers: HEC-RAS River analysis system: Hydraulics reference man-ual version 3.0, retrieved fromhttp://www.hec.usace.army.mil, Public distribution unlimited, 2001.
HESSD
2, 731–760, 2005 Phreatic surface fluctuations within the tropical floodplain S. Chuenchooklin et al. Title Page Abstract Introduction Conclusions References Tables Figures J I J I Back CloseFull Screen / Esc
Print Version
Interactive Discussion
EGU
Table 1. Summary of 15-observation well (OW)’s configuration resulted by Thiessen Polygon.
OW’s name A [km2] Elevation [m(MSL)] F [mm/d] Ac[mm/d/m] K [mm/d] P03 4.233 33.727 12.4275 30.988 2.1328 P07 0.623 33.675 0.0606 9.595 0.0033 P08 3.968 33.824 2.7883 10.941 0.6015 P09 3.350 34.074 0.8771 9.799 0.0372 P10 3.674 33.455 13.2486 14.555 4.8885 P11 3.704 33.160 3.9618 4.284 0.9247 P12 2.248 32.126 3.9296 37.661 0.7095 P13 3.182 33.546 3.4740 4.722 1.5381 P14 4.356 32.744 3.8949 51.089 0.9424 P15 4.825 32.570 7.6243 23.693 2.2082 P20 3.653 31.626 2.8464 4.698 1.6496 P21 2.814 32.198 9.6890 14.810 2.7641 P22 2.297 32.080 0.2869 6.303 0.0225 P23 5.922 32.166 0.9923 2.788 0.0415 P24 1.566 32.370 0.2869 6.303 0.0225
HESSD
2, 731–760, 2005 Phreatic surface fluctuations within the tropical floodplain S. Chuenchooklin et al. Title Page Abstract Introduction Conclusions References Tables Figures J I J I Back CloseFull Screen / Esc
Print Version
Interactive Discussion
EGU 2
The lower part of the main river is occupied by an
extensive alluvial plain which flood usually occurs in
this part during the rainy season from July to
September corresponding to monsoon and typhoons
effects. It is the typical season characterized by a
pronounced long rainy season and produces around
90% of the annual rainfall amount. Its average annual
rainfall over the overall basin is 1434 mm, and rainy
day equals 80 days. The focused site covers an area
of 153 km
2(inner zone in Fig. 1 and Fig. 2) lying on
the west of the Yom River bounded by 3-local roads
(no.117 on the west, no.1276 on the north, and
no.1070 on the south) and flood protection dikes
(RID’s dike on the east) which was chosen to conduct
investigation of gains and losses from flood and water
table fluctuations. It was located in a larger basin
(1698 km
2) in Fig. 1 included 7 major catchments are
namely Banglai, Dannoi, Huaipakwan, Lamnang,
Rangnok, Saichanuanyai, and Thainam and 7
floodplain’s catchments along the Yom River which
was lying between 2 sites of observed river stages
belonging RID (Royal Irrigation Department) namely
Y17 (Samngam) at upstream and Y5 (Phothale) at
downstream with the river length between those 2
stages of 71.880 km.
The inundated area occupies by some 50 % of the
inner area (153 km
2) in Fig. 3 which occurs by
overbank flowing from the river and overland flow
from upstream catchment’s runoff (Fig. 2). Moreover,
its topography is very flat with average ground
surface level of +32.88 m above mean sea-level
(MSL) and average slope of 0.000138. There are
3-local streams flowing through this area and
connecting to the Yom river namely Phairob
(catchment’s area of 74 km
2), Nongkla (catchment’s
area of 92 km
2), and Dongsualuang (catchment’s
area of 59 km
2) with average stream slope of
0.000286. The streams have regulated structures
namely Dannoi, Saichanuanyai, and Lamnang near
the river’s confluences, respectively.
Its geomorphology conforms by shallow clay or
silt at the ground surface as the top layer and thick
sand layer as unconfined aquifer beneath the top soil
(Fig. 3). The effective porosity (η
e) of this aquifer
was averaged to 0.083 (Mekpruksawong et al.,
2004). There were 22-observation wells (OW)
ranged 15-30 m depth which was constructed by
KTU (Kyushu Tokai University, Japan) and RID
(Royal Irrigation Department) to monitor the change
of phreatic surface levels (GWL) every 10 minutes.
Some 15-OWs lying on floodplain (50.414 km
2)
were namely P3, P7, P8, P9, P10, P11, P12, P13,
P14, P15, P20, P21, P22, P23, and P24, respectively.
Moreover, there was a river stage (Dlog) lying at the
right bank of the Yom river upstream of
Phopratabchang Bridge in order to recorded the
change of daily river water level (RWL).
High-yield-variety (HYV) paddy (86% of total
area) was grown 2 times a year. There were many
shallow groundwater wells drilled and groundwater
is utilized as supplementary water requirement for
crop. The cropping pattern is shown in Fig. 4.
Fig. 1. Location of study area, streams and catchment’s systems, inner zone, and river’s gauging stations.
Fig. 1. Location of study area, streams and catchment’s systems, inner zone, and river’s
gauging stations.
HESSD
2, 731–760, 2005 Phreatic surface fluctuations within the tropical floodplain S. Chuenchooklin et al. Title Page Abstract Introduction Conclusions References Tables Figures J I J I Back CloseFull Screen / Esc
Print Version
Interactive Discussion
EGU
3
Fig. 3. 3-D view of geological profiles resulted by soil log data interpreting from 22-observation wells (OW)’s construction in the inner zone (Mekpruksawong et al., 2004).
Fig. 4. Cropping pattern in the inner zone of study area.
Fig. 2. 3-D view of the inner zone (153 km2) including contour-lines, road boundaries, dike, Yom-River, 3-local streams (Phairob, Nongkla, and Dongsualuang) with regulated structures (Dannoi, Saichanuanyai, and Lamnang), location of river stage recorder (Dlog) and 22- observation wells (e.g. P3 to P24).
Fig. 2. 3-D view of the inner zone (153 km2) included contour-lines, roads boundaries, dike, Yom-River, 3-local streams (Phairob, Nongkla, and Dongsualuang) with regulated struc-tures (Dannoi, Saichanuanyai, and Lamnang), location of river stage recorder (Dlog) and 22-observation wells (P3 to P24).
HESSD
2, 731–760, 2005 Phreatic surface fluctuations within the tropical floodplain S. Chuenchooklin et al. Title Page Abstract Introduction Conclusions References Tables Figures J I J I Back CloseFull Screen / Esc
Print Version
Interactive Discussion
EGU
3
Fig. 3. 3-D view of geological profiles resulted by soil log data interpreting from 22-observation wells (OW)’s construction in the inner zone (Mekpruksawong et al., 2004).
Fig. 4. Cropping pattern in the inner zone of study area.
Fig. 2. 3-D view of the inner zone (153 km2) including contour-lines, road boundaries, dike, Yom-River, 3-local streams (Phairob, Nongkla, and Dongsualuang) with regulated structures (Dannoi, Saichanuanyai, and Lamnang), location of river stage recorder (Dlog) and 22- observation wells (e.g. P3 to P24).
Fig. 3. 3-D view of geological profiles resulted by soil log data interpreting from 22-observation
wells (OW)’s construction in the inner zone (after Mekpruksawong et al., 2004).
HESSD
2, 731–760, 2005 Phreatic surface fluctuations within the tropical floodplain S. Chuenchooklin et al. Title Page Abstract Introduction Conclusions References Tables Figures J I J I Back CloseFull Screen / Esc
Print Version
Interactive Discussion
EGU 3
Fig. 3. 3-D view of geological profiles resulted by soil log data interpreting from 22-observation wells (OW)’s construction in the inner zone (Mekpruksawong et al., 2004).
Fig. 4. Cropping pattern in the inner zone of study area.
Fig. 2. 3-D view of the inner zone (153 km2) including contour-lines, road boundaries, dike, Yom-River,
3-local streams (Phairob, Nongkla, and Dongsualuang) with regulated structures (Dannoi, Saichanuanyai, and Lamnang), location of river stage recorder (Dlog) and 22- observation wells (e.g. P3 to P24).
HESSD
2, 731–760, 2005 Phreatic surface fluctuations within the tropical floodplain S. Chuenchooklin et al. Title Page Abstract Introduction Conclusions References Tables Figures J I J I Back CloseFull Screen / Esc
Print Version
Interactive Discussion
EGU
Fig. 5. View of 15-observation well’s serviced area (OW) using Thiessen’s polygon in study
area (50.414 km2) and location of 49-field infiltration experimental points located in floodplain.
HESSD
2, 731–760, 2005 Phreatic surface fluctuations within the tropical floodplain S. Chuenchooklin et al. Title Page Abstract Introduction Conclusions References Tables Figures J I J I Back CloseFull Screen / Esc
Print Version
Interactive Discussion
EGU
5
ground surface elevation (upland). Thirdly, if the
river water level (RWL) was higher than ground
surface elevation and the riverbank or levee
(floodplain), flood discharge could be estimated as
the flow over broad crested weir. The flood extensive
would be occurred on a consequence of the RWL.
The actual potential infiltration capacity could be the
rate of final infiltration value that nearly equaled to
the rate of hydraulic conductivity (K) because of
ground surface was saturated. The keeping water
depth in paddy field in each block during growing
season was averaged by 0.05 m with 0.02-0.08 m in
variant. However, during wet season and flood
period, depth of water above ground was varied and
ranged from 0.2 to 3.0 m. The amount of infiltration
would be varied by head of water according to
Darcy’s Law as the rate of seepage.
In case of none flooded (Fig.7), the continuity
equation for the hydrological processes measured
over a certain period of time (t) will be budgeted as:-
I = (P-ET) +(Q
in-Q
out) -
∆
S
(1)
P-ET can be considered as effective rainfall volume
(P
e). Whereas Q
inis the total volume of upstream
runoff water from every lateral streams and
over-bank flow from the river, Q
outis the total volume of
runoff water flow out from the considered
downstream boundary through the regulators at the
end of lateral streams, I is the infiltration or seepage
volume, and
∆
S is the change of storage volume. The
stream discharges via those regulated structures will
be considered as the flow volume via their channels.
For the case of flooded, it is assumed that there is
no any plant grown in such period, and then ET can
be considered as existing evaporation (E). The
extra-inflow (Q
in) can be computed as the discharge across
the levee or roads along the river.
The total amount of infiltrated water from surface to
subsurface of the 3-cases over the year will be
recharged to the unconfined aquifer and increased
phreatic surface level during inundated period.
However, during growing season, if rainfall is less
than crop water requirement withdrawal of
groundwater from shallow wells will be occurred
which affects the recessing of phreatic surface levels.
The first parameter, P, was the weighted values
from actual daily rainfall amount at every rain gauge
which was estimated by the Thiessen polygons
method which located at the districts namely Phichit,
Samngam, Saingam, Phopratabchang, Phothale, and
Kanuworalaksaburi. There was an automatically rain
gauge with 5-minutes time interval recorded and
located at Neonkwang School (P3) in the middle part
of the inner zone. It was used for the study of rainfall
intensity-duration-frequency and surface runoff over
the catchments.
To estimate crop water requirement (ET
c), the
FAO’s potential evapotranspiration (ET
o) using
combined Penman-Monteith’s (P-M) equation
(Doorenbos et al., 1977) was applied. Whereas all
parameters for this equation were applied by using
standard climatologically data recorded by the MD
(Thai Meteorological Department) at the Phichit
Agricultural Research Station in Phichit Province.
Those included daily solar radiation (sunshine hour),
air temperature (maximum and minimum), humidity
and wind speed data. Then ET
cfor each kind of crop
during growing season in none flooded catchments
could be estimated as ET
omultiplied by crop
coefficients (K
c) at each growing stages which
assumed to be the amount of groundwater consumed.
The loss from surface water was considered as flux
over the catchments (I) getting from field infiltration
experiment using ring-infiltrometer and fitted by
empirical Kostiakov’s infiltration model. The
accumulated depth into the soil (D) versus recording
times (t) would be equaled to the amount of
infiltrated water (F). However, during the saturated
condition or longer time of infiltration has been
taken, F can be replaced by saturated hydraulic
conductivity (K) [mm/d] varied by head. The
seepage coefficient (A
c) [mm/d/m] was introduced as
the rate of infiltrated per head of ponded water above
the ground surface (Mekpruksawong et al., 2004).
H
K
A
c=
/
(2)
The results of field infiltration would be weighed
by Thiessen Polygon’s area of each observation well
to represent the spatially distribution of fluxes and A
cover the catchment’s area.
To estimate lateral inflow (Q
in) from upstream
sub-catchments entering the inner zone, the method
of ungauged basin with lack of rainfall and stream
flow data was applied using the neighboring
catchment’s data of topographical and watershed
characteristics. The synthetic hydrograph using
Fig. 6. Configuration of water budget model for the
study of floodplain-groundwater interactions.
Fig. 6. Configuration of water budget model for the study interactions of floodplain-groundwater
interactions.
HESSD
2, 731–760, 2005 Phreatic surface fluctuations within the tropical floodplain S. Chuenchooklin et al. Title Page Abstract Introduction Conclusions References Tables Figures J I J I Back CloseFull Screen / Esc
Print Version
Interactive Discussion
EGU
6
Snyder and US Army Corps of Engineers method (US.ACE, 1994; Chow et al., 1988) was applied to compute the peak discharge (qp) and the hygrograph
shape. The basin characteristics including the stream length (L) [km], stream length measure from the centered of basin to outlet point (Lc) [km], average
stream slope (S), catchment’s area (A) [km2],
effective rainfall (Pe) [mm] and Ct, Cp, a1, a2 getting
from those relationships in linear regression from the neighboring basins were applied to compute the peak discharge, lag-time from the duration of rainfall to the
peak discharge (tp) [h], and base time (tb). Therefore,
lateral inflows (Qin) and their hydrographs entering
the inner zone could be sketched. However, the extra
Qin that might be spilled out from the river across the
levee or road along the river entering the inner zone with length of 3.95 km and altitude of 33.58 m (MSL) during flood season. Qout as discharge via the
open channel of the streams, road structures, and tail regulators was considered (Chow et al., 1988).
The area of flood extensive over the floodplain was studied according to daily river stage recorded at the middle reach of the Yom River (Dlog). Moreover, occasional field water stage observation during flood period at the upstream boundary (Wangjik) along the main road (Rd.#1276) through the feeder roads and observation wells in the inner zone and down to the last section at downstream boundary (Phaitapho) along the other main road (Rd.#1070) was investigated and used to sketch the water surface profiles. Therefore, the relationship among flooded height above natural ground surface versus inundated area and temporary flood storage would be fitted. Due to the limitation of the numbering of observation points in floodplain, the assumption of water surface level at every point along each cross sectional profiles would be the same value as the river water surface level (RWL). Therefore, flood flow patterns could be
presented at each return period of flood occurrences using the Gumbel’s distribution. Then the inundated depth at any point along floodplain cross-section would be used as flux head in the infiltration model and used to study the change of phreatic surface level (GWL). Moreover, the standard-step method in the river hydraulic analysis’s HEC-RAS model (US.ACE, 2001) was applied during the first year that without the stage recorder at Dlog yet. The cross-sectional profiles with average step length of 5-6 km which the upstream boundary water level at Y17 was used as initial condition and for computing stages along the Yom River at cross-sectional profiles, through the inner zone and down to the last section at Y5.
The change of phreatic surface levels in sub-surface water part (Fig. 7) would be compared to the computed recharge over the effective porosity. The
No
Yes
No
Computed infiltration I=Ac*H
T Q Q H I P ET Ag*( c− e+ +∆ − in− out)* Yes
Input Climate data:-
- Rainfall, P, - Temperature, - Sunshine hour, - wind velocity, - Humidity, etc. Land-use types:-- Crop types, - Crop calendar, - Growing stages, - Crop period, T ETo * Kc Computed: ETc = Field observed:- - Block name & area, - Crop area, Ag, - Seepage coef., Ac, - Ponded depth, H, -Change of water, ∆H
Input
Water util. vol. for crops: Vc = Computed lateral stream flows: Qin, Qout Computed: Pe Vc ≥0 Computed deep percolation No deep percolation GWL change No End Computed leakage & lateral GWs ∆GWL =I/ηe Yes Computed leakage & lateral GWs Adjust Ac Surface water Sub-surface water
Fig. 7. Flow chart of studying the change of phreatic surface and ponded water in the paddy field.
Fig. 7. Flow chart of computing the change of phreatic surface and ponding water in floodplain
paddy field.
HESSD
2, 731–760, 2005 Phreatic surface fluctuations within the tropical floodplain S. Chuenchooklin et al. Title Page Abstract Introduction Conclusions References Tables Figures J I J I Back CloseFull Screen / Esc
Print Version
Interactive Discussion
EGU
8
Table 1. Summary of 15-observation well (OW)’s configuration resulted by Thiessen Polygon OW’s name A, m2 Elevation, m(MSL) F
avg, mm/d Ac, mm/d/m K, mm/d P03 4232738.5 33.7272 12.4275 30.9884 2.1328 P07 623429.7 33.6745 0.0606 9.5954 0.0033 P08 3968126.6 33.8244 2.7883 10.9406 0.6015 P09 3350146.0 34.0738 0.8771 9.7988 0.0372 P10 3673692.7 33.4551 13.2486 14.5546 4.8885 P11 3703765.4 33.1596 3.9618 4.2836 0.9247 P12 2248121.3 32.1261 3.9296 37.6606 0.7095 P13 3181860.6 33.5462 3.4740 4.7221 1.5381 P14 4355718.4 32.7441 3.8949 51.0885 0.9424 P15 4825238.2 32.5698 7.6243 23.6926 2.2082 P20 3652650.6 31.6260 2.8464 4.6980 1.6496 P21 2813602.5 32.1984 9.6890 14.8101 2.7641 P22 2296654.3 32.0800 0.2869 6.3034 0.0225 P23 5922370.0 32.1657 0.9923 2.7884 0.0415 P24 1565952.4 32.3700 0.2869 6.3034 0.0225
Total=50,414,067 Avg=32.879 Avg=4.9247 Avg=16.2446 Avg=1.3549
0 50 100 150 200 250 300 1/4/ 00 1/8/ 00 1/12 /00 1/4/ 01 1/8/ 01 1/12 /01 1/4/ 02 1/8/ 02 1/12 /02 1/4/ 03 1/8/ 03 1/12 /03 1/4/ 04 1/8/ 04 1/12 /04 R unof f v o l. , 1 0 6 m 3 0 20 40 60 80 100 120 140 ET o , R ain fa ll ; mm /d Rainfall ETo Total RO vol.
Fig. 8. The distribution of infiltration flux (Ac) over floodplain generated from 49-points of field testing.
25.00 27.00 29.00 31.00 33.00 35.00 37.00 39.00 41.00 43.00 45.00 15/3 /00 11/9 /00 10/3 /01 6/9/ 01 5/3/ 02 1/9/ 02 28/2 /03 27/8 /03 23/2 /04 21/8 /04 17/2 /05 E le va ti on, m (M S L) 0 10 20 30 40 50 60 70 80 90 100 R ai n fa ll , m m
Rain-mean Y17 Wangjik Dlog Avg. Rain30d
Bankfull level at Dlog
Fig. 8. The distribution of infiltration flux (Ac) over floodplain resulted by 49-points of field experiment.
HESSD
2, 731–760, 2005 Phreatic surface fluctuations within the tropical floodplain S. Chuenchooklin et al. Title Page Abstract Introduction Conclusions References Tables Figures J I J I Back CloseFull Screen / Esc
Print Version
Interactive Discussion
EGU
8
Table 1. Summary of 15-observation well (OW)’s configuration resulted by Thiessen Polygon
OW’s name
A, m
2Elevation,
m(MSL)
F
avg, mm/d
A
c, mm/d/m
K, mm/d
P03 4232738.5 33.7272 12.4275 30.9884 2.1328
P07 623429.7
33.6745 0.0606 9.5954 0.0033
P08 3968126.6 33.8244 2.7883 10.9406 0.6015
P09 3350146.0 34.0738 0.8771 9.7988 0.0372
P10 3673692.7 33.4551 13.2486 14.5546 4.8885
P11 3703765.4 33.1596 3.9618 4.2836 0.9247
P12 2248121.3 32.1261 3.9296 37.6606 0.7095
P13 3181860.6 33.5462 3.4740 4.7221 1.5381
P14 4355718.4 32.7441 3.8949 51.0885 0.9424
P15 4825238.2 32.5698 7.6243 23.6926 2.2082
P20 3652650.6 31.6260 2.8464 4.6980 1.6496
P21 2813602.5 32.1984 9.6890 14.8101 2.7641
P22 2296654.3 32.0800 0.2869 6.3034 0.0225
P23 5922370.0 32.1657 0.9923 2.7884 0.0415
P24 1565952.4 32.3700 0.2869 6.3034 0.0225
Total=50,414,067
Avg=32.879
Avg=4.9247
Avg=16.2446
Avg=1.3549
0 50 100 150 200 250 300 1/4/ 00 1/8/ 00 1/12 /00 1/4/ 01 1/8/ 01 1/12 /01 1/4/ 02 1/8/ 02 1/12 /02 1/4/ 03 1/8/ 03 1/12 /03 1/4/ 04 1/8/ 04 1/12 /04
R
unof
f v
o
l.
, 1
0
6m
3 0 20 40 60 80 100 120 140ET
o,
R
ain
fa
ll
;
mm
/d
Rainfall ETo Total RO vol.Fig. 8. The distribution of infiltration flux (A
c) over floodplain generated from 49-points of field testing.
25.00 27.00 29.00 31.00 33.00 35.00 37.00 39.00 41.00 43.00 45.00 15/3 /00 11/9 /00 10/3 /01 6/9/ 01 5/3/ 02 1/9/ 02 28/2 /03 27/8 /03 23/2 /04 21/8 /04 17/2 /05 E le va ti on, m (M S L) 0 10 20 30 40 50 60 70 80 90 100 R ai n fa ll , m m
Rain-mean Y17 Wangjik Dlog Avg. Rain30d
Bankfull level at Dlog
Fig. 9. Daily rainfall and water surface level in the Yom River (RWL) at observation stations
during 2000–2004.
HESSD
2, 731–760, 2005 Phreatic surface fluctuations within the tropical floodplain S. Chuenchooklin et al. Title Page Abstract Introduction Conclusions References Tables Figures J I J I Back CloseFull Screen / Esc
Print Version
Interactive Discussion
EGU
8
Table 1. Summary of 15-observation well (OW)’s configuration resulted by Thiessen Polygon
OW’s name
A, m
2Elevation,
m(MSL)
F
avg, mm/d
A
c, mm/d/m
K, mm/d
P03 4232738.5 33.7272 12.4275 30.9884 2.1328
P07 623429.7
33.6745 0.0606 9.5954 0.0033
P08 3968126.6 33.8244 2.7883 10.9406 0.6015
P09 3350146.0 34.0738 0.8771 9.7988 0.0372
P10 3673692.7 33.4551 13.2486 14.5546 4.8885
P11 3703765.4 33.1596 3.9618 4.2836 0.9247
P12 2248121.3 32.1261 3.9296 37.6606 0.7095
P13 3181860.6 33.5462 3.4740 4.7221 1.5381
P14 4355718.4 32.7441 3.8949 51.0885 0.9424
P15 4825238.2 32.5698 7.6243 23.6926 2.2082
P20 3652650.6 31.6260 2.8464 4.6980 1.6496
P21 2813602.5 32.1984 9.6890 14.8101 2.7641
P22 2296654.3 32.0800 0.2869 6.3034 0.0225
P23 5922370.0 32.1657 0.9923 2.7884 0.0415
P24 1565952.4 32.3700 0.2869 6.3034 0.0225
Total=50,414,067
Avg=32.879
Avg=4.9247
Avg=16.2446
Avg=1.3549
0 50 100 150 200 250 300 1/4/ 00 1/8/ 00 1/12 /00 1/4/ 01 1/8/ 01 1/12 /01 1/4/ 02 1/8/ 02 1/12 /02 1/4/ 03 1/8/ 03 1/12 /03 1/4/ 04 1/8/ 04 1/12 /04
R
unof
f v
o
l.
, 1
0
6m
3 0 20 40 60 80 100 120 140ET
o,
R
ain
fa
ll
;
mm
/d
Rainfall ETo Total RO vol.Fig. 8. The distribution of infiltration flux (A
c) over floodplain generated from 49-points of field testing.
25.00 27.00 29.00 31.00 33.00 35.00 37.00 39.00 41.00 43.00 45.00 15/3 /00 11/9 /00 10/3 /01 6/9/ 01 5/3/ 02 1/9/ 02 28/2 /03 27/8 /03 23/2 /04 21/8 /04 17/2 /05 E le va ti on, m (M S L) 0 10 20 30 40 50 60 70 80 90 100 R ai n fa ll , m m
Rain-mean Y17 Wangjik Dlog Avg. Rain30d
Bankfull level at Dlog
Fig. 10. Daily P , E T , runoff vol. (RO) on floodplain and river channel via study area during
HESSD
2, 731–760, 2005 Phreatic surface fluctuations within the tropical floodplain S. Chuenchooklin et al. Title Page Abstract Introduction Conclusions References Tables Figures J I J I Back CloseFull Screen / Esc
Print Version
Interactive Discussion
EGU
Fig. 11. Annual P , E T , F , Qi n [mm] at the upstream catchments to the inner zone during 2000–2003.
HESSD
2, 731–760, 2005 Phreatic surface fluctuations within the tropical floodplain S. Chuenchooklin et al. Title Page Abstract Introduction Conclusions References Tables Figures J I J I Back CloseFull Screen / Esc
Print Version
Interactive Discussion
EGU
Fig. 12. Characteristic curves of flood pool level versus area, and flood pool levele versus
HESSD
2, 731–760, 2005 Phreatic surface fluctuations within the tropical floodplain S. Chuenchooklin et al. Title Page Abstract Introduction Conclusions References Tables Figures J I J I Back CloseFull Screen / Esc
Print Version Interactive Discussion EGU
9
0
200
400
600
800
1000
1200
1400
1600
1800
2000
2000
2001
2002
2003
Mean
Year
P,
ET
, F
, Q
(
m
m)
Rainfall
ET (P-M)
F-mm
Runoff
Fig. 12. Characteristic of flood pool level, area, storage
volume in floodplain based on existing topography.
0.0 50.0 100.0 150.0 200.0 250.0 300.0 350.0 30.0 31.0 32.0 33.0 34.0 35.0 36.0 37.0 Flooded level, m(MSL) Vo lu m e , 1 0 6 m 3 0 20 40 60 80 100 120 140 Inunda te d a re a ,s q. km Stor. Vol., mcm Flood Area, sq.km
Fig. 10. Daily P, ET, runoff vol. (RO) on floodplain and
river channel via study area in 2000-2003.
Fig. 13. Flood flow patterns in floodplain with the
different frequencies of the occurrence year (Tr).
Fig. 9. Daily rainfall and water surface level in the Yom
River (RWL) at observation stations in 2000-2004.
0
10
20
30
40
50
60
70
80
90
100
1-
Se
p
15
-Se
p
29
-Se
p
13
-O
ct
27
-O
ct
10
-N
ov
24
-N
ov
Inun
da
te
d a
re
a (k
m
2)
Flood Area 2001
Flood Area 2002
Flood Area 2003
Fig. 14. Comparative inundated extents in 3 years.
Fig. 11. Annual P, ET, F, Q
in(mm) at the upstream
catchments entered the inner zone in 2000-2003.
22.00
24.00
26.00
28.00
30.00
32.00
34.00
36.00
1/1
1/0
1
31
/3/
02
28
/8/
02
25
/1/
03
24
/6/
03
21
/11
/03
19
/4/
04
16
/9/
04
W
a
te
r le
v
e
l, m
(M
S
L
)
RWL
P11
P12
P14
P20
P22
P8
delay time
rising limb
delay time
falling limb
delay time
falling limb
delay time
rising limb
Trend line of
min. GWL in dry
season
Fig. 13. Flood flow patterns in floodplain with the different frequencies (Tr) of 5 yr, 20 yr, and
100 yr, respectively.
HESSD
2, 731–760, 2005 Phreatic surface fluctuations within the tropical floodplain S. Chuenchooklin et al. Title Page Abstract Introduction Conclusions References Tables Figures J I J I Back CloseFull Screen / Esc
Print Version Interactive Discussion EGU
9
0
200
400
600
800
1000
1200
1400
1600
1800
2000
2000
2001
2002
2003
Mean
Year
P,
ET
, F
, Q
(
m
m)
Rainfall
ET (P-M)
F-mm
Runoff
Fig. 12. Characteristic of flood pool level, area, storage
volume in floodplain based on existing topography.
0.0 50.0 100.0 150.0 200.0 250.0 300.0 350.0 30.0 31.0 32.0 33.0 34.0 35.0 36.0 37.0 Flooded level, m(MSL) Vo lu m e , 1 0 6 m 3 0 20 40 60 80 100 120 140 Inunda te d a re a ,s q. km Stor. Vol., mcm Flood Area, sq.km
Fig. 10. Daily P, ET, runoff vol. (RO) on floodplain and
river channel via study area in 2000-2003.
Fig. 13. Flood flow patterns in floodplain with the
different frequencies of the occurrence year (Tr).
Fig. 9. Daily rainfall and water surface level in the Yom
River (RWL) at observation stations in 2000-2004.
0
10
20
30
40
50
60
70
80
90
100
1-
Se
p
15
-Se
p
29
-Se
p
13
-O
ct
27
-O
ct
10
-N
ov
24
-N
ov
Inun
da
te
d a
re
a (k
m
2)
Flood Area 2001
Flood Area 2002
Flood Area 2003
Fig. 14. Comparative inundated extents in 3 years.
Fig. 11. Annual P, ET, F, Q
in(mm) at the upstream
catchments entered the inner zone in 2000-2003.
22.00
24.00
26.00
28.00
30.00
32.00
34.00
36.00
1/1
1/0
1
31
/3/
02
28
/8/
02
25
/1/
03
24
/6/
03
21
/11
/03
19
/4/
04
16
/9/
04
W
a
te
r le
v
e
l, m
(M
S
L
)
RWL
P11
P12
P14
P20
P22
P8
delay time
rising limb
delay time
falling limb
delay time
falling limb
delay time
rising limb
Trend line of
min. GWL in dry
season
Fig. 14. Comparison of the inundated extents during 2001 to 2003.
HESSD
2, 731–760, 2005 Phreatic surface fluctuations within the tropical floodplain S. Chuenchooklin et al. Title Page Abstract Introduction Conclusions References Tables Figures J I J I Back CloseFull Screen / Esc
Print Version Interactive Discussion EGU 9 0 200 400 600 800 1000 1200 1400 1600 1800 2000 2000 2001 2002 2003 Mean Year P, ET , F , Q ( m m) Rainfall ET (P-M) F-mm Runoff
Fig. 12. Characteristic of flood pool level, area, storage volume in floodplain based on existing topography.
0.0 50.0 100.0 150.0 200.0 250.0 300.0 350.0 30.0 31.0 32.0 33.0 34.0 35.0 36.0 37.0 Flooded level, m(MSL) Vo lu m e , 1 0 6 m 3 0 20 40 60 80 100 120 140 Inunda te d a re a ,s q. km Stor. Vol., mcm Flood Area, sq.km
Fig. 10. Daily P, ET, runoff vol. (RO) on floodplain and river channel via study area in 2000-2003.
Fig. 13. Flood flow patterns in floodplain with the different frequencies of the occurrence year (Tr). Fig. 9. Daily rainfall and water surface level in the Yom River (RWL) at observation stations in 2000-2004.
0 10 20 30 40 50 60 70 80 90 100 1-Se p 15-Se p 29-Se p 13-O ct 27-O ct 10-N ov 24-N ov Inun da te d a re a (k m 2 )
Flood Area 2001 Flood Area 2002 Flood Area 2003
Fig. 14. Comparative inundated extents in 3 years. Fig. 11. Annual P, ET, F, Qin (mm) at the upstream
catchments entered the inner zone in 2000-2003.
22.00 24.00 26.00 28.00 30.00 32.00 34.00 36.00 1/11/0 1 31/3/02 28/8/02 25/1/03 24/6/03 21/11/03 19/4/04 16/9/04 W a te r le v e l, m (M S L ) RWL P11 P12 P14 P20 P22 P8 delay time rising limb delay time falling limb delay time falling limb delay time rising limb Trend line of min. GWL in dry season
Fig. 15. Comparison between daily river stage (RWL) and phreatic surface (GWL) at some
observation wells in floodplain with the downward slope of trend line during dry periods.