HAL Id: hal-00797133
https://hal.archives-ouvertes.fr/hal-00797133
Submitted on 5 Mar 2013
HAL is a multi-disciplinary open access
archive for the deposit and dissemination of
sci-entific research documents, whether they are
pub-lished or not. The documents may come from
teaching and research institutions in France or
abroad, or from public or private research centers.
L’archive ouverte pluridisciplinaire HAL, est
destinée au dépôt et à la diffusion de documents
scientifiques de niveau recherche, publiés ou non,
émanant des établissements d’enseignement et de
recherche français ou étrangers, des laboratoires
publics ou privés.
Segmentation of elevation images based on a
morphology approach for agricultural clod detection
Olivier Chimi Chiadjeu, Sylvie Le Hegarat-Mascle, Edwige Vannier, Richard
Dusséaux, Odile Taconet
To cite this version:
Olivier Chimi Chiadjeu, Sylvie Le Hegarat-Mascle, Edwige Vannier, Richard Dusséaux, Odile Taconet.
Segmentation of elevation images based on a morphology approach for agricultural clod detection. 5th
International Congress on Image and Signal Processing (CISP), 2012, Oct 2012, Chongqing, Sichuan,
China. pp.701-705, �10.1109/CISP.2012.6469994�. �hal-00797133�
SEGMENTATION OF ELEVATION IMAGES
BASED ON A MORPHOLOGY APPROACH FOR
AGRICULTURAL CLOD DETECTION
Olivier Chimi-Chiadjeu, Edwige Vannier
Richard Duss´eaux, Odile Taconet
Universit´e de Versailles St Quentin IPSL/LATMOS, 11 boulevard d’Alembert78280 Guyancourt, France
Sylvie Le H´egarat-Mascle
Universit´e Paris-Sud, IEF (ACCIS)91405 Orsay cedex, France
Abstract—This study deals with the segmentation of altitude
or elevation images, i.e. images of the distance (𝑧-coordinate) between the surface or objects and the camera plane. Specifically to our soil science application, these images are acquired on agricultural surfaces in order to evaluate their roughness. The cloddy structure being a key factor to characterize soil roughness, the elevation image analysis aims at detecting and identifying the clods as accurately as possible. Now, rather than defining a new segmentation algorithm, we propose to transform the input data so as to take into account the different criteria characterizing the clod objects, namely the relative altitude and a function of the gradient norm. The proposed approach was validated on three agricultural surfaces (two synthetic and one real) and the results compared to those of an algorithm previously developed specifically for the clod identification problem.
keywords–Depth image, segmentation, watershed, agricul-tural soil, cloddiness.
I. INTRODUCTION
Surface micro-relief has a large impact on soil properties and geomorphologic processes such as water infiltration or runoff, substrate movement and soil erosion. Therefore, many studies have dealt with surface roughness, soil height changes and soil cloddiness characterization [1], [2]. To monitor soil features, some studies have focused on the potential of remote sensing imagery, in particular radar imagery (e.g. [3], [4], [5]). Now, remote sensing sensor resolution varies from the meter (high resolution) to the kilometer (coarse resolution), so that they are sensitive to statistical properties of the surface. In order to link the remote sensing observations to physical soil features, as well as for modelling purpose, the surface should be characterized at fine scale (centimeter).
The measure of the micro-relief of the soil surface at millimetre resolution for an area in the meter square range is now a widely used practice. It is performed either with laser scanners [6], [7] or with stereo photogrammetry [8] [9]. The heights measured on a regular grid enable to get a three dimension (3D) digital elevation model (DEM) of the surface. In the present study, we address the problem of interpreting high resolution DEM images of the soil surface. In particular,
we focus on the identification of clods or big aggregates (namely with diameter greater than 7 mm) in a reliable and automatic way. Such a problem of objet identification can be addressed as a segmentation problem under the constraint that regions superimpose with clods, except for the region representing soil surface (defined as the surface supporting the clods).
Image segmentation aims at partitioning an image into regions, i.e. clusters of connected pixels. In classic seg-mentation, the clusters of pixels represent a slightly more organized information than the pixel level, and correspond to an intermediate level towards the detection of objects. Main criteria considered to achieve the segmentation are either so-called ‘region’, i.e. based on the characteristics of regions, or so-called ‘boundary’, or both. For instance, the best known ‘regions’ based algorithms are the region growing, or split and merge [10] algorithms. In the latter, the initial image partition is modified by merging or dividing regions, based on the characteristics (area, brightness, color, texture, etc.) of each region, measured by various indices such as homogeneity, contrast, variance, interquartile range, entropy etc. Generally more robust are the algorithms that take into account different criteria based on ‘boundary’ and ‘region’. For example, the functional proposed by Mumford & Sha includes features based on both pixel intensity and constraints on geometric regularity (e.g. minimizing the whole length of the bound-aries). The parameter weighting these different criteria in the functional is a scale parameter in the sense that it controls the minimal size of the regions and their final number [11]. Let us mention finally the segmentation by watershed transform derived from mathematical morphology [12]. In this approach, the image is viewed as a topographic surface with pixel intensity representing the altitude. From the regional minima, a progressive immersion of the topographic surface in water is simulated in order to find the watershed boundaries: the frontiers where the waters of the various watersheds meet, i.e. the boundaries geodesically equidistant from the image minima. Classically, to segment an image 𝐼 in uniform re-gions bounded by edges corresponding to high gradient, the
watershed segmentation applies to the image of the gradient norm, ∣∇𝐼∣. Indeed on ∣∇𝐼∣, local minima are located in homogeneous areas and the local maxima on areas presenting rapid variations of grey levels. In this study, we discuss why the watershed segmentation principle is close to our problem and how the 𝑎 𝑝𝑟𝑖𝑜𝑟𝑖 features of a clod can be introduced as segmentation criteria.
In the remainder of the paper, Section II presents the considered problem (soil surfaces) and the proposed approach, results are then gathered in Section III, and conclusions in Section IV. Note that the proposed segmentation will apply to any image similar to our DEM images (in particular depth images), provided that the researched objects may be characterized by properties of convexity or concavity of the image function restricted to the subdomains defined by the regions.
II. CLODS SEGMENTATION
Let us first briefly present the a priori physical model of the clod in order to determine the features of the researched regions. Although the definition of a clod remains a debated issue in the community of soil scientists, we use the following definition: the clods form aggregates, roughly comparable to half ellipsoids, placed on the soil surface. This definition induces three main characteristics: (𝑖) the clod points have a higher altitude than the soil surface points around the clod, (𝑖𝑖) on the clod boundaries, the altitude varies rapidly, and (𝑖𝑖𝑖) each clod has one local maximum.
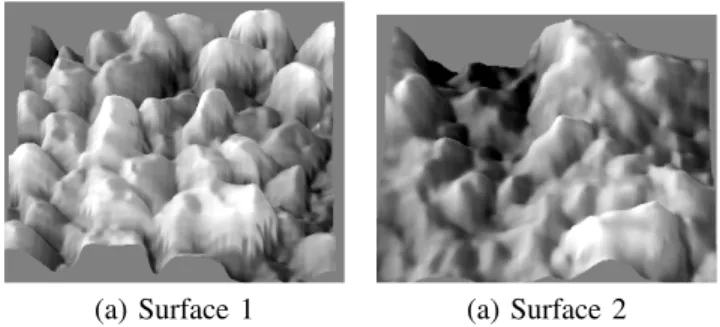
Previous features should therefore characterize the regions that will result from the image segmentation. Here the con-sidered image is the altitude image obtained by stereovision (see Fig. 1). Hence previous features of the clod points in terms of altitude directly transfer as pixel value features. As seen in the introduction, classic segmentation algorithms are based on a criterion of homogeneous regions (and possibly additional criterion). They are therefore suitable for finding regions characterized by high homogeneity. Yet, on the altitude image, the clods are not characterized by homogeneous values (the altitude varies inside the clod), and the clod borders are not characterized by local maxima of the gradient values (at the clod base, the altitude varies only toward the inside of the clod). Thus, conventional methods applied in the conventional way are not suitable. However, the watershed approach applied
(a) Surface 1 (a) Surface 2
Figure 1. 3D representation of altitude images of the surfaces 1 and 2.
to an adequate transformation of the image seems appropriate for our problem: basically, if one multiplies the altitudes by (−1), we obtain an image where the minima are the tops of clods. Using a so basically image transform several phenomena occur that affect the performance of segmentation. For instance, if the soil surface was horizontal, the boundaries would be located at equal geodesic distance from the clod peak points rather than at clod basis. Now, actually the soil surface is not even flat leading to over-segmentation of the image and false detection of clods (see Fig. 2).
To achieve the proposed solution, we split our problem into two sub-problems. The first one is performing the segmen-tation so that the clods coincide with some regions of the segmentation. The second one is selecting the clods among the regions, since the partition of the image that results from the segmentation process also contains a (some) region(s) representing the soil between clods. Now, the clods are mainly characterized by elevations ‘higher’ than the local elevation of the soil surface and the contours rather serve to position finely the boundary of the clod. Both criteria are gathered in a functional. Since the watershed segmentation will place the contours at local maxima of the image, the functional should be such that its local minima correspond to the clod peaks, and its maxima to the clod bases. From the physical model of the clod, the form of the image for segmentation should be decreasing with the altitude pixel value, and increasing with the gradient norm value. We choose the following form:
𝐻(𝑥, 𝑦) = −𝑓(𝑥, 𝑦) + 𝛽 × 𝐺(𝑥, 𝑦), (1) where 𝑥 and 𝑦 are pixel coordinates in the image (indices of column and row),𝑓(𝑥, 𝑦) is the pixel value in the altitude image,𝐺(𝑥, 𝑦) the pixel value in the gradient (here, computed by finite differences) pseudo-altitude image and𝛽 is a positive parameter.𝐺 image is obtained computing the gradient norm on a pseudo-altitude image𝐹 by:
{
𝐹 (𝑥, 𝑦) = 𝐷
1+𝑒𝑥𝑝(−𝜆(𝑓(𝑥,𝑦)−𝑓)) if𝑓(𝑥, 𝑦) > 𝑓,
𝐹 (𝑥, 𝑦) = 𝑓(𝑥, 𝑦) otherwise, (2) where 𝐷 is the altitude image contrast (difference between maximum and minimum values over the image),𝑓 is the mean of the altitude values and 𝜆 is the sigmoid parameter. The motivation for𝐹 is that the bases of clods are located close and
(b) Altitude image (a) Segmentation result Figure 2. Surface 2: Result of watershed segmentation applied to the opposite of the image.
above the soil surface, and that they will be detected using the gradient information. Thus, this latter should be reinforced for altitude values both close and above the soil surface altitude that is approximated by the mean altitude over the imaged area.
From (1) and (2),𝐻 image (that will be used for watershed segmentation) depends on two parameters: the first one, 𝛽, adjusts the weight of the gradient (or slope) information compared to the altitude one, and the second one, 𝜆, adjusts the emphasis of the gradient above the average level of the soil surface. In our study, these two parameters have been fitted in an ad hoc way.
Having performed segmentation, the following step removes the regions that do not check the clod features, namely an altitude both significant and greater than the soil surface altitude. For these tests, the median values of the altitude are computed for each clod𝑘 either inside the clod 𝑓
∫ 𝑘
𝑚𝑒𝑑or on the boundary of the clod 𝑓
∮ 𝑘 𝑚𝑒𝑑. The condition 𝑓 ∫ 𝑘 𝑚𝑒𝑑− 𝑓 ∮ 𝑘 𝑚𝑒𝑑 > 𝜏, where 𝜏 is a threshold parameter, ensures that the clod is sufficiently prominent (and thus ‘signifiant’), and the condition
𝑓
∫ 𝑘
𝑚𝑒𝑑 > 𝑓 ensures that the clod is not located in a hole. The three parameters (𝛽, 𝜆, 𝜏) are fitted knowing the reference boundaries.
III. RESULTS
A. Data bases
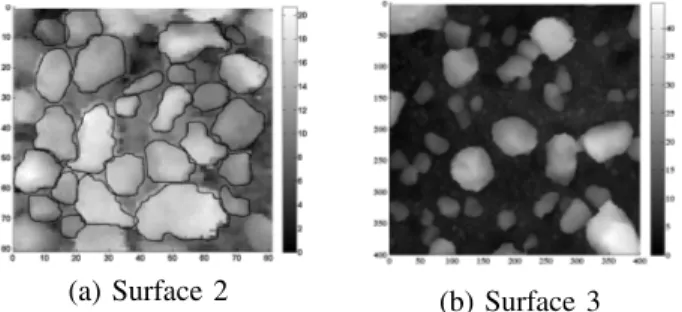
Our approach has been tested on three altitude images of bare agricultural soil surfaces. The first surface is an artificial one, made in the laboratory by laying small sieved clods on a flat surface. Its size equals to 80 × 80mm2 with a resolution of 1mm on the three axes. The second surface was recorded in an actual field. Its size is equal to 200 × 200mm2 with a resolution of 1mm along the horizontal plane axes and 1.1mm on the vertical axis. The third surface is an artificial flat surface, having a size equal to 400 × 400mm2 with a resolution of 0.5mm on the three axes. It contains sieved clods, showing a greater range of clod size and spacing than surface 1. For this study, only clods of a diameter greater than 7mm were considered, leading to 26 clods on the first surface, 29 on the second surface, and 73 clods on the third surface. Manual delineation of individual clods, what we call reference boundaries, was completed by a soil scientist for surface 1 and surface 2, and by photointerpretation for surface 3 (for which the boundaries of the clods are easily identifiable). Fig. 3 shows the grey level altitude images of the first surface and the third surface (surface 2 was already presented in Fig. 2).
B. Performance measures
To quantify the results, we compute three indices measuring the performance of segmentation, based on the reference boundaries. First, at object level, the accuracy of clod identi-fication is evaluated through two indices: the sensitivity (𝑆𝑒) and the specificity (𝑆𝑝) respectively defined by:
𝑆𝑒=𝑁𝑁𝑡𝑖𝑑
𝑡𝑟𝑢𝑒, (3)
(a) Surface 2 (b) Surface 3
Figure 3. Altitude images of the surfaces 1 and 3. On surface 1, the reference boundaries of the clods are plotted.
𝑆𝑝=𝑁𝑁𝑡𝑖𝑑
𝑜𝑏, (4)
where 𝑁𝑡𝑖𝑑denotes the number of identified true clods (right positives),𝑁𝑡𝑟𝑢𝑒the total number of true clods (right positives + false negatives) and 𝑁𝑜𝑏 the number of identified objects (right positives + false positives). 𝑆𝑒 (sensitivity) represents the rate of clods properly identified (i.e. the probability that an actual clod is effectively detected), whereas𝑆𝑝(specificity) represents the quality of the identifications made (i.e. the prob-ability that a detected clod is an actual clod). The estimation of 𝑆𝑒 and𝑆𝑝 requires a step of association between regions and reference clods. It is done following the principle of ‘mutual agreement’: when a region𝑅𝑖 intersects several clods
𝐶𝑗, it selects to the clod which has the largest intersection (𝑅𝑖↔ arg max𝐶𝑗/∣𝐶𝑗∩𝑅𝑖∣>0∣𝐶𝑗∩ 𝑅𝑖∣ where ∣𝐴∣ denotes the cardinal of the𝐴 set), and when several regions select a same clod, the clod selects the region with has the largest intersec-tion is retained (𝐶𝑖↔ arg max𝑅𝑗/∣𝐶𝑖∩𝑅𝑗∣>0∣𝐶𝑖∩ 𝑅𝑗∣). Thus a false positive is a region which has only empty intersections with reference clods or non null intersections with clods that do not select it. When a clod is selected by𝑁 regions (case of over-segmentation of the clod), it leads to one more right positive and𝑁 − 1 more false positives.
Then, at pixel level, the overlap rate qualifies the precision of localization as follows:
𝑇𝑑𝑒𝑡𝑒𝑐𝑡/𝑟𝑒𝑓 = ∣𝑆∣𝑆𝑑𝑒𝑡𝑒𝑐𝑡∩ 𝑆𝑟𝑒𝑓∣
𝑑𝑒𝑡𝑒𝑐𝑡∪ 𝑆𝑟𝑒𝑓∣, (5) where 𝑆𝑑𝑒𝑡𝑒𝑐𝑡 is the image sub-domain that is the union of the detected clods, 𝑆𝑟𝑒𝑓 is the image sub-domain that is the union of the reference clods (established by the soil scientist).
𝑇𝑑𝑒𝑡𝑒𝑐𝑡/𝑟𝑒𝑓 varies between 0 and 1 (perfect identification).
C. Contour-based algorithm (used for comparison)
In order to compare our approach with an existing method, we recall that relying on the assumption that clods can be identified in the image as structures presenting enclosed level lines introduced in [8]. Precisely, a ‘level line’ is a set of connected pixels having the same value in the image. Two level lines are said ‘enclosed’ if one of them is included in the set of pixels interior to the second one. Assuming that near clod bases, the gradients are among the highest,
the level lines are only computed on the set of pixels with a high value of gradient. Then, algorithm [8] is based on three steps:(𝑖) selection of the pixels of high gradient values, (𝑖𝑖) for these pixels, selection of the level lines both closed and having a length greater than the minimal length, and (𝑖𝑖𝑖) hierarchization of these level lines, based on a inclusion ordering relationship. Finally, the clod boundary is the biggest level line, according to inclusion ordering, including only one clod center.
D. Segmentation results
For surface 1 and surface 2, best performance identification was achieved respectively for parameters (𝛽, 𝜆, 𝜏) equal to (2.33, 0.2, 1) and (1.44, 0.2, 1). Conversely to the two last parameters, at this stage, we were unable to set a priori the parameter 𝛽 that depends on the standard deviation of the surface (𝜎1 = 3.8, 𝜎2 = 11.8). Fig. 4 shows the modified image altitude𝐹 , and its gradient norm image 𝐺. The highest gradient norm values are well located on the basis of the clods.
For surface 1, Fig. 5 shows the results of the watershed algorithm applied to 𝐻 images (modified input data) and of the contour-based approach. Most clods are well detected and located, few are over-segmented, and few are missed. The reference contains 26 actual clods. 23 clods were found by the proposed algorithm. Among these 23 clods, there is one false detection, 20 clods were detected and localized in a more or less fine way and one was over-segmented in two regions (False Positive, 𝐹 𝑃 = 1 + 1, True Positive, 𝑇 𝑃 = 20 + 1). Five actual clods were completely missed (False Negative,
𝐹 𝑁 = 5). With the contour-based approach, 21 clods were
found, which are as follows: there is one false detection, 18 clods are correct and one is over-segmented, whereas 7 were completely missed (𝐹 𝑁 = 7, 𝐹 𝑃 = 1 + 1, 𝑇 𝑃 = 18 + 1). The quantitative performance values of segmentation are shown in Table I. For surface 1, 𝑆𝑒 and 𝑆𝑝 are very
(a) Modified image altitude (b) Gradient norm image Figure 4. Transformation of the initial altitude image to reinforce gradient at the clod basis; case of surface 2.
TABLE I
PERFORMANCE OF SEGMENTATION
Methods 𝑆𝑒 𝑆𝑝 𝑇𝑑𝑒𝑡𝑒𝑐𝑡/𝑟𝑒𝑓
Surface 1 Watershed algorithm 80.7% 91.3% 0.73 Contour-based approach 73.1% 90.5% 0.52 Surface 2 Watershed algorithm 82.8% 85.7% 0.61 Contour-based approach 79.3% 88.5% 0.49
(a) Watershed algorithm (b) Contour-based approach Figure 5. Surface 1: Reference boundaries of the clods (solid line), and results (dashed line) using watershed algorithm (a) or contour-based approach (b).
high, underlying the efficiency of the clod identification at objet level. 𝑇𝑑𝑒𝑡𝑒𝑐𝑡/𝑟𝑒𝑓 is equal to 0.73 with the watershed segmentation and 0.52 with the contour-based approach, that corresponds to satisfying and relatively satisfying values. The proposed segmentation method outperforms the contour-based method for 𝑆𝑝,𝑆𝑒 and𝑇𝑑𝑒𝑡𝑒𝑐𝑡/𝑟𝑒𝑓.
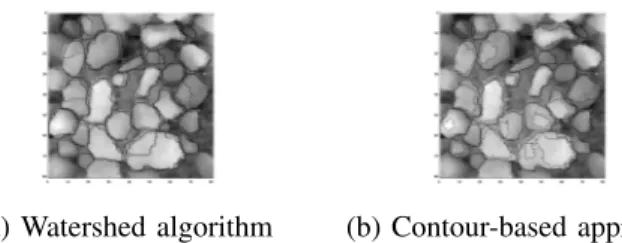
For the surface 2, Fig. 6 shows the results of the watershed algorithm applied to 𝐻 images and of the contour-based approach. The segmentation is again satisfactory. 𝑆𝑒 and𝑆𝑝 are still very high, underlying the performance of the clod identification on a real soil surface for which the clods are less contrasted than sieving (see fig. 1 and Tab. I).𝑇𝑑𝑒𝑡𝑒𝑐𝑡/𝑟𝑒𝑓 is equal to 0.61 with the watershed segmentation and to 0.49 with the contour-based approach, that also corresponds to relatively satisfying values and shows the higher complexity of segmenting a DEM recorded in a actual field. 𝑆𝑝 and
𝑆𝑒 have the same order of value but, 𝑇𝑑𝑒𝑡𝑒𝑐𝑡/𝑟𝑒𝑓 is better with the watershed algorithm. On that surface, there is less difference between both algorithms.
E. Robustness analysis
In this section, we aim at studying the sensitivity of the proposed method to its parameters, in particular the 𝛽 one since the (𝜆, 𝜏) parameters have already been fixed to (0.2, 1). For this study, let us considere the third surface. For surface 3 the standard deviation is 𝜎3= 8.6. That value is close to the value of standard deviation of surface 2,𝜎2= 11.8. Therefore
a priori the choice of the parameter beta would be the same
as for surface 2 (𝛽 = 1.44). Anyway, we also test 𝛽 = 2.33 and𝛽 = 0.82 to check the algorithm sensitivity to 𝛽.
(a) Watershed algorithm (b) Contour-based approach Figure 6. Surface 2: Reference boundaries of the clods (solid line), and results (dashed line) using watershed algorithm (a) or contour-based approach (b).
(a)𝛽 = 2.33 (b)𝛽 = 1.44
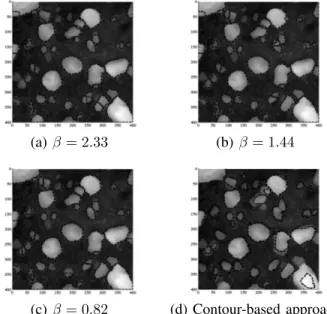
(c)𝛽 = 0.82 (d) Contour-based approach Figure 7. Surface 3: Results obtained using the watershed algorithm (a-c) and the contour-based approach (d).
Fig. 7 shows the results of the contour-based approach and of the watershed algorithm applied to 𝐻 images on surface 3, for the three values of 𝛽 tested. First we note that the results seems very close. They only differ in terms of small clods not always detected (e.g. the clod centered at coordinates (25, 275)), and some oversegmentation of some small clods (e.g. the clod centered at coordinates(300, 350)). Then, we also note that several small clods are not detected, conversely to the case of the contour-based approach. Now, looking closely at the contour-based approach, we see that the contours are rather imprecise: underestimation of the clod in several cases (in particular the clod centered at coordinates (350, 350)). Thus, we conclude first that watershed segmen-tation is rather robust at least for the main clods, and second that it is rather precise in terms of clods delineation. These conclusions are quantitatively confirmed by Tab. II that shows the obtained quantitative performance criteria.
IV. CONCLUSION
Having explained why, for our problem of clod identifica-tion, classical image processing segmentation methods cannot be applied directly, we describe the proposed solution. It is based on an a priori physical model of the clod conveyed in terms of mathematical properties. This leads to the definition of a new image for applying the classical watershed segmenta-tion. Performance evaluation in terms of clod identification is
TABLE II
ROBUSTNESS OF SEGMENTATION ON SURFACE3
Methods 𝑆𝑒 𝑆𝑝 𝑇𝑑𝑒𝑡𝑒𝑐𝑡/𝑟𝑒𝑓
Watershed algorithm𝛽=0.82 86.0% 82.2% 0.69
Watershed algorithm𝛽=1.44 90.6% 82.9% 0.69
Watershed algorithm𝛽=2.33 73.1% 83.7% 0.68
Contour-based approach 83.7% 100% 0.65
addressed both at object level and at pixel level. Compared to a specific contour-based algorithm previously developped, the proposed approach showed its interest and performance, since clods are much better localized (pixel level) and nearly as well detected (object level). We also test the robustness of the algorithm to its parameters in order to be able to define default values. We find that the surface standard deviation influences the parameter optimal value and can guide its choice.
Further studies will prospect in three directions: first, from the application point of view, we will study a greater num-ber of surfaces, second, we continue exploring an automatic estimation of the method parameters, third, we will apply the proposed segmentation in the case of different applications, e.g. on depth images where the 3D objects are approximately convex (e.g. cars, people in urban environment).
ACKNOWLEDGMENT
The authors woulk like to thank the Programme National de T´el´ed´etection Spatiale (PNTS) to support this study.
REFERENCES
[1] A.C. Guzha, “Effects of tillage on soil microrelief, surface depression storage and soil water storage,” Soil and Tillage Research, vol. 76, pp. 105-114, 2004.
[2] A. Hemmat, I. Ahmadi, A. Masoumi, “Water infiltration and clod size distribution as influenced by ploughshare type, soil water content and ploughing depth,” Biosytems Engineering, vol. 97, pp. 257-266, 2007. [3] S. Le H´egarat-Mascle, M. Zribi, F. Alem, A. Weisse, C. Loumagne,
“Soil moisture estimation from ERS/SAR data,” Toward an operational methodology, IEEE Transactions on Geosciences and Remote Sensing, vol. 40, pp. 2647-2658, 2002.
[4] M. Zribi, S. Le H´egarat-Mascle, C. Ottl´e, B. Kammoun, C. Gu´erin, “Surface soil moisture from the synergistic use of the (multi-incidence and multi-resolution) active microwave ERS Wind Scatterometer and SAR data,” Remote Sensing of Environment, vol. 86, pp. 30-41, 2003. [5] N.E.C. Verhoest, H. Lievens, W. Wagner, J. Alvarez-Mozos, M.S. Moran,
F. Mattia, ”On the soil roughness parameterization problem in soil moisture retrieval of bare surfaces from synthetic aperture radar,” Sensors, vol. 8, pp. 4213-4248, 2008.
[6] F. Darboux, C. Huang, “An instantaneous-profile laser scanner to measure soil surface microtopography,” Soil Science Society of America Journal, vol. 67, pp. 92-99, 2003.
[7] J. Arvidsson, E. Bolenius, “Effects of soil water content during primary tillage-laser measurements of soil surface changes,” Soil and Tillage Research, vol. 90, pp. 222-229, 2006.
[8] O. Taconet, E. Vannier, S. Le H´egarat-Mascle, “A contour-based approach for clods identification and characterization on a seebed surface,” Soil and Tillage Research, vol. 109, pp. 123-132, 2010.
[9] O. Chimi-Chiadjeu, E. Vannier, R. Duss´eaux, O. Taconet, “Influence of gradient estimation on clod identification on a seedbed digital elevation model,” Environmental Engineering Geoscience, vol. 17, pp. 337-352, 2011.
[10] R.C. Gonzalez, R.E. Woods, “Digital Image Processing,” 2nd Edition, Prentice Hall, New Jersey 2002.
[11] G. Koepfler, C. Gonzalez, J. Morel, “A multiscale algorithm for im-age segmentation by variational method,” SIAM Journal on Numerical Analysis, vol. 31, pp. 282-299, 1994.
[12] S. Beucher, F. Meyer, “The morphological approach to segmentation: the watershed transformation,” In Mathematical Morphology in Image Processing (Ed. E. R. Dougherty), pp. 433-481, 1993.