HAL Id: hal-00298131
https://hal.archives-ouvertes.fr/hal-00298131
Submitted on 21 Jun 2006HAL is a multi-disciplinary open access
archive for the deposit and dissemination of sci-entific research documents, whether they are pub-lished or not. The documents may come from teaching and research institutions in France or abroad, or from public or private research centers.
L’archive ouverte pluridisciplinaire HAL, est destinée au dépôt et à la diffusion de documents scientifiques de niveau recherche, publiés ou non, émanant des établissements d’enseignement et de recherche français ou étrangers, des laboratoires publics ou privés.
The origin of the European ”Medieval Warm Period”
H. Goosse, Olivier Arzel, J. Luterbacher, M. E. Mann, H. Renssen, N.
Riedwyl, A. Timmermann, E. Xoplaki, H. Wanner
To cite this version:
H. Goosse, Olivier Arzel, J. Luterbacher, M. E. Mann, H. Renssen, et al.. The origin of the European ”Medieval Warm Period”. Climate of the Past Discussions, European Geosciences Union (EGU), 2006, 2 (3), pp.285-314. �hal-00298131�
CPD
2, 285–314, 2006The origin of the European “Medieval Warm Period” H. Goosse et al. Title Page Abstract Introduction Conclusions References Tables Figures J I J I Back Close
Full Screen / Esc
Printer-friendly Version Interactive Discussion
EGU
Clim. Past Discuss., 2, 285–314, 2006 www.clim-past-discuss.net/2/285/2006/ © Author(s) 2006. This work is licensed under a Creative Commons License.
Climate of the Past Discussions
Climate of the Past Discussions is the access reviewed discussion forum of Climate of the Past
The origin of the European “Medieval
Warm Period”
H. Goosse1, O. Arzel1, J. Luterbacher2, M. E. Mann3, H. Renssen4, N. Riedwyl2, A. Timmermann5, E. Xoplaki2, and H. Wanner2
1
Institut d’Astronomie et de G ´eophysique G. Lemaˆıtre, Universit´e catholique de Louvain, 2 Chemin du Cyclotron, 1348 Louvain-la-Neuve, Belgium
2
Institute of Geography and NCCR Climate, University of Bern, Hallerstrasse 12, 3012 Bern, Switzerland
3
Department of Meteorology and Earth and Environmental Systems Institute (EESI), Pennsylvania State University, University Park, PA16 802-5013, USA
4
Faculty of Earth and Life Sciences, Vrije Universiteit Amsterdam, De Boelelaan 1085, 1081 HV Amsterdam, The Netherlands
5
IPRC, SOEST, University of Hawaii, 2525 Correa Road, Honolulu, HI 96 822, USA Received: 24 April 2006 – Accepted: 24 May 2006 – Published: 21 June 2006 Correspondence to: H. Goosse (hgs@astr.ucl.ac.be)
CPD
2, 285–314, 2006The origin of the European “Medieval Warm Period” H. Goosse et al. Title Page Abstract Introduction Conclusions References Tables Figures J I J I Back Close
Full Screen / Esc
Printer-friendly Version Interactive Discussion
Abstract
Using a combination of proxy records and results of a three dimensional climate model, we show that European summer temperatures roughly a millennium ago were compa-rable to those of the late 20th century. Those two relatively mild periods are separated by a rather cold era, supporting the existence of a summer “Medieval Warm Period” in
5
Europe. The long-term temperature history appears to result from the superposition of various anthropogenic forcings, the summer cooling associated with changes in land-use over the last 1000 years having the same magnitude as the net warming due to the combined increase in greenhouse gas concentration and in sulphate aerosols during the last 200 years. Volcanic and solar forcing plays a weaker role in this comparison
10
between the late 20th century and the early second millennium. Evidence for winter is more equivocal. The forced response in the model displays a clear temperature maxi-mum at the end of the 20th century but the uncertainties are too large to state that this period is the warmest of the past millennium in Europe in winter.
1 Introduction
15
The analysis of climate variations during the past millennium can help to establish whether or not late 20th century warmth is unusual in a long-term context. Such an analysis can, in turn, help inform any determination of the relative roles of human ac-tivities and natural processes to the recent observed warming (Jones and Mann, 2004; Luterbacher et al., 2004; Moberg et al., 2005; Osborn and Briffa, 2006). At the
North-20
ern Hemisphere scale, the available annual mean temperature reconstructions reveal that the end of the 20th century has been likely the warmest period of the past thou-sand years (Jones and Mann, 2004; Moberg et al., 2005; Osborn and Briffa, 2006). The increase of atmospheric greenhouse gas concentrations over the past two cen-turies appears to have played an essential role in this recent warming (Tett et al. 1999;
25
CPD
2, 285–314, 2006The origin of the European “Medieval Warm Period” H. Goosse et al. Title Page Abstract Introduction Conclusions References Tables Figures J I J I Back Close
Full Screen / Esc
Printer-friendly Version Interactive Discussion
EGU
By contrast, some regions, such as Europe, may have exhibited similar seasonal warmth roughly one thousand years ago, although the geographical extent of the warmth during this period was smaller than during the 20th century (Lamb, 1965; Hughes and Diaz, 1994; Bradley et al., 2003; Osborn and Briffa, 2006). This has led to the introduction of the term “Medieval Warm Period” or “Medieval Warm Epoch”,
5
which originated from the examination of primarily western European documentary proxy evidence (Lamb, 1965). The underlying cause for this apparent warmth in Europe has remained unclear. Furthermore, as it preceded the modern rise in anthropogenic greenhouse gas concentrations, the existence of such a past period of warmth pro-vides a classical counterargument against anthropogenic impacts on modern climate
10
change. In the present study, we describe a plausible solution to this conundrum. In a larger framework, it is also important to analyze past temperature variations at the regional scale (e.g., European region) because many human activities, human health, phenological aspects and climate extremes are not influenced by hemispheric-scale, annual mean temperature but by the regional variations during the various
sea-15
sons (Berger and McMichael, 1999; Luterbacher et al., 2004; Thomas et al., 2004; Xoplaki et al., 2005). Analyses at regional scales are often hampered by the paucity of available data, and by a high degree of spatial and temporal variability which tends to obscure any underlying climate change signal. However, recent continental-scale sea-sonal multi-proxy-based climate reconstructions spanning the past centuries have been
20
performed (Luterbacher et al., 2004; Xoplaki et al., 2005; Guiot et al., 2005). Moreover, simulations of European-scale temperature change can now be obtained using climate models driven by estimated past radiative forcing changes. This provides the possibil-ity to analyze the causes of past seasonal temperature changes in Europe, including the enigmatic European “Medieval Warm Period” of roughly one thousand years ago.
25
While climate reconstructions are required to estimate the level of past climate vari-ability, they can not be used directly to assess the physical causes of the recorded temperature variations. For this purpose, climate model simulations that are forced by estimates of past natural and anthopogenic radiative perturbations may be used.
CPD
2, 285–314, 2006The origin of the European “Medieval Warm Period” H. Goosse et al. Title Page Abstract Introduction Conclusions References Tables Figures J I J I Back Close
Full Screen / Esc
Printer-friendly Version Interactive Discussion
Therefore, we apply here the ECBILT-CLIO-VECODE global climate model of interme-diate complexity to identify the causes of European climate change over the past mil-lennium. A brief description of the model and forcing is provided in Sect. 2. In addition to the classical model-data comparison, we also use the technique recently proposed by Goosse et al. (2006) to obtain an estimate of the state of the climate system that is
5
compatible with the real observed changes as well as with model physics and forcing in Sect. 3. Section 4 is devoted to a description of the climate of the past millennium over Europe while Sect. 5 investigates the causes of the simulated changes. In Sect. 6, the regional distribution of the signal is analysed, before the conclusions.
2 Model and forcing description
10
The version of the model ECBILT-CLIO-VECODE used here is identical to the one used in some recent studies (Goosse et al., 2005a, b; Renssen et al., 2005; Goosse et al., 2006), but a brief description is given here for the readers’ convenience. The atmospheric component is ECBILT2 (Opsteegh et al., 1998), a T21, 3-level quasi-geostrophic model. The oceanic component is CLIO3 (Goosse and Fichefet, 1999)
15
that is made up of an ocean general circulation model coupled to a comprehen-sive thermodynamic-dynamic sea ice model. ECBILT-CLIO is coupled to VECODE, a dynamic global vegetation model that simulates dynamics of two main terrestrial plant functional types, trees and grasses, as well as desert (Brovkin et al., 2002). More information about the model and a complete list of references is available at
20
http://www.knmi.nl/onderzk/CKO/ecbilt-papers.html.
We have performed a total of 125 simulations with the model driven by both nat-ural and anthropogenic forcings (Table 1). An existing ensemble of 115 simulations (Goosse et al., 2005b, 2006), covering at least the period 1001 AD-2000AD, is first presented (35 simulations starting in 1AD, 30 starting in 851 AD and 50 starting in
25
1001 AD). The forcing due to variations in orbital parameters follows Berger (1978) and the observed evolution of greenhouse gases is imposed over the whole simulated
CPD
2, 285–314, 2006The origin of the European “Medieval Warm Period” H. Goosse et al. Title Page Abstract Introduction Conclusions References Tables Figures J I J I Back Close
Full Screen / Esc
Printer-friendly Version Interactive Discussion
EGU
period. Furthermore, the influence of sulphate aerosols due to anthropogenic activity is taken into account during the period 1850–2000 AD through a modification of surface albedo (Charlson et al., 1991). In ECBILT-CLIO-VECODE, we only take into account the direct effect of aerosols. This forcing is thus probably underestimated, but given the uncertainty in the indirect aerosol forcing it is difficult to quantify the magnitude of
5
this underestimation. In addition, the forcing due to changes in land-use is applied here through modifications in the surface albedo, which is the primary effect of land cover change (Matthews et al., 2004). Furthermore, the evolution of solar irradiance and the effect of volcanism are prescribed using different combinations of the available reconstructions, in order to include the uncertainties associated with those forcings
10
(Table 1). The elements of an ensemble differ only in their initial conditions which were extracted from previous experiments covering the past millennia. The different initial conditions represent climate states separated by 150 years. Due to the fact that each of the ensemble members generates an independent realization of internal climate variability, computing the ensemble mean filters out internal variability and leaves the
15
joint response to the external forcing. (See Goosse et al., 2005b for more details as well as for a discussion of the impact of the choice of the reconstruction of the solar and volcanic forcing on global surface temperature).
Unfortunately, the past evolution of land use is not precisely known and, to our knowl-edge, comprehensive reconstructions of crop area are only available back to 1700 AD
20
for Europe (Ramankutty and Foley, 1999; Goldewijk, 2001). In the 115 simulations described above, we follow for the earlier period the scenario used in a recent inter-comparison exercise (Brovkin et al., 2006) that assumes a linear increase of crop area from zero in 1000 AD to the value reconstructed for 1700 AD. This is of course a strong simplification. In particular, it is well known that, in a large number of regions
25
of France, Belgium, Netherlands, Germany, which are among the countries where the largest changes had occurred in Europe in pre-industrial times, deforestation was par-ticularly intense between 1000 and 1250 AD and weaker during the two following cen-turies (Goudie, 1993; Simmons, 1996; Steurs, 2004; Guyotjeannin, 2005). In order
CPD
2, 285–314, 2006The origin of the European “Medieval Warm Period” H. Goosse et al. Title Page Abstract Introduction Conclusions References Tables Figures J I J I Back Close
Full Screen / Esc
Printer-friendly Version Interactive Discussion
to estimate the impact of those uncertainties in the timing of land-cover changes, we have tested here another scenario in a new ensemble of 10 experiments. The crop fraction increases first linearly during the period 1000–1250 AD, reaching in 1250 AD the value imposed in 1450 AD in the standard scenario (i.e., representing enhanced deforestation during the period 1000–1250 AD). It remains constant during the period
5
1250–1450 AD and then follows the standard scenario. In those experiments (here-after referenced as group H, Table 1), the same solar and volcanic forcing are used as in experiments of group D. The comparison of the two ensembles provides thus a direct estimate of the impact of the uncertainties in past land-cover changes. As expected, in the new set of experiments, the ensemble mean temperature tends to be lower during
10
the period 1000–1450 AD. The maximum of the difference occurs in summer, around 1300 AD and reaches 0.1◦C (Fig. 1).
Furthermore, in the framework of this study, additional ensembles of experiments covering the period 1001–2000 AD are performed with ECBILT-CLIO-VECODE driven by only one forcing at a time in order to analyze the role of the various components
15
of the forcing. For each forcing, an ensemble of 10 experiments has been launched, corresponding thus to 60 new experiments. Here, the land use change forcing includes the so-called biogeophysical aspects, i.e. the one related to the changes in the physical characteristics of the surface. The biochemical part of the forcing, i.e. the changes in greenhouse gas concentration due to changes in land use, are taken into account in
20
the run with greenhouse gas forcing since, as we do not have a carbon cycle model, it is not possible to disentangle the contribution of deforestation from the other ones.
ECBILT-CLIO-VECODE has a relatively weak climate sensitivity, with a 1.8◦C in-crease in global mean temperature in response to a doubling of atmospheric CO2 concentration. The global-mean response of the model to the forcing applied is thus
25
generally in the lower range of the response that would be obtained by atmosphere-ocean general circulation models (AOGCMs) if they were forced by a similar forcing (Goosse et al., 2005b). This is to a large extent due to the weak changes simulated in tropical area while at mid-latitude the response ECBILT-CLIO-VECODE is closer to the
CPD
2, 285–314, 2006The origin of the European “Medieval Warm Period” H. Goosse et al. Title Page Abstract Introduction Conclusions References Tables Figures J I J I Back Close
Full Screen / Esc
Printer-friendly Version Interactive Discussion
EGU
mean of AOGCMs.
The comparison of the results of ECBILT-CLIO-VECODE over the past millennium with various proxy records has shown that the model is able to reproduce the main characteristics of the reconstructed changes in the extra-tropics. Of particular interest for this study, the simulated variance over the last 500 years in Europe is very close to
5
the one of the reconstruction of (Luterbacher et al., 2004) for summer, winter as well as for annual mean (Goosse et al., 2005a).
3 Selection of the best pseudo simulation and estimation of related uncertainty
For the analyses of temperature changes over Europe and for model data compari-son we use here two large-scale reconstructions (Luterbacher et al., 2004; Guiot et
10
al., 2005 ) as well as reconstructions of temperature in summer for the Low Countries (i.e. Belgium and Netherlands) (Van Engelen et al., 2001; Shabalova and Van Enge-len, 2003), the Czech Lands (Br `azdil, 1996), Western Russia (Klimenko et al., 2001), Fennoscandia (Briffa et al., 1992), Swiss alpine regions (B¨untgen et al., 2005) and Burgundy (Chuine et al., 2004) and in winter in the Low Countries (Van Engelen et
15
al., 2001; Shabalova and Van Engelen, 2003), the Czech Lands (Br `azdil, 1996), and Western Russia (Klimenko et al., 2001).
The difference between those reconstructions and an individual member of the en-semble of simulations could be due to a non-climatic signal recorded in the proxy as well as to uncertainties in the forcing or in the model formulation and to different
real-20
izations of the internal variability of the system in the model and in the real world. The latter source of discrepancy can be evaluated by plotting the range of the ensemble of simulation (Goosse et al., 2005a, b). If the reconstruction is in this range, it means that at least some simulations are compatible with the reconstruction.
Nevertheless, it is possible to go a step forward as described by Goosse et al. (2006),
25
who propose to select among the ensemble of simulations the one that is the closest to the available reconstructions for a particular period (typically between 1 and 50 years).
CPD
2, 285–314, 2006The origin of the European “Medieval Warm Period” H. Goosse et al. Title Page Abstract Introduction Conclusions References Tables Figures J I J I Back Close
Full Screen / Esc
Printer-friendly Version Interactive Discussion
This is achieved by choosing the simulation that minimizes a cost function evaluated by computing the weighted sum of the squares of the difference between the value provided by the reconstruction and the simulated value in the model grid box(es) that contains the location of the proxy-record. The cost function measures thus the misfit between model results and proxy records. If the cost function is sufficiently low, the
5
selected simulation is then compatible with the reconstruction, with model physics and with the forcing used for the particular period. For plotting purposes, it is then possible to group the various states selected for all the periods of interest in order to obtain the best “pseudo simulation”. Although the physical interpretation of some low frequency changes could be difficult with this technique, it has been shown that it can be efficiently
10
used to provide temperature changes averaged over regions where a sufficiently large number of proxy-record is available (Goosse et al., 2006). It thus complementary to large-scale reconstructions obtained using statistical methods.
The interest of this method has been assessed in (Goosse et al., 2006) for test cases. Here, we apply it to European temperatures, using all the available information. In
15
particular, this technique is used here to show first that it is possible to find one member of the ensemble that is consistent with the proxy records for any period, second to reconstruct the temperature evolution averaged over Europe during the past millennium and third to provide an estimate of the contribution of internal variability in the observed changes.
20
In the present framework, the cost function will be evaluated using the reconstruc-tions listed above. All the individual reconstruction have the same weight in the evalu-ation of the cost function while reconstructions at the European scale have a weight 5 times stronger to take into account that they are derived from a compilation of a larger data set. As discussed in Goosse et al. (2006), the results are not sensitive to the
25
selection of those weights.
The selected proxy records provide a sufficiently dense network to give useful infor-mation at the European scale. This could be illustrated by performing a test in which only local and regional proxy records are used to constrain model results but not the
CPD
2, 285–314, 2006The origin of the European “Medieval Warm Period” H. Goosse et al. Title Page Abstract Introduction Conclusions References Tables Figures J I J I Back Close
Full Screen / Esc
Printer-friendly Version Interactive Discussion
EGU
large-scale reconstructions. In this case, the best pseudo-simulation, using 25-year averages, has a correlation with the reconstruction of Luterbacher et al. (2004) of 0.43 and 0.66 over the period 1500–2000 for summer and winter mean, respectively. Those values are similar or higher than the correlation of the individual proxies with local tem-perature during the last 150 years. They are also much higher than the correlation
5
between Luterbacher et al. (2004) and individual members of the ensemble that have values of 0.15 and 0.41 for summer and winter mean, respectively. This indicates that the technique is useful to get a better agreement between model results and the observed evolution at European scale. Of course, when all the proxy records and re-constructions are used to evaluate the cost function, the correlation between the best
10
pseudo-simulation and the reconstruction of Luterbacher et al. (2004) is even higher, with values of 0.88, and 0.92 over the period 1500–2000 for summer and winter mean, respectively, using 25-year averages.
In order to estimate the uncertainties associated with the evaluation of the best sim-ulation, we have repeated the procedure used to obtain the best pseudo-simulation
15
removing one proxy at a time in the computation of the cost function (Fig. 2). This pro-vides then a total set of 13 alternative best pseudo-simulations. The standard deviation of those 13 time series reaches 0.11◦C in summer and 0.16◦C in winter at the beginning of the second millennium when the uncertainties in the proxies are large (i.e. 82% and 64% of the standard deviation of the whole ensemble), while the value of this standard
20
deviation is at least a factor three smaller at the end of the simulations because of the better quality of the data. Those values will be used when discussing the uncertainties associated to the best pseudo-simulation (Fig. 6). The finite size of our ensemble of simulations could also lead to uncertainties in the selection of the best model state (Goosse et al., 2006). Nevertheless, the magnitude of this term is smaller than the one
25
related to the choice of proxies illustrated above and will thus not be included in our discussions.
CPD
2, 285–314, 2006The origin of the European “Medieval Warm Period” H. Goosse et al. Title Page Abstract Introduction Conclusions References Tables Figures J I J I Back Close
Full Screen / Esc
Printer-friendly Version Interactive Discussion
4 Climate of the past millennium averaged over Europe
European surface air temperatures have risen sharply during the late 20th century, with a larger response in winter than in summer (Fig. 3) (Luterbacher et al., 2004; Jones et al., 2003). This induces a weakening of the seasonal range (defined as the difference between summer and winter temperatures). For the mean of the ensemble of 125
sim-5
ulations, this decrease reaches 0.5◦C in Europe since the 19th century (Fig. 3c). Those model results are in very good agreement with a land area European (25◦W to 40◦E and 35◦N to 70◦N) temperature reconstruction (Luterbacher et al., 2004) covering the last 500 years.
The ensemble mean summer and winter temperatures also display a long-term
cool-10
ing trend from the beginning of the second millennium into the 19th century. The simu-lated cooling amounts to 0.3◦C in winter and 0.4◦C in summer. A recent reconstruction for European summer (April–September mean) climate (Guiot et al., 2005), represent-ing the area of 10◦W–20◦E, 35◦N–55◦N for the period from 1100 AD to present day, is in the range of changes simulated within the ensemble of simulations. However,
15
in contrast to model results, this reconstruction reveals a relatively stable summer cli-mate without any indications for anomalous medieval summer warmth (Fig. 3a). On the other hand, available independent European regional proxy data (Fig. 4) exhibit a clearer trend towards warmer summer and winter temperatures during the period 1000–1300 than during the period 1500–1850. In particular, some of the
reconstruc-20
tions document warm climate conditions in Europe around 1000 AD that were similar to the late 20th century.
The best pseudo-simulation, which selects the model states that have the best agreement with all the proxy records, is very close to Luterbacher et al. (2004) for the last 500 years (Fig. 3). For the period 1000–1300, it provides an average over
25
Europe that is larger than the one of Guiot et al. (2005), but the model results agree well at local/regional scale with the proxy records (Fig. 5). Those proxy records and the best pseudo-simulation indicate thus relatively mild conditions in Europe during the
CPD
2, 285–314, 2006The origin of the European “Medieval Warm Period” H. Goosse et al. Title Page Abstract Introduction Conclusions References Tables Figures J I J I Back Close
Full Screen / Esc
Printer-friendly Version Interactive Discussion
EGU
beginning of the second millennium. It should however be noted that the uncertainty of the reconstructions is particularly large during the early stages of the reconstruc-tions. In particular, the amount of documentary proxy information (Br ´azdil et al., 2005) decreases back in time with larger associated uncertainties. Hence, an interpretation of these early records has to consider the relative uncertainty in terms of phase and
5
amplitude.
5 Role of the forcings and internal variability
Additional experiments performed with ECBILT-CLIO-VECODE driven by only one forc-ing at a time are used to compare the simulated temperatures durforc-ing the late 20th century with the ones of the beginning of the 19th century, which is one of the coldest
10
periods for the ensemble mean in Europe, and of the beginning of the 11th century, which is a relatively warm period (Fig. 6). This comparison reveals that, in ECBILT-CLIO-VECODE, the recent warming is mainly due to the increase of atmospheric greenhouse gas concentrations while sulphate aerosol forcing reduces the warming significantly, in good agreement with previous modelling studies (Mitchell and Johns,
15
1997; Tett et al., 1999; Stott et al., 2000; Andreae et al., 2005 ). This cooling effect of the aerosols is larger in summer, as it mainly influences the net solar flux at the surface (Mitchell and Johns, 1997). The late 20th century reduction of the annual cycle am-plitude is thus mostly due to the reduced summer warming effect of the aerosols and the increased winter warming triggered by greenhouse gases and amplified by positive
20
climate feedbacks, such as the snow-albedo feedback (e.g., Manabe et al., 1992). When comparing the early millennium and the late 20th century (Fig. 6b) a third anthropogenic radiative forcing – land use change – plays a dominant role. Indeed, because of the large-scale changes in land use that occurred in Europe during the pre-industrial times, the simulated European temperature has decreased during the past
25
millennium by 0.5◦C in summer and 0.4◦C in winter. As a consequence, the total effect of all anthropogenic forcings is slightly negative in summer (though not significant at
CPD
2, 285–314, 2006The origin of the European “Medieval Warm Period” H. Goosse et al. Title Page Abstract Introduction Conclusions References Tables Figures J I J I Back Close
Full Screen / Esc
Printer-friendly Version Interactive Discussion
the 90% level) while it reached 0.3◦C in winter in our simulations.
Solar and volcanic forcings have likely played a role in both global and regional changes observed during parts of the millennium (Robock, 2000; Shindell et al., 2001; Luterbacher et al., 2004; Wagner and Zorita 2005; Raible et al. 2006). However, using the forcing selected here, they could not have caused the simulated temperature di
ffer-5
ences between the late 20th century and the period 1025–1050, in particular because both periods display a relatively high solar irradiance. Solar and volcanic forcings ap-pears to have a larger role to explain the difference between the late 20th century and the beginning of the 19th century. Indeed, they both tend to reinforce the effect of the greenhouse gas forcing, which is clearly the dominant forcing during this period.
10
Finally, on those timescales, the role of orbital forcing is also weak for Europe in our simulations, although its effect could be significant at large scales for specific months (Bauer and Claussen, 2006).
Except for the response associated with greenhouse gas forcing, the model’s internal variability (measured by the standard deviation of the ensemble around the ensemble
15
mean) is of the same order of magnitude or larger than the response to individual forcing (Fig. 6). As a consequence, internal variability explains an important part of the observed variability and could mask the response to external forcing. This is clearly occurring in summer, the difference between the modelled response to the forcing between the late 20th century and the beginning of the second millennium being as low
20
as 0.1 standard deviation of the ensemble, for 25-year averages. Those two periods must thus be considered as having similar summer temperatures.
In winter, the difference in the forced response between the periods 1976–2000 and 1026–1050 is larger than in summer as it amounts to 1.0 standard deviation of the internal ensemble variability. When using the available proxy records to derive the best
25
pseudo-simulation, the estimate of the range of model internal variability is reduced by 36%. The difference between those two periods reaches then 1.3 times the stan-dard deviation of the best pseudo-simulation. This indicates that, in winter, due to the large warming during the 20th century, the simulated forced response of the system
CPD
2, 285–314, 2006The origin of the European “Medieval Warm Period” H. Goosse et al. Title Page Abstract Introduction Conclusions References Tables Figures J I J I Back Close
Full Screen / Esc
Printer-friendly Version Interactive Discussion
EGU
reached a clear maximum at the end of the second millennium. Nevertheless, based on our results, the level of internal variability is still too large to reject at the 90% confi-dence level the null-hypothesis that European winter temperatures during the late 20th century were similar from those of the early second millennium.
On the other hand, compared to the early second millennium, the difference in forced
5
signal between the early 19th century and the late 20th century is more pronounced, because several forcings tend to induce a perturbation of the same sign and the land-use changes were smaller between the 19th and 20th century. For the 25-year mean, the difference in the ensemble mean reaches 2.1 and 2.5 standard deviations of the ensemble for summer and winter, respectively. This is in good agreement with recent
10
studies that were able to detect the warming effect of increasing greenhouse gas con-centrations during the twentieth century in Europe (Zwiers and Zhang, 2003; Stott, 2003).
6 Regional distribution of the temperature response
The geographical distribution of the response to an external forcing is largely influenced
15
by internal dynamics (e.g., Manabe et al., 1992). On the one hand, because of the feedback related to snow and ice, the response to a forcing tends to be larger at high latitudes in winter than at low latitudes. On the other hand, processes mainly related to the freshwater cycle, in particular to changes in soil moisture, tend to amplify the summer response in Southern Europe. Consequently, the reduction in the seasonal
20
contrast during the last centuries is large at high latitudes while in Southern Europe the decrease in the amplitude of the annual cycle is smaller (Fig. 7). The model displays a pattern similar to the one found by Luterbacher et al. (1994) but the amplitude is larger for the latter. However, we must take into account that we are comparing an ensemble mean for the model and a particular realisation of the climate evolution in the
25
reconstruction. We have used in this model-data comparison relatively long periods, in order to limit the amplitude of internal variability compared to the forced one, but this
CPD
2, 285–314, 2006The origin of the European “Medieval Warm Period” H. Goosse et al. Title Page Abstract Introduction Conclusions References Tables Figures J I J I Back Close
Full Screen / Esc
Printer-friendly Version Interactive Discussion
still precludes a detailed quantitative comparison. Nevertheless, the changes in the observed seasonal contrast shown in Fig. 7a are larger than two standard deviations of the seasonal contrast for 50-year averages in all the land areas between 5◦–40◦E and 40◦–60◦N. The observed reduction is thus also a robust feature of the reconstruction.
In addition to the role of internal dynamics, the various forcings also have an impact
5
on the geographical distribution of the response. In particular, the forcing due to land-use changes is strong in mid-latitudes, particularly in France and Germany. This results in a larger cooling in those regions during the preindustrial period. As the response to this forcing tends to be stronger in summer, this is also implies a reduction of the seasonal contrast during this period in those regions (Fig. 7c). The aerosol forcing has
10
also a clear spatial pattern with a larger cooling at mid-latitudes, downstream of the main industrial areas in Europe (Mitchell and Johns, 1997).
As a consequence, an analysis of the difference in the ensemble mean response in ECBILT-CLIO-VECODE for different regions between the late 20th century and the beginning of the millennium (Fig. 8) shows a general warming in winter with a maximum
15
is Eastern Europe. In contrast, for summer, a weak warming is found only at high latitudes while the late 20th century is colder than the early second millennium in mid latitudes.
The model used here has a coarse resolution and includes some simplifications in order to be able to make a large number of long simulations. The local features should
20
thus not be considered as clearly robust features. The magnitude of the response is also influenced by the model sensitivity and by the uncertainties in the forcing applied. Nevertheless, as discussed above, the response at European scale, for each season, as well as the large scale distribution of the changes inside Europe appear consistent with observations, previous modelling work and with our current understanding of the
25
CPD
2, 285–314, 2006The origin of the European “Medieval Warm Period” H. Goosse et al. Title Page Abstract Introduction Conclusions References Tables Figures J I J I Back Close
Full Screen / Esc
Printer-friendly Version Interactive Discussion
EGU
7 Conclusions
In agreement with previous studies, our results show a clear increase in European temperature during the last 150 years. This is mainly caused by the warming effect of the increase in greenhouse gas concentrations, which is only partly compensated by the cooling effect associated with the increase in sulphate aerosol load. Nevertheless,
5
in contrast to hemispheric-scale annual temperatures, there is no compelling evidence from either empirical proxy evidence or model simulation results that late 20th cen-tury European summer temperatures were the highest of the past millennium. This is largely due to the local negative radiative forcing caused by land-cover changes. The impact of this forcing at hemispheric scale has been underlined in recent studies.
How-10
ever, because of the large deforestation in Europe, land-use changes imply a larger negative temperature anomaly over Europe than on a global scale (e.g., Bertrand et al., 2003; Bauer et al., 2003; Matthews et al., 2004; Feddema et al., 2005; Brovkin et al., 2006). The term “Medieval Warm Period”, of limited meaning at hemispheric scale (Jones and Mann, 2004; Bradley et al., 2003; Goosse et al., 2005a; Osborn and
15
Briffa, 2006), nonetheless thus appears reasonable as applied specifically to summer European temperatures, the region the term was originally applied to. In winter, our results are less definitive, and firm conclusions are not possible. Indeed, because of the large warming during the 20th century, the simulated forced response of the sys-tem reached a clear maximum at the end of the second millennium. Nevertheless, the
20
uncertainties are still too large to argue with a reasonable confidence that the highest winter temperatures of the past millennium were observed during this period.
The contribution of orbital forcing has been relatively small for the last 1000 years, leading to temperature changes smaller than 0.15◦C for all seasons. For the last 6000 years, however, a reduction of northern hemispheric summer insolation leads to a
sum-25
mer cooling for Europe of more than 1.5◦C as documented by a transient Holocene simulation performed with ECBILT-CLIO-VECODE (Renssen et al., 2005). The win-ter temperatures are more stable in the model. Therefore, on long time-scales too,
CPD
2, 285–314, 2006The origin of the European “Medieval Warm Period” H. Goosse et al. Title Page Abstract Introduction Conclusions References Tables Figures J I J I Back Close
Full Screen / Esc
Printer-friendly Version Interactive Discussion
the summer temperatures and seasonal contrast of European temperatures has been decreasing. This simulated summer temperature decrease is in good agreement with previous modelling studies (e.g., Masson et al., 1999) and with available proxy records over the European continent which generally exhibit a decrease of summer tempera-ture over the last 6000 years, except for the areas close to the Mediterranean regions
5
(e.g., Davies et al., 2003; Kim et al., 2004).
However, in the decades to come, the evolution of the European temperatures could be quite different since the forcings during the twenty-first century will be different from the ones experienced in the past. First, at the century time scale, the orbital forcing is very weak and can be neglected. Secondly, in Europe, a small reduction of crop area
10
and an increase in forest cover is expected, in contrast to the changes that occurred during the second millennium (e.g., Sitch et al., 2005). Finally, the concentration of greenhouse gases in the atmosphere will almost certainly continue to increase while the aerosol load will likely level off and even decrease (Andreae et al., 2005). As a consequence, the summer and winter European temperatures for the late 21st century
15
are anticipated to greatly exceed the warmth of the past century (R ¨ais ¨anen et al., 2005; D ´equ ´e et al., 2006), and thus any period of the past millennium.
Acknowledgements. The authors want to thank the scientists that send us their datasets.
H. Goosse is Research Associate with the Fonds National de la Recherche Scientifique (Bel-gium) and is supported by the Belgian Federal Science Policy Office. H. Renssen is sponsored
20
by the Netherlands Organization for Scientific Research (N.W.O). A. Timmermann is supported by the Japan Agency for Marine-Earth Science and Technology (JAMSTEC) through its spon-sorship of the International Pacific Research Center. J. Luterbacher, E. Xoplaki and N. Riedwyl are supported by the Swiss National Science Foundation (NCCR Climate). E. Xoplaki and J. Luterbacher were also financially supported he EU project SOAP. M. E. Mann was supported
25
CPD
2, 285–314, 2006The origin of the European “Medieval Warm Period” H. Goosse et al. Title Page Abstract Introduction Conclusions References Tables Figures J I J I Back Close
Full Screen / Esc
Printer-friendly Version Interactive Discussion
EGU
References
Andreae, M. O., Jones, C. D., and Cox, P. M.: Strong present-day aerosol cooling implies a hot future, Nature, 435, 1187–1190, 2005.
Bard, E., Raisbeck, G., You, F., and Jouzel, J.: Solar irradiance during the last 1200 years based on cosmogenic nuclides, Tellus, 52B, 985–992, 2000.
5
Bauer E., Claussen, M., Brovkin, V., and Huenerbein, A.: Assessing climate forc-ings of the Earth system for the past millennium, Geophys. Res. Lett., 30(6), 1276, doi:10.1029/2002GL016639, 2003.
Bauer, E. and Claussen, M.: Analyzing seasonal temperature trends in forced cli-mate simulations of the past millennium, Geophys. Res. Lett., 33(2), L02702,
10
doi:10.1029/2005GL024593, 2006.
Berger, A. L.: Long-term variations of daily insolation and Quaternary climatic changes, J. Atmos. Sci, 35, 2363–2367, 1978.
Berger, A., and McMichael, A. J.: Climate change and health: evidence and prospect, Euro-pean Review, 7(3), 395–412, 1999.
15
Bertrand, C., Loutre, M.-F., Crucifix, M., and Berger, A.: Climate of the last millennium: a sensitivity study, Tellus 54A, 221–244, 2002.
Bradley, R. S., Hughes, M. K., and Diaz, H. F.: Climate in Medieval time, Science 302, 404–405, 2003.
Br `azdil, R.: Reconstructions of past climate from historical sources in the Czech Lands, in:
20
Climatic Variations and Forcing Mechanisms of the Last 2000 Years, edited by: Jones, P. D., Bradley, R. S., Jouzel, J., NATO ASI Series, Springer, Berlin, Heidelberg, New York, 1996. Br `azdil, R., Pfister, C., Wanner, H., von Storch, H., and Luterbacher, J.: Historical climatology
in Europe – The State of the Art. Clim. Change, 70, 363–430, 2005.
Briffa, K. R., Jones, P. D., Bartholin, T. S., Eckstein, D., Schweingruber, F. H., Karl´en, W.,
Zetter-25
berg , P., and Eroren, M.: Fennoscandian summers from AD 500: temperature changes on short and long timescales, Clim. Dyn.,7, 111–119, 1992.
Brovkin, V., Bendtsen, J., Claussen, M., Ganopolski, A., Kubatzki, C., Petoukhov, V., and An-dreev, A.: Carbon cycle, vegetation and climate dynamics in the Holocene: experiments with the CLIMBER-2 model, Global Biogeochem. Cycles, 16, doi:10.1029/2001GB001662,
30
2002.
CPD
2, 285–314, 2006The origin of the European “Medieval Warm Period” H. Goosse et al. Title Page Abstract Introduction Conclusions References Tables Figures J I J I Back Close
Full Screen / Esc
Printer-friendly Version Interactive Discussion
H. D., Ramankutty, N., Schaeffer, M., and Sokolov, A.: Biogeophysical effects of historical land cover changes simulated by six Earth system models of intermediate complexity, Clim. Dyn., doi:10.1007/s00382-005-0092-6, 2006.
B ¨untgen, U., Esper, J., Frank, D. C., Nicolussi, K., and Schmidhalter, M.: A 1052-year tree-ring proxy for Alpine summer temperatures, Clim. Dyn., 25, 141–153, 2005.
5
Charlson, R. J. et al.: Perturbation of the Northern Hemisphere radiative balance by backscat-tering from anthropogenic sulfate aerosols, Tellus, 43AB, 152–163, 1991.
Chuine, I., You, P., Viovy, N., Seguin, B., Daux, V., and Le Roy Ladurie, E.: Grape ripening as a past climate indicator, Nature, 432, 289–290, 2004.
Crowley, T. J.: Causes of climate change over the past 1000 years, Science, 289, 270–277,
10
2000.
Crowley, T. J., Baum, S. K., Kim, K. Y., Hegerl, G. C., and Hyde, W. T.: Modeling ocean heat content changes during the last millennium, Geophys. Res. Lett., 30(18), 1932, 2003. Davis, B. A. S., Brewer, S., Stevenson, A. C., Guiot, J., and Data Contributors.: The temperature
of Europe during the Holocene reconstructed from pollen data, Quat. Science Rev., 22,
15
1701–1716, 2003.
D ´equ ´e et al.: Global high resolution versus Limited Area Model climate change projections over Europe: quantifying confidence level from Prudence results, Clim. Dyn., doi:10.1007/s00382-005-0052-1, 2006.
Feddema, J., Olseson, K. Bonan, G., Mearns, L., Washington, W., Meehl, G., and Nychka,
20
D. A.: Comparison of a GCM response to historical anthropogenic land cover change and model sensitivity to uncertainty in present-day land cover representation, Clim. Dyn., 25, 581–609, 2005.
Goldewijk, K. K.: Estimating global land use change over the past 300 years: The HYDE database, Global Biogeochem. Cycles, 15(2), 417–433, 2001.
25
Goosse, H. and Fichefet, T.: Importance of ice-ocean interactions for the global ocean circula-tion: a model study. J. Geophys. Res. 104, 23 337–23 355, 1999.
Goosse H., Renssen, H., Timmermann, A., and Bradley, R. S.: Internal and forced climate variability during the last millennium: a model-data comparison using ensemble simulations, Quat. Science Rev., 24, 1345–1360, 2005a.
30
Goosse, H., Crowley, T., Zorita, E., Ammann, C., Renssen, H., and Driesschaert, E.: Mod-elling the climate of the last millennium: What causes the differences between simulations?, Geophys. Res. Lett., 32, L06710, doi:10.1029/2005GL22368, 2005b.
CPD
2, 285–314, 2006The origin of the European “Medieval Warm Period” H. Goosse et al. Title Page Abstract Introduction Conclusions References Tables Figures J I J I Back Close
Full Screen / Esc
Printer-friendly Version Interactive Discussion
EGU
Goosse, H., Renssen H., Timmermann, A., Bradley, R. S., and Mann, M. E.: Using paleoclimate proxy-data to select optimal realisations in an ensemble of simulations of the climate of the past millennium, Clim. Dyn., doi:10.1007/s00382-006-0128-6 (http://dx.doi.org/10.1007/
s00382-006-0128-6), 2006.
Goudie, A.: The human impact on the natural environment, Blackwell Publishers, Oxford, UK,
5
forth edition, 454 pages, 1993.
Guiot, J., Nicault, A., Rathgeber, C., Edouard, J. L., Guibal, F., Pichard, G., and Till, C.: Last-millennium summer-temperature variations in Western Europe based on proxy-data, The Holocene, 15(4), 489–500, 2005.
Guyotjeannin, O.: Atlas de l’histoire de France, IXe–XVe si `ecle, la France m ´edi ´evale, Editions
10
Autrement, 2005.
Hegerl, G. C., Crowley, T. J., Baum, S. K. Kim, K.-Y., and Hyde, W. T.: Detection of volcanic, solar and greenhouse gas signals in paleo-reconstructions of Northern Hemispheric temper-ature, Geophys. Res. Lett. 30(5), 1242, doi:10.1029/2002GL016635, 2003.
Hughes, M. K. and Diaz, H. F.: Was there a “Medieval Warm Period”, and if so, where and
15
when?, Clim. Change, 26, 109—142, 1994.
Jones, P. D. and Mann, M. E.: Climate over past millennia, Rev. Geophys., 42(2), RG2002, doi:10.1029/2003RG000143, 2004.
Jones, P. D, Briffa, K. R., and Osborn, T. J.: Changes in the Northern Hemisphere annual cycle: implications for paleoclimatology, J. Geophys. Res, 108(D18), 4588,
20
doi:10.1029/2003JD003695, 2003.
Kim, J. H., Rimbu, N., Lorenz, S. J., Lohmann, G. , Nam, S. I., Schouten, S., R ¨uhlemann, C., Schneider, R. R.: North Pacific and North Atlantic sea-surface temperature variability during the Holocene, Quat. Science Rev., 23, 2141–2154, 2004.
Klimenko, V. V., Klimanov, V. A., Sirin, A. A., and Sleptsov, A. M.: Climate changes in Western
25
European Russia in the late Holocene, Doklady Earth Sciences, 377, 2, 190–194, 2001. Lamb, H. H.: The early Medieval warm epoch and its sequel, Palaeogeography,
Palaeoclima-tology, Palaeoecology, 1, 13–37, 1965.
Lean J., Beer, J., and Bradley, R.: Reconstruction of solar irradiance since 1610: implications for climate change, Geophys. Res. Lett., 22, 1591–1594, 1995.
30
Luterbacher, J., Dietrich, D., Xoplaki, E., Grosjean, M., and Wanner, H.: European seasonal and annual temperature variability, trends, and extremes since 1500, Science, 303(5663), 1499–1503, 2004.
CPD
2, 285–314, 2006The origin of the European “Medieval Warm Period” H. Goosse et al. Title Page Abstract Introduction Conclusions References Tables Figures J I J I Back Close
Full Screen / Esc
Printer-friendly Version Interactive Discussion
Manabe S., Spelman, M. J., and Stouffer, R. J.: Transient responses of a coupled atmosphere-ocean model to gradual changes of atmospheric CO2, II. Seasonal response, J. Climate, 4, 105–126, 1992.
Masson, V., Cheddadi, R., Braconnot, P., Joussaume, S., Texier, D., and PMIP participants: Mid-Holocene climate in Europe: what can we infer from PMIP model-data comparisons?,
5
Clim. Dyn., 15, 163–182, 1999.
Matthews, H. D., Weaver, A. J., Meissner, K. J., Gillet, N. P., and Eby, M.: Natural and anthro-pogenic climate change: incorporating historical land cover change, vegetation dynamics and the global carbon cycle., Clim. Dyn., 22, 461–479, 2004.
Mitchell, J. F. B. and Johns, T. C.: On modification of global warming by sulphate aerosols, J.
10
Climate, 10, 245–267, 1997.
Moberg, A., Sonechkin, D. M., Holmgren, K., Datsenko, N. M., and Karl ´en, W.: Highly variable northern hemisphere temperatures reconstructed from low- and high-resolution proxy data, Nature, 433, 613–617, 2005.
Opsteegh, J. D., Haarsma, R. J., Selten, F. M., and Kattenberg, A.: ECBILT: A dynamic
alter-15
native to mixed boundary conditions in ocean models, Tellus, 50A, 348–367, 1998.
Osborn, T. J. and Briffa, K. R.: The spatial extent of 20th-century warmth in the context of the past 1200 years, Science 311, 841–844, 2006.
Osborn, T. J. and Briffa, K. R.: The spatial extent of 20th-century warmth in the context of the past 1200 years, Science 311, 841–844, 2006.
20
Raible, C. C., Casty, C., Luterbacher, J., Pauling, A., Esper, J., Frank, D. C., B ¨untgen, U., Roesch, A. C., Tschuck, P., Wild, M., Vidale, P-L., Sch ¨ar, C., and Wanner, H.: Climate Variability – Observations, Reconstructions, and Model Simulations for the Atlantic-European and Alpine region from 1500–2100 AD, Climatic Change, (in press), 2006.
R ¨ais ¨anen, J. et al.: European climate in the late twenty-first century: regional simulations with
25
two driving global models and two forcing scenarios, Clim. Dyn., 22, 13–31, 2005.
Ramankutty, N. and Foley, J. A.: Estimating historical changes in global land cover: croplands from 1700 to 1992, Glob. Biogeoch. Cycles, 13(4), 997–1027, 1999.
Renssen, H., Goosse, H., Fichefet, T., Brovkin, V., Driesschaert, E., and Wolk, F.: Simulating the Holocene climate evolution at northern high latitudes using a coupled atmosphere-sea
30
ice-ocean-vegetation model, Clim. Dyn., 24, 23–43, 2005.
Robock, A.: Volcanic eruptions and climate, Rev Geophys, 38, 191–219, 2000.
CPD
2, 285–314, 2006The origin of the European “Medieval Warm Period” H. Goosse et al. Title Page Abstract Introduction Conclusions References Tables Figures J I J I Back Close
Full Screen / Esc
Printer-friendly Version Interactive Discussion
EGU
temperatures in the low countries, AD 764–1998, Climatic Change, 58, 219–242, 2003. Shindell, D. T., Schmidt, G. A., Mann, M. E., Rind, D., and Waple, A.: Solar forcing of regional
climate change during the Maunder Minimum, Science, 294, 2149–2152, 2001.
Simmons, I. G.: Changing the face of the Earth: Culture, Enviroment, History, Blackwell Pub-lishers, Oxford, UK, Second Edition, 464 pages, 1996.
5
Sitch, S., Brovkin, V., von Bloh, W. van Vuuren, D., Eickhout, B., and Ganopolski, A.: Impacts of future land cover changes on atmospheric CO2 and Climate. Global. Biogeochem. Cycles, 19, GB2013, doi:10.1029/2004GB002311, 2005.
Steurs, W.: in: Histoire du Brabant du Duch ´e `a nos jours, edited by: R. van Uyten, C. Bruneel, A. M., Koldeweij, A. W. F. M., van de Sande, J. A. F. M., van Oudheusden , Waadeurs
10
Uitgevers- Fondation de la ville brabanc¸onne, 73–77, 2004.
Stott, P. A., Tett, S. F. B., Jones, G. S., Allen, M. R., Mitchell, J. F. B, and Jenkins, G. J.: External control of 20th century temperature by natural and anthropogenic forcing, Science, 290, 2133–2137, 2000.
Stott, P. A.: Attribution of regional-scale temperature changes to anthropogenic and natural
15
causes, Geophys. Res. Lett., 30(14), 1728, doi:10.1029/2003GL017324, 2003.
Tett S. F. B., Stott, P. A., Allen, M. R., Ingram, W. J., and Mitchell, J. F. B.: Causes of twentieth-century temperature change near the Earth’s surface, Nature, 399, 569–572, 1999.
Thomas, C. D., Cameron, A., Green, R. E., Bakkenes, M., Beaumont, L. J., Collingham, Y. C., Erasmus, B. F. N., de Siqueira, M. F., Grainger, A., Hannah, L., Hughes, L., Huntley, B., van
20
Jaarsveld, A. S., Midgley, G. F., Miles, L., Ortega-Huerta, M. A., Peterson, A. T., Phillips, O. L., Williams, S. E.: Extinction risk from climate change, Nature, 427, 145–148, 2004. van Engelen, A. F. V, Buisman, J., and IJbnsen, F. A.: millennium of weather, winds and water
in the low countries, in history and climate: memories of the future?, edited by: Jones, P. D., Ogilvie, E. J., Davies, T. D, and Briffa, K. R., Kluwer Acad., Dordrecht, The Netherlands
25
,101–124, 2001.
Wagner, S. and Zorita, E: The influence of volcanic, solar and CO2forcing on the temperatures in the Dalton Minimum (1790–1830): a model study. Clim. Dyn., 25, 205–218, 2005.
Xoplaki, E., Luterbacher, J., Paeth, H., Dietrich, D., Steiner N., Grosjean, M., and Wanner, H.: European spring and autumn temperature variability and change of extremes over the last
30
half millennium, Geophys. Res. Lett., 32, L15713, doi:10.1029/2005GL023424, 2005. Zwiers, F. W. and Zhang, X.: Towards regional-scale climate change detection, J. Clim., 16,
CPD
2, 285–314, 2006The origin of the European “Medieval Warm Period” H. Goosse et al. Title Page Abstract Introduction Conclusions References Tables Figures J I J I Back Close
Full Screen / Esc
Printer-friendly Version Interactive Discussion
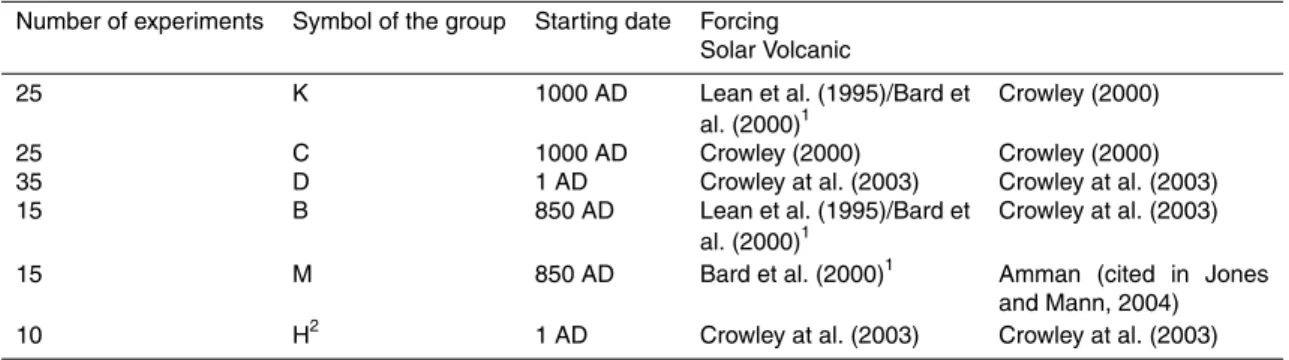
Table 1. Description of the experiments (updated from Goosse et al., 2005b).
Number of experiments Symbol of the group Starting date Forcing Solar Volcanic
25 K 1000 AD Lean et al. (1995)/Bard et
al. (2000)1
Crowley (2000)
25 C 1000 AD Crowley (2000) Crowley (2000)
35 D 1 AD Crowley at al. (2003) Crowley at al. (2003)
15 B 850 AD Lean et al. (1995)/Bard et
al. (2000)1
Crowley at al. (2003)
15 M 850 AD Bard et al. (2000)1 Amman (cited in Jones
and Mann, 2004)
10 H2 1 AD Crowley at al. (2003) Crowley at al. (2003)
1
We are using the reconstruction of Bard et al. (2000) scaled to match the Maunder Minimum irradiance reduction derived by Lean et al. (1995).
2
This new set of experiments uses the same solar and volcanic forcing as the one of group D but a different scenario for land-use changes that implies a faster deforestation rate during the period 1000–1250 AD.
CPD
2, 285–314, 2006The origin of the European “Medieval Warm Period” H. Goosse et al. Title Page Abstract Introduction Conclusions References Tables Figures J I J I Back Close
Full Screen / Esc
Printer-friendly Version Interactive Discussion
EGU
(a)
(b)
Time (year AD)
Fig. 1. Anomaly (in Kelvin) of the ensemble mean of (a) summer and (b) winter European
temperatures averaged over the simulations of group H (in red) and group D (in green). Those two groups of simulation only differ in the scenario used for land-use changes. The times series plotted are averages over 25 seasons.
CPD
2, 285–314, 2006The origin of the European “Medieval Warm Period” H. Goosse et al. Title Page Abstract Introduction Conclusions References Tables Figures J I J I Back Close
Full Screen / Esc
Printer-friendly Version Interactive Discussion
(a)
(b)
Fig. 2. Anomaly (in Kelvin) of (a) summer and (b) winter European temperatures in the 13 best
“pseudo simulations” obtained by constraining the model results with all the 12 proxy records or using all the subsets containing 11 proxy records. The times series plotted are averages over 25 seasons.
CPD
2, 285–314, 2006The origin of the European “Medieval Warm Period” H. Goosse et al. Title Page Abstract Introduction Conclusions References Tables Figures J I J I Back Close
Full Screen / Esc
Printer-friendly Version Interactive Discussion EGU (a) (b) (c)
Fig. 3. Proxy-based reconstructions of European temperature anomaly (in Kelvin) compared
with model results in(a) summer, (b) winter, and (c) the seasonal temperature range (winter
minus summer). The times series plotted are averages over 10 seasons or years. The red line corresponds to the mean over the 125 simulations while the grey lines are the ensemble mean plus and minus two standard deviations of the ensemble at decadal scale. The reconstructions are in green (Luterbacher et al., 2004) and blue (Guiot et al., 2005). The best pseudo simulation is represented by the orange line. The reference period is 1500–1980, i.e. the longest period common to all the reconstructions.
CPD
2, 285–314, 2006The origin of the European “Medieval Warm Period” H. Goosse et al. Title Page Abstract Introduction Conclusions References Tables Figures J I J I Back Close
Full Screen / Esc
Printer-friendly Version Interactive Discussion
(a)
(b)
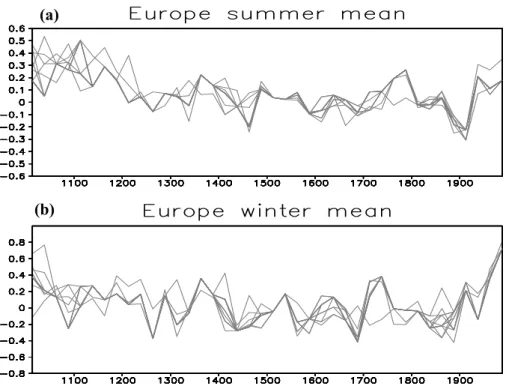
Fig. 4. Local and regional long proxy records of European seasonal temperatures (a) in
sum-mer and(b) in winter. The reference period is 1500–1980. Each proxy has been divided by its
standard deviation. The time series plotted are averages over 10 seasons and, in addition, a five-point running mean is applied. In (a), the red, green, dark blue, light blue, pink and orange curves are related to temperature variations in the Low Countries (Belgium and Netherlands), Czech Lands, Western Russia, Burgundy, Swiss alpine area and Fennoscandia, respectively. In (b) the red, green and dark blue curves are related to temperature variation in the Low Coun-tries (Belgium and Netherlands), Czech Lands and Western Russia respectively. The grey lines represent a mean over the records that go back to 1000 AD.
CPD
2, 285–314, 2006The origin of the European “Medieval Warm Period” H. Goosse et al. Title Page Abstract Introduction Conclusions References Tables Figures J I J I Back Close
Full Screen / Esc
Printer-friendly Version Interactive Discussion EGU (c) (d) (e) (f) (g) (b) (a)
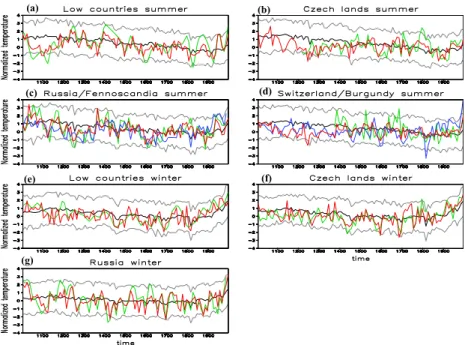
Fig. 5. Comparison of model results and proxy records in Europe. The times series plotted are
averages over 10 seasons. The reference period is 1500–1980 AD. Model results and proxy have been divided by their standard deviations. The black line corresponds to the mean over the 125 simulations while the grey lines are the ensemble mean plus and minus two standard deviations of the ensemble at decadal scale. Proxy records are in green and blue. Shown is the compilation of temperature in summer(a) for the Low Countries (Belgium and
Nether-lands),(b) the Czech Lands, (c) Western Russia in green and Fennoscandia in blue, (d) Swiss
alpine regions in blue and Burgundy in green and in winter in(e), the Low Countries (Belgium
and Netherlands), (f) the Czech Lands, and (g) Western Russia. The model states that are
the closest to all the available proxies are represented by the red lines (i.e., the best pseudo simulation). Regions that are very close to each other like Western Russia/Fennoscandia and Swiss alpine Region/Burgundy are shown on the same panel.
CPD
2, 285–314, 2006The origin of the European “Medieval Warm Period” H. Goosse et al. Title Page Abstract Introduction Conclusions References Tables Figures J I J I Back Close
Full Screen / Esc
Printer-friendly Version Interactive Discussion -0,5 -0,3 -0,1 0,1 0,3 0,5 0,7 0,9 1,1 1,3 In te rn a l Be st In te rn a l Greehous e gas Land Us e S u lphat e So la r V o lc anos Orbit al summer winter -0,8 -0,6 -0,4 -0,20,0 0,2 0,4 0,6 0,8 1,0 1,2 In te rn a l Be st int ernal Greehous e gas Land Us e S u lphat e So la r V o lc anos Oribital summer winter (a) (b)
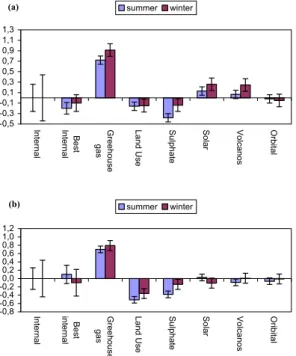
Fig. 6. Identification of the various contributions to the difference between simulated
temper-atures (in Kelvin) for the period 1976–2000 and(a) the period 1801–1825 and (b) the period
1025–1050. The range associated with the contribution of internal variability is given by two standard deviations of the ensemble of simulations around the ensemble mean. The best estimate of the internal variability is evaluated as the difference between the best pseudo-simulation and the ensemble mean, using the uncertainty on this best pseudo-pseudo-simulation. The contributions of the individual forcings are obtained by performing an ensemble of 10 exper-iments with only one of the 6 forcing studied. The error bar for those forcings is evaluated by computing two standard deviations of the difference between two 25-year periods in a long experiment without any change in external forcing, using an ensemble of 10 simulations.
CPD
2, 285–314, 2006The origin of the European “Medieval Warm Period” H. Goosse et al. Title Page Abstract Introduction Conclusions References Tables Figures J I J I Back Close
Full Screen / Esc
Printer-friendly Version Interactive Discussion EGU (a) (b) (c)
Fig. 7. Geographical distribution of the changes in seasonal range (summer minus winter)
between different periods. Shown is (a) the difference between the period 1950–2000 and 1500–1900 in the reconstruction of Luterbacher et al. (2004) and(b) in ECBILT-CLIO-VECODE
for the same periods and(c) in ECBILT-CLIO-VECODE for the difference between the period
CPD
2, 285–314, 2006The origin of the European “Medieval Warm Period” H. Goosse et al. Title Page Abstract Introduction Conclusions References Tables Figures J I J I Back Close
Full Screen / Esc
Printer-friendly Version Interactive Discussion (a)
(b)
Fig. 8. Difference between ensemble mean temperatures in 1976–2000 compared to 1025–