HAL Id: hal-03138091
https://hal.archives-ouvertes.fr/hal-03138091
Submitted on 11 Feb 2021
HAL is a multi-disciplinary open access
archive for the deposit and dissemination of
sci-entific research documents, whether they are
pub-lished or not. The documents may come from
teaching and research institutions in France or
abroad, or from public or private research centers.
L’archive ouverte pluridisciplinaire HAL, est
destinée au dépôt et à la diffusion de documents
scientifiques de niveau recherche, publiés ou non,
émanant des établissements d’enseignement et de
recherche français ou étrangers, des laboratoires
publics ou privés.
Distributed under a Creative Commons Attribution| 4.0 International License
Small Phytoplankton Shapes Colored Dissolved Organic
Matter Dynamics in the North Atlantic Subtropical
Gyre
Emanuele Organelli, Hervé Claustre
To cite this version:
Emanuele Organelli, Hervé Claustre. Small Phytoplankton Shapes Colored Dissolved Organic Matter
Dynamics in the North Atlantic Subtropical Gyre. Geophysical Research Letters, American
Geophys-ical Union, 2019, 46 (21), pp.12183-12191. �10.1029/2019GL084699�. �hal-03138091�
Emanuele Organelli1 and Hervé Claustre1
1
Sorbonne Université, CNRS, Laboratoire d'Océanographie de Villefranche, LOV, F‐06230, Villefranche‐sur‐Mer, France
Abstract
The North Atlantic subtropical gyre (NASTG) is a model of the future ocean under climate change. Ocean warming signals are hidden within the blue color of these clear waters and can be tracked by understanding the dynamics among phytoplankton chlorophyll ([Chl]) and colored dissolved organic matter (CDOM). In NASTG, [Chl] and CDOM are strongly correlated. Yet, this unusual correlation for open oceans remains unexplained. Here, we test main hypotheses by analyzing high spatiotemporal resolution data collected by Biogeochemical‐Argo floats between 2012 and 2018. The direct production of CDOM via phytoplankton metabolism is the main occurring mechanism. More importantly, CDOM dynamics strongly depend on the abundance of picophytoplankton. Ourfindings thus highlight the critical role of these small organisms under the ocean warming scenario. Picophytoplankton will enhance the production of colored dissolved compounds and, ultimately, impact on the ocean carbon cycle.Plain Language Summary
Colored dissolved organic matter (CDOM) is ubiquitous in aquatic ecosystems. CDOM absorbs sunlight and, ultimately, colors the oceans. In the blue and clear subtropical gyre of the North Atlantic Ocean, the temporal dynamics of CDOM are strongly correlated with the concentration of chlorophyll contained into tiny plants called phytoplankton. The reasons of such a correlation are unexplained. Here, we usefield data collected by autonomous robotic platforms and show that CDOM is a fresh product of phytoplankton metabolism in the sampled area. More importantly, we observe that this production is driven by the presence of the smallest phytoplankton on the planet. The role of picophytoplankton (i.e., all phytoplankton with size smaller than 2μm) as a producer of CDOM will thus become critical for the ocean carbon cycle in the future ocean, as climate change allows subtropical gyres expanding.1. Introduction
Among the clearest world oceans, the North Atlantic subtropical gyre (NASTG; 14–30°N; Longhurst, 2007) is less blue than the other oligotrophic subtropical zones. NASTG is characterized, at its surface, by a higher content in colored dissolved organic matter (CDOM) that enhances light absorption in the ultraviolet (UV) and blue regions of the electromagnetic spectrum (Morel et al., 2010). CDOM thus attenuates the pene-tration of UV and blue light with depth and modifies the color of the ocean (Morel & Prieur, 1977). Modifications in CDOM light absorption track climate change signals (Dutkiewicz et al., 2019), and ulti-mately may affect the ocean's heat budget (Kim et al., 2018). Because of ocean warming due to climate change, NASTG is expanding and thus represents how the future ocean will look like (Polovina et al., 2008). Yet, the fate of CDOM in this region will remain unpredictable until main drivers shaping its dynamics are unraveled.
In the upper NASTG, the dynamics of space‐derived CDOM light absorption coefficients and phytoplankton chlorophyll concentrations are tightly correlated with minima in summer and maxima in winter (Morel et al., 2010). Such a synchronous correlation was unexpected in open‐ocean waters (Nelson & Siegel, 2013) and for the close Sargasso Sea (Hu et al., 2006; Nelson et al., 1998). Indeed, in open‐ocean waters, a delay between phytoplankton chlorophyll and CDOM maxima is typically observed (Nelson & Siegel, 2013). This delay is generally associated with CDOM production through phytoplankton digestion as oper-ated by heterotrophic bacteria (Nelson et al., 1998) and excludes active CDOM release by phytoplankton as observed in laboratory (Romera‐Castillo et al., 2010; Seritti et al., 1994). Hence, to explain the tight corre-lation observed between CDOM and chlorophyll, Morel and coauthors (2010) formulated three hypotheses: (i) CDOM is directly released into seawater via phytoplankton metabolism and it is not a by‐product of
©2019. The Authors.
This is an open access article under the terms of the Creative Commons Attribution License, which permits use, distribution and reproduction in any medium, provided the original work is properly cited.
Key Points:
• Colored dissolved organic matter is produced via phytoplankton metabolism in the North Atlantic subtropical gyre
• Picophytoplankton shapes the dynamics of colored dissolved organic matter within the mixed layer of the North Atlantic subtropical gyre
• Picophytoplankton may become a critical source of colored dissolved organic matter under ocean warming Supporting Information: • Supporting Information S1 Correspondence to: E. Organelli, emanuele.organelli@obs‐vlfr.fr Citation:
Organelli, E., & Claustre, H. (2019). Small phytoplankton shapes colored dissolved organic matter dynamics in the North Atlantic subtropical gyre.
Geophysical Research Letters, 46, https://doi.org/10.1029/
Received 24 JUL 2019 Accepted 24 SEP 2019
Accepted article online 15 OCT 2019 Published online 8 NOV 2019 12,183 12,191.–
2019GL084699
Corrected 18 DEC 2019
This article was corrected on 18 DEC 2019. See the end of the full text for details.
heterotrophic bacteria; (ii) lower solar radiation reduces CDOM photode-gradation in winter and enhances phytoplankton chlorophyll concentra-tions; (iii) winter convection replenishes the upper layer with CDOM and nutrients from deepest reservoirs, while nutrients favor in turn phyto-plankton growth. A combination of all the three hypotheses was ulti-mately considered as the most likely scenario. However, because of the lack of in situ vertical profiles of other bio‐optical, physical, and biogeo-chemical variables, no hypothesis was confirmed, and main drivers of CDOM in NASTG are still unexplained.
Four Biogeochemical‐Argo (BGC‐Argo) floats have routinely acquired vertical profiles of radiometry, phytoplankton chlorophyll fluorescence (FChl), and hydrology in NASTG for 6 years (2012–2018). Here, we ana-lyze the relationship between proxies of CDOM light absorption coeffi-cients and chlorophyll concentrations within the mixed layer, and explain what are the main drivers of the observed temporal dynamics. We then propose a possible scenario for CDOM in expanding clear waters, such as NASTG, under increasing ocean warming.
2. Materials and Methods
Four PROVOR CTS‐4 profiling floats were deployed in NASTG and oper-ated between 2012 and 2018 (Figure 1; see supporting information, Figure S1). PROVOR CTS‐4 floats were configured and deployed according to standard procedures (Bittig et al., 2019). Eachfloat collected 0–1000 m ver-tical profiles of temperature (T), salinity (S), dissolved oxygen concentra-tion, FChl, andfluorescent dissolved organic matter (FDOM). BGC‐Argo floats also acquired 0–250 m vertical profiles of downward irradiance at 380 and 490 nm (Ed(380) and Ed(490), respectively), and instantaneous
Photosynthetically Available Radiation (PAR) integrated between 400 and 700 nm. Vertical profiles were acquired every 1 up to 10 days under high solar elevation angles (>30°; i.e., around local noon). Either raw or quality‐controlled data were gathered from Coriolis Global Data Assembly Centre (ftp://ftp.ifremer.fr/ifremer/argo/dac/coriolis/; Argo, 2019). All these data were already checked for sensor malfunctioning and bio‐fouling issues (Argo Data Management Team, 2017). Each vari-able was quality‐controlled as described below.
Pressure, T and S were collected by a SBE‐41 CP conductivity‐T‐depth sen-sor (Sea‐Bird Scientific). Data were quality‐controlled according to stan-dard, internationally‐accepted protocols as discussed by the Argo Data Management Team (Wong et al., 2019). T and S were then used to calculate seawater potential density anom-aly and, ultimately, to estimate the thickness of the mixed layer. The mixed layer depth (MLD) was defined as the depth at which seawater density was >0.03 kg m−3with respect to its value at 10 m (de Boyer Montégut et al., 2004). Finally, T and S mean values within the mixed layer were computed from quality‐controlled vertical profiles.
Dissolved oxygen concentrations were acquired by an Aanderaa Data Instrument 4330 optode and quality‐ controlled following Thierry et al. (2018). Quality‐controlled profiles were used, together T and S, as input of the neural network‐based method CArbonate system and Nutrients concentration from hYdrologycal properties and Oxygen using a Neural‐network (Bittig et al., 2018; Sauzède et al., 2017) to obtain high‐quality vertical profiles of nitrate concentrations. Nitrate vertical profiles were then used to estimate the depth of the nitracline (ZNO3), that is, the depth which separates upper nitrate‐depleted from deeper nitrate‐rich waters.
ZNO3 was defined as the depth at which the isocline 1 μM was located (Pasqueron de Fommervault
et al., 2015).
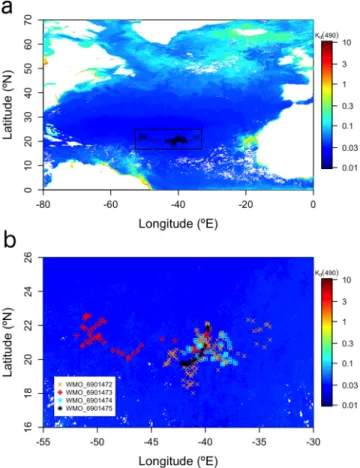
Figure 1. The North Atlantic subtropical gyre. (a) Area (black rectangle)
and stations (black open circles) sampled by four Biogeochemical‐Argo floats between 2012 and 2018; (b) Float trajectories. In both panels, only stations after quality control of variables are shown (n = 235). The WMO numbers of each BGC‐Argo float (and the dates of the first and last quality‐ controlled profiles) are 6901472 (24/10/2012–19/09/2018), 6901473 (25/10/ 2012–04/07/2016), 6901474 (24/10/2012–15/06/2015), and 6901475 (26/10/ 2012–24/01/2013). Sampled stations are superimposed onto the July 2014 Ocean Colour European Space Agency Climate Change Initiative (v3.1) monthly composite of the diffuse attenuation coefficient for downward irradiance at 490 nm (Kd(490); units of per meter). Low Kd(490) coefficients
are associated with very clear waters. Float trajectories before quality control are shown in Figure S1. WMO = World Meteorological Organization.
10.1029/2019GL084699
FChl vertical profiles were acquired by a Sea‐Bird WetLABS Environmental Characterization Optics sensor with excitation at 470 nm and emission at 695 nm. FChl measurements were converted in phytoplankton chlorophyll concentration ([Chl], units of milligrams per cubic meters) and then quality‐controlled accord-ing to Schmechtig et al. (2015; 2018). Briefly, the quality control procedures consisted in applyaccord-ing a test range for measured values and corrections for nonphotochemical quenching (Xing et al., 2012) and overestimation due to factory calibration (Roesler et al., 2017). [Chl] values <0.0146 mg m−3were removed because these values were below the sensor's detection limit. Averaged [Chl] values within the mixed layer were computed from quality‐controlled vertical profiles. Finally, mean [Chl] values were used to estimate the relative abun-dances of picophytoplankton (<2μm), nanophytoplankton (2–20 μm), and microphytoplankton (>20 μm) following the method described by Hirata et al. (2011). This method also allowed to distinguish between the contributions of picocyanobacteria and picoeukaryotes within picophytoplankton as well as those of hap-tophytes and green algae within the nanophytoplankton size class.
FDOM vertical profiles (units of parts per billion of quinine sulfate) were acquired by a Sea‐Bird WetLABS Environmental Characterization Optics sensor with excitation at 370 nm and emission at 460 nm, and quality‐controlled following Organelli, Barbieux, et al. (2017). Values outside the range reported by the man-ufacturer, and negative and positive spikes were removed. Remaining outliers were additionallyfiltered and, finally, vertical profiles were aligned to the median value between 950 and 1,000 m of the first profile to cor-rect for possible sensor drifts (Organelli, Barbieux, et al., 2017). Note that because of sensor issues, the tem-poral coverage of FDOM quality‐controlled data is shorter than for other variables, and profiles were directly downloaded from Organelli, Barbieux, et al. (2017). Average FDOM values within the mixed layer were com-puted from quality‐controlled vertical profiles. BGC‐Argo FDOM measurements report only on the fraction of CDOM associated with humic material (Nelson & Gauglitz, 2016; Stedmon & Nelson, 2015).
Ed(380), Ed(490), and PAR were collected by a Satlantic Inc. multispectral OCR‐504 radiometer and quality‐
controlled following Organelli et al. (2016). This quality control accepts radiometric profiles acquired under clear or overcast sky as soon as these conditions remain stable during the cast. Hence, the quality controlfirst removed profiles collected under unstable sky and sea conditions. Then, remaining profiles were checked to identify and remove dark measurements at depth, sporadic atmospheric clouds, and wave focusing in the upper part of the profile. For each quality‐controlled profile, Ed(380), Ed(490), and PAR just below the surface
were computed through extrapolation within thefirst optical depth (Zpd) using a second‐degree polynomial
function (Organelli et al., 2016). Zpdwas defined as Zeu/4.6, where Zeuis the depth at which PAR is reduced
to 1% of its value just below the surface. The average quantity of PAR within the mixed layer (PARML) was
computed following Morel et al. (2010). Because all measurements were acquired around noon when solar elevation and irradiance are the highest, PARMLthus represents the maximal dose of light within the mixed
layer over a 24‐h period.
To calculate a proxy of CDOM light absorption coefficients (i.e, Kbio(380); Morel, Claustre, et al., 2007),
Ed(380) vertical profiles were used to compute the diffuse attenuation coefficient for downward irradiance
within the mixed layer (Kd(380); units of per meter). Quality‐controlled Ed(380) profiles were first binned
in 1‐m intervals. Kd(380) was then derived as the slope of a linearfit between the natural logarithm of
Ed(380) and depth, and quality‐controlled following Organelli et al. (2017). The contribution of pure
seawater was then subtracted from Kd(380) to obtain Kbio(380) (Morel & Maritorena, 2001). Note that this
decomposition is accepted in NASTG because samples were acquired in very clear waters and under high solar elevation angles (Lee et al., 2018; Morel & Maritorena, 2001). Finally, Kbio(380) coefficients were
divided by mean [Chl] values within the mixed layer to obtain the chlorophyll‐specific attenuation coefficient for CDOM (Kstar(380); units of square meters per milligram of chlorophyll).
The same procedure as described above was applied to quality‐controlled Ed(490) vertical profiles to estimate
Kbio(490) coefficients. Despite of being influenced by light absorption of phytoplankton accessory pigments, Kbio(490) is a statistically significant proxy of [Chl] as those computed for wavelengths at which chlorophyll
light absorption is the highest (e.g., 440 nm; Morel, Huot, et al., 2007).
Statistical analyses were conducted on monthly climatology. For each variable, the monthly value is the mean (± standard deviation) computed by using all data collected by the four BGC‐Argo floats. For each monthly value, the percent coefficient of variation (CV%) was computed as: 100 × (standard deviation/mean). To cal-culate the relationships among Kbio(380) and other variables, multiple and simple linear regressions were
applied. The r‐squared and the Pearson's correlation coefficient (r) were calculated, and the significance of the fits was tested by a two‐tailed Student's t‐test. Before applying parametric tests, we tested the dataset for normality and data were log‐normal distributed (but Zeuand PARML),
accordingly with Campbell (1995). Note that because the procedure by Organelli et al. (2016) to quality control radiometry is stricter for PAR than
Ed(380), only the stations with good PAR profiles (n = 235; Figure 1) were
finally used to calculate climatology for all variables (but ZNO3).
3. Results and Discussion
In NASTG, despite of the lowest values observed among the world oceans (Organelli, Claustre, et al., 2017), Kbio(380) and [Chl] are characterized by
a clear seasonal cycle within the mixed layer (Figure 2a; see supporting information Table S1). These cycles are synchronized, and both show minima in summer and maxima in winter accordingly with Morel et al. (2010) spaced‐based observations. Kbio(380) significantly decreases in
cor-respondence with shallower MLDs (Figure 2b; see supporting information Table S2) and low S (see supporting information Figure S2; Table S2), as well as when PARML increases (Figure 2c; Table S2). Kbio(380) also
decreases in correspondence with deeper ZNO3(Figure 2b) but not in a
significant manner (Table S2), while a cross‐correlation analysis sug-gests dependence of changes in T within the mixed layer on Kbio(380)
(Figure S2). Thus, a multiple regression analysis using [Chl], MLD, PARML, and S as independent variables revealed that these variables
together explain more the 90% of the monthly variability in Kbio(380)
(r‐squared = 0.91, p < 0.01; Table S2). Yet, PARML, MLD, and S do not
add significant contribution to shaping Kbio(380) with respect to [Chl]
(statistics for comparison among variables are in Table S2). [Chl] alone explains almost the totality of monthly variability in Kbio(380) coefficients
(r‐squared = 0.87, p < 0.01; Table S2), and thus, CDOM dynamics in the sampled area. Such results tell us that CDOM is directly produced by phytoplankton in NASTG and help rejecting the two other hypotheses previously formulated by Morel et al. (2010).
Vertical mixing does not replenish CDOM within the mixed layer in win-ter. CDOM light absorption coefficients measured in NASTG at the same time of the year are homogeneously distributed down to 250‐m depth (Nelson et al., 1998) and within deep euphotic layers (i.e., 140 m; Iuculano et al., 2019). Yet, the highest MLD values observed in January are of 78 ± 26 m (Figure 2b; Table S1) while the deepest MLD of 129 m has been recorded in February. MLD values and seasonality as reported by the four BGC‐Argo floats are consistent with previous observations in NASTG (de Boyer Montégut et al., 2004; Reverdin et al., 2015). This implies that the mixed layer in NASTG is not thick enough to allow CDOM upwelling from deep reservoirs.
Photodegradation yields a minor impact on CDOM dynamics in NASTG. CDOM photodegradation is expected to depend on the time the water mass is exposed to solar light (Yamashita et al., 2013). Substantial CDOM photochemical destruction thus occurs months after the highest annual radiation rates (Organelli et al., 2014). In NASTG, lowest Kbio(380) coefficients were therefore
expected in September. At this time, PARMLdecreases while the mixed layer is still shallow as in the previous
months. The same water mass has therefore been exposed to the highest light doses for more than 3 months (Figure 2c) which would have enhanced photodegradation. Moreover, photodegradation of dissolved com-pounds could also be inhibited by the occurring nitrate limitation that, ultimately, reduces the Figure 2. Monthly climatology of Kbio(380) (units of m−1) and other
biogeo-chemical and physical variables within the mixed layer. (a) Kbio(380) and
phytoplankton chlorophyll concentrations ([Chl]; units of milligrams per cubic meters); (b) Kbio(380), the mixed layer depth (MLD; units of m) and
the depth of the nitracline (ZNO3; units of m); (c) Kbio(380) and the average
value of the Photosynthetically Available Radiation at solar noon within the mixed layer (PARML; units ofμmol quanta m−2s−1). The coefficients of
variation (CV%) for each monthly average are listed in Table S1.
10.1029/2019GL084699
susceptibility of surface CDOM to illumination conditions (Swan et al., 2012). However, illumination is unlikely a limiting factor in NASTG despite of the observed seasonal variations (Figure 2c; Morel et al., 2010). For example, the depth of the euphotic zone Zeuis similar
regard-less of the season (103 ± 11‐121 ± 6 m; see supporting information Figure S3; Table S1). Such a high light availability therefore suggests that the degree of CDOM photodegradation is similar during all the year in NASTG.
vThe relevance of phytoplankton metabolism as primary source of CDOM in NASTG depends on the extent to which observed [Chl] dynamics are also related to changes in carbon biomass in addition to photoacclimation. Photoacclimation has been previously shown as the main driver of [Chl] in this region and for the other oligotrophic subtropical gyres (Barbieux et al., 2018; Mignot et al., 2014). However, in NASTG, modifications in [Chl] due to changes in carbon biomass also occur, as highlighted by the observed strong correlation between [Chl] and Kbio(490) (r = 0.84, see
sup-porting information Figure S4). [Chl] is derived fromfluorescence mea-surements, and thus, its conversion to carbon biomass strongly depends on phytoplankton species composition and growth, and illumination con-ditions (Cullen, 1982). Conversely, Kbio(490) coefficients are proxies of phytoplankton pigment light
absorp-tion and thus are inherently more related to chlorophyll concentraabsorp-tion and actual carbon biomass than fluorescence‐derived [Chl] (Roesler & Barnard, 2013). Thus in winter, for example, observed highest chlor-ophyll concentrations and Kbio(490) values indicate an increase in carbon biomass, which is likely favored by
the upwelling of nitrates into the mixed layer through diffusion from a shallower nitracline than from spring to autumn (Lewis et al., 1986; Figure 2b).
From spring to autumn, when carbon biomass is low, phytoplankton releases more CDOM per unit of [Chl] than in winter (Figure 3) which supports active CDOM exudation via photosynthetic overflow (Thornton, 2014). In summertime, for example, high light conditions (Figure 2c) boost photosynthesis but nutrient lim-itation cannot fully support cell growth (Marañón, 2005). Photosynthesis is thus faster than phytoplankton growth and leads to an intracellular accumulation of organic compounds (Fogg, 1983). When the cellular sto-rage capacity is overwhelmed, phytoplankton releases into the seawater any exceeding products. Such a mechanism characterizes healthy growing cells, but it may account only for about 10% of the productivity (Myklestad et al., 1989), which explains the lower Kbio(380) values observed in summer than in
winter (Figure 2).
Picophytoplankton and especially cyanobacteria such as the genera Prochlorococcus and Synechococcus shapes Kstar(380) and thus CDOM light absorption temporal dynamics in NASTG (Figure 4; see supporting
information Figure S5). The relevance of picophytoplankton is confirmed by growing literature in such very oligotrophic areas both for the production of dissolved (Roshan & DeVries, 2017; Teira et al., 2001) and colored (Iuculano et al., 2019; Zhao et al., 2017) organic matter. Here we show that cyanobacteria dominate all the year (Figure S5), accordingly with previous studies (e.g., Heywood et al., 2006). More importantly, cya-nobacteria maxima (up to 56% on average) are observed for the highest Kstar(380) coefficients, that is, from
spring to autumn when these organisms release more CDOM per unit of carbon biomass (Figure 3). During the same period, the contribution of picoeukaryotes also increases up to 31% (Figure S5). Among the others size classes, microphytoplankton contributes <3% during all the year while nanophytoplankton follows the opposite seasonal trend than picophytoplankton (Figure S5; Table S1). The relative contribution of nanophytoplankton, which is mainly dominated by haptophytes, is the lowest in summer (13% on average) when Kstar(380) coefficients are the highest (Figure S5; Table S1).
The increasing importance of smallest phytoplankton during the most stratified and illuminated period of the year allows, therefore, looking at picophytoplankton as a new potential source of CDOM whose role may become critical under the ocean warming scenario. Such a scenario leads to increased exposure of sur-face waters to light and reduced nutrient supply from the deep ocean due to enhanced stratification of the water column. Under such environmental conditions, picophytoplankton is expected to be more resilient Figure 3. Colored dissolved organic matter light absorption per unit of [Chl]
is high from spring to autumn. Monthly climatology of phytoplankton chlorophyll concentration ([Chl]; units of milligrams per cubic meters) and chlorophyll‐specific diffuse attenuation coefficient for downward irradiance at 380 nm (Kstar(380); units of square meters per milligram of chlorophyll)
within the mixed layer. Statistics for linear correlation between Kstar(380)
and [Chl] are shown. The coefficients of variation (CV%) for each monthly average are listed in Table S1.
than other groups (Agustí et al., 2019; Flombaum et al., 2013; Morán et al., 2010). In such circumstances, picophytoplankton will therefore boost active CDOM release into seawater.
It may be argued that results and discussions here presented deal on variability of the Kbio(380) coefficient
which is only a proxy of CDOM light absorption coefficient. Previous studies in the clearest oligotrophic world oceans have shown that CDOM dominates the light absorption budget at 380 nm (Bricaud et al., 2010) and light attenuation in the UVs (Morel, Claustre, et al., 2007; Siegel & Michaels, 1996; Smyth, 2011). Unfortunately, we do not have coincident light absorption data to prove this statement. Yet, other pos-sible sources that affect light attenuation in the UVs, such as light absorption by mycosporine‐like amino acids and non‐algal particles (NAP), can be excluded or considered negligible. Mycosporine‐like amino acids are photoprotective pigments that have been observed in cyanobacteria as well as in a variety of nanophyto-plankton and microphytonanophyto-plankton species (Carreto & Carignan, 2011), but their light absorption maxima occurs between 310 and 360 nm (Carreto & Carignan, 2011). NAP light absorption at 380 nm contributes less than 20% to total non‐water absorption in clear oligotrophic waters (Bricaud et al., 2010). More importantly, NAP optical contribution does not significantly vary along the year in NASTG (Bellacicco et al., 2019) so that NAP cannot help shaping the temporal variability of Kbio(380) coefficients.
Though this study highlights the main role of phytoplankton on a climatology scale, the dependence of CDOM dynamics on other processes cannot be totally excluded at a shorter scale. Heterotrophic bacteria may still act as a source of CDOM (Nelson et al., 1998), and rapid convection and mesoscale activity can bring CDOM within the mixed layer from deep reservoirs (Nelson et al., 2007). In addition, in NASTG, CDOM tem-poral dynamics could also depend on the varying lability of chemical compounds. For example, Zhao et al. (2017) have shown that picophytoplankton releases CDOM that ultimately accumulates in the Sargasso Sea waters. Similar results in the sampled area are also indicated by BGC‐Argo FDOM measurements which share similar optical properties with the matter accumulating in the ocean (Catalá et al., 2015; Zhao et al., 2017). Indeed, the fraction of measured FDOM to total CDOM (i.e., FDOM/Kbio(380)) increases in summer
when carbon biomass is the lowest and the abundance of picophytoplankton is the highest (see supporting information Figure S6). These results thus suggest that picophytoplankton may also act as a producer of CDOM that is potentially resistant to degradation, complement the microbial carbon pump (Jiao et al., 2010), and ultimately affect organic carbon sequestration.
4. Conclusions
High spatial‐ and temporal‐resolution data acquired for 6 years by BGC‐Argo floats have disclosed the main drivers of CDOM seasonal variability in the oligotrophic low‐chlorophyll NASTG. BGC‐Argo floats are there-fore valuable observational tools to observe the ocean in a systematic way, which complement and enrich observations acquired from a variety of in situ and space‐based platforms (e.g., Iuculano et al., 2019; Morel Figure 4. Picophytoplankton shapes CDOM dynamics. Chlorophyll‐specific diffuse attenuation coefficient for downward irradiance at 380 nm (Kstar(380); units of
square meters per milligram of chlorophyll) as a function of the fraction of picophytoplankton (units of percentage): (a) monthly climatology; (b) all data. Blue dashed line is the linearfit to all data. Statistics are shown. The coefficients of variation (CV%) for each monthly average are listed in Table S1.
10.1029/2019GL084699
et al., 2010) and modelling studies (Roshan & DeVries, 2017). In particular, the BGC‐Argo analysis based on bio‐optical and biogeochemical measurements have unveiled that:
a CDOM is mainly a direct product of phytoplankton metabolism; b Winter mixing does not bring CDOM up from deep reservoirs;
c The impact of photodegradation is likely constant during all the year given the unlimited light; d Picophytoplankton such as the genera Prochlorococcus and Synechococcus shapes CDOM temporal
dynamics;
e Small phytoplankton will have a critical role under the ocean warming scenario. It will represent an increasing source of CDOM that, in turn, will impact on the ocean carbon cycle.
References
Agustí, S., Lubián, L. M., Moreno‐Ostos, E., Estrada, M., & Duarte, C. M. (2019). Projected changes in photosynthetic picoplankton in a warmer subtropical ocean. Frontiers in Marine Science, 5, 506. https://doi.org/10.3389/fmars.2018.00506
Argo (2019). Argofloat data and metadata from Global Data Assembly Centre (Argo GDAC). SEANOE. https://doi.org/10.17882/42182 Argo Data Management Team (2017). Argo user's manual V3.2. https://doi.org/10.13155/29825
Barbieux, M., Uitz, J., Bricaud, A., Organelli, E., Poteau, A., Schmechtig, C., et al. (2018). Assessing the variability in the relationship between the particulate backscattering coefficient and the chlorophyll a concentration from a global Biogeochemical‐Argo database.
Journal of Geophysical Research: Oceans, 123, 1229–1250. https://doi.org/10.1002/2017JC013030
Bellacicco, M., Cornec, M., Organelli, E., Brewin, R. J. W., Neukermans, G., Volpe, G., et al. (2019). Global variability of optical backscat-tering by non‐algal particles from a Biogeochemical‐Argo dataset. Geophysical Research Letters, 46, 9767–9776. https://doi.org/10.1029/ 2019GL084078
Bittig, H. C., Maurer, T. L., Plant, J. N., Schmechtig, C., Wong, A. P. S., Claustre, H., et al. (2019). A BGC‐Argo guide: Planning, deployment, data handling and usage. Frontiers in Marine Science, 6, 502. https://doi.org/10.3389/fmars.2019.00502
Bittig, H. C., Steinhoff, T., Claustre, H., Fiedler, B., Williams, N. L., Sauzède, R., et al. (2018). An alternative to static climatologies: Robust estimation of open ocean CO2variables and nutrient concentrations from T, S, and O2data using Bayesian neural networks. Frontiers in
Marine Science, 5, 328. https://doi.org/10.3389/fmars.2018.00328
Bricaud, A., Babin, M., Claustre, H., Ras, J., & Tièche, F. (2010). Light absorption properties and absorption budget of Southeast Pacific waters. Journal of Geophysical Research, 115, C08009. https://doi.org/10.1029/2009JC005517
Campbell, J. W. (1995). The lognormal distribution as a model for bio‐optical variability in the sea. Journal of Geophysical Research, 100, 13,237–13,254.
Carreto, J. I., & Carignan, M. O. (2011). Mycosporine‐like amino acids: Relevant secondary metabolites. Chemical and ecological aspects.
Marine Drugs, 9(3), 387–446. https://doi.org/10.3390/md9030387
Catalá, T. S., Reche, I., Fuentes‐Lema, A., Romera‐Castillo, C., Nieto‐Cid, M., Ortega‐Retuerta, E., et al. (2015). Turnover time of fluorescent dissolved organic matter in the dark global ocean. Nature Communications, 6, 5986. https://doi.org/10.1038/ncomms6986
Cullen, J. J. (1982). The deep chlorophyll maximum: Comparing vertical profiles of chlorophyll a. Canadian Journal of Fisheries and
Aquatic Sciences, 39(5), 791–803. https://doi.org/10.1139/f82‐108
de Boyer Montégut, C., Madec, G., Fischer, A. S., Lazar, A., & Iudicone, D. (2004). Mixed layer depth over the global ocean: An examination of profile data and a profile‐based climatology. Journal of Geophysical Research, 109, C12003. https://doi.org/10.1029/ 2004JC002378
Dutkiewicz, S., Hickman, A. E., Jahn, O., Henson, S., Beaulieu, C., & Monier, E. (2019). Ocean colour signature of climate change. Nature
Communications, 10(1), 578. https://doi.org/10.1038/s41467‐019‐08457‐x
Flombaum, P., Gallegos, J. L., Gordillo, R. A., Rincón, J., Zabala, L. L., Jiao, N., et al. (2013). Present and future global distributions of the marine Cyanobacteria Prochlorococcus and Synechococcus. Proceedings of the National Academy of Sciences of the United States of
America, 110(24), 9824–9829. https://doi.org/10.1073/pnas.1307701110
Fogg, G. E. (1983). The ecological significance of extracellular products of phytoplankton photosynthesis. Botanica Marina, 26, 3–14. Heywood, J. L., Zubkov, M. V., Tarran, G. A., Fuchs, B. M., & Holligan, P. M. (2006). Prokaryoplankton standing stocks in
oligo-trophic gyre and equatorial provinces of the Atlantic Ocean: Evaluation of inter-annual variability. Deep Sea Research, Part II, 53, 1530-1547.
Hirata, T., Hardman‐Mountford, N. J., Brewin, R. J. W., Aiken, J., Barlow, R., Suzuki, K., et al. (2011). Synoptic relationships between surface chlorophyll‐a and diagnostic pigments specific to phytoplankton functional types. Biogeosciences, 8(2), 311–327. https://doi.org/ 10.5194/bg‐8‐311‐2011
Hu, C., Lee, Z., Muller‐Karger, F. E., Carder, K. L., & Walsh, J. J. (2006). Ocean color reveals phase shift between marine plants and yellow substance. IEEE Geoscience and Remote Sensing Letters, 3(2), 262–266. https://doi.org/10.1109/LGRS.2005.862527
Iuculano, F., Álverez‐Salgado, X. A., Otero, J., Catalá, T. S., Sobrino, C., Duarte, C. M., & Agustí, S. (2019). Patterns and drivers of UV absorbing chromophoric dissolved organic matter in the euphotic layer of the open ocean. Frontiers in Marine Science, 6, 320. https://doi. org/10.3389/fmars.2019.00320
Jiao, N., Herndl, G. J., Hansell, D. A., Benner, R., Kattner, G., Wilhelm, S. W., et al. (2010). Microbial production of recalcitrant dissolved organic matter: long‐term carbon storage in the global ocean. Nature Reviews. Microbiology, 8(8), 593–599. https://doi.org/10.1038/ nrmicro2386
Kim, G. E., Gnanadesikan, A., Del Castillo, C. E., & Pradal, M.‐A. (2018). Upper ocean cooling in a coupled climate model due to light attenuation by yellowing materials. Geophysical Research Letters, 45, 6134–6140. https://doi.org/10.1029/2018GL077297
Lee, Z., Shang, S., & Stavn, R. (2018). AOPs are not additive: On the biogeo‐optical modeling of the diffuse attenuation coefficient. Frontiers
in Marine Science, 5, 8. https://doi.org/10.3389/fmars.2018.00008
Lewis, M., Hebert, D., Harrison, W. G., Platt, T., & Oakey, N. (1986). Vertical nitratefluxes in the oligotrophic ocean. Science, 234(4778), 870–873. https://doi.org/10.1126/science.234.4778.870
Longhurst, A. R. (2007). The Atlantic Ocean. In A. R. Longhurst (Ed.), Ecological geography of the sea (2nd ed., pp. 131–273). Burlington: Academic.
Acknowledgments
We thank Marin Cornec for application of CArbonate system and Nutrients concentration from hYdrologycal properties and Oxygen using a Neural‐ network, and calculation of the nitracline depth; Catherine Schmechtig and Antoine Poteau for all
predeployment and postdeployment operations on BGC‐Argo floats. This study is a contribution to the remOcean (European Research Council, Grant 246777) and AtlantOS (European Union's Horizon 2020 research and innovation program, Grant 2014‐ 633211) projects. Data supporting the conclusions are freely available at http://doi.org/10.17882/42182 (Argo, 2019). No conflicts of interests are declared.
Marañón, E. (2005). Phytoplankton growth rates in the Atlantic subtropical gyres. Limnology and Oceanography, 50(1), 299–310. https://doi.org/10.4319/lo.2005.50.1.0299
Mignot, A., Claustre, H., Uitz, J., Poteau, A., D'Ortenzio, F., & Xing, X. (2014). Understanding the seasonal dynamics of phytoplankton biomass and the deep chlorophyll maximum in oligotrophic environments: A Bio‐Argo float investigation. Global Biogeochemical Cycles,
28, 856–876. https://doi.org/10.1002/2013GB004781
Morán, X. A. G., López‐Urrutia, A., Calvo‐Díaz, A., & Li, W. K. W. (2010). Increasing importance of small phytoplankton in a warmer ocean.
Global Change Biology, 16(3), 1137–1144. https://doi.org/10.1111/j.1365‐2486.2009.01960.x
Morel, A., Claustre, H., Antoine, D., & Gentili, B. (2007). Natural variability of bio‐optical properties in Case 1 waters: Attenuation and reflectance within the visible and near‐UV spectral domains, as observed in South Pacific and Mediterranean waters. Biogeosciences, 4(5), 913–925. https://doi.org/10.5194/bg‐4‐913‐2007
Morel, A., Claustre, H., & Gentili, B. (2010). The most oligotrophic subtropical zones of the global ocean: Similarities and differences in terms of chlorophyll and yellow substance. Biogeosciences, 7(10), 3139–3151. https://doi.org/10.5194/bg‐7‐3139‐2010
Morel, A., Huot, Y., Gentili, B., Werdell, P. J., Hooker, S. B., & Franz, B. A. (2007). Examining the consistency of products derived from various ocean color sensors in open ocean (Case 1) waters in the perspective of a multi‐sensor approach. Remote Sensing of Environment,
111(1), 69–88. https://doi.org/10.1016/j.rse.2007.03.012
Morel, A., & Maritorena, S. (2001). Bio‐optical properties of oceanic waters: A reappraisal. Journal of Geophysical Research, 106, 7163–7180. https://doi.org/10.1029/2000JC000319
Morel, A., & Prieur, L. (1977). Analysis of variations in ocean color. Limnology and Oceanography, 22(4), 709–722. https://doi.org/10.4319/ lo.1977.22.4.0709
Myklestad, S., Holm‐Hansen, O., Vårum, K. M., & Volcani, B. E. (1989). Rate of release of extracellular amino acids and carbohydrates from the marine diatom Chaetoceros affinis. Journal of Plankton Research, 11(4), 763–773. https://doi.org/10.1093/plankt/11.4.763 Nelson, N. B., & Gauglitz, J. M. (2016). Optical signatures of dissolved organic matter transformation in the global ocean. Frontiers in Marine
Science, 2, 118. https://doi.org/10.3389/fmars.2015.00118
Nelson, N. B., & Siegel, D. A. (2013). The global distribution and dynamics of chromophoric dissolved organic matter. Annual Review of
Marine Science, 5(1), 447–476. https://doi.org/10.1146/annurev‐marine‐120710‐100751
Nelson, N. B., Siegel, D. A., Carlson, C. A., Swan, C., Smethie Jr., W. M., & Khatiwala, S. (2007). Hydrography of chromophoric dissolved organic matter in the North Atlantic. Deep Sea Research, Part I, 54(5), 710–731. https://doi.org/10.1016/j.dsr.2007.02.006
Nelson, N. B., Siegel, D. A., & Michaels, A. F. (1998). Seasonal dynamics of colored dissolved material in the Sargasso Sea. Deep Sea
Research, Part I, 45(6), 931–957. https://doi.org/10.1016/S0967‐0637(97)00106‐4
Organelli, E., Barbieux, M., Claustre, H., Schmechtig, C., Poteau, A., Bricaud, A., et al. (2017). Two databases derived from BGC‐Argo float measurements for marine biogeochemical and bio‐optical applications. Earth System Science Data, 9(2), 861–880. https://doi.org/ 10.5194/essd‐9‐861‐2017
Organelli, E., Bricaud, A., Antoine, D., & Matsuoka, A. (2014). Seasonal dynamics of light absorption by chromophoric dissolved organic matter (CDOM) in the NW Mediterranean Sea (BOUSSOLE site). Deep Sea Research, Part I, 91, 72–85. https://doi.org/10.1016/j. dsr.2014.05.003
Organelli, E., Claustre, H., Bricaud, A., Barbieux, M., Uitz, J., D'Ortenzio, F., & Dall'Olmo, G. (2017). Bio‐optical anomalies in the world's oceans: An investigation on the diffuse attenuation coefficients for downward irradiance derived from Biogeochemical Argo float measurements. Journal of Geophysical Research: Oceans, 122, 3543–3564. https://doi.org/10.1002/2016JC012629
Organelli, E., Claustre, H., Bricaud, A., Schmechtig, C., Poteau, A., Xing, X., et al. (2016). A novel near‐real‐time quality‐control procedure for radiometric profiles measured by Bio‐Argo floats: protocols and performances. Journal of Atmospheric and Oceanic Technology, 33(5), 937–951. https://doi.org/10.1175/JTECH‐D‐15‐0193.1
Pasqueron de Fommervault, O., D'Ortenzio, F., Mangin, A., Serra, R., Migon, C., Claustre, H., et al. (2015). Seasonal variability of nutrient concentrations in the Mediterranean Sea: Contribution of Bio‐Argo floats. Journal of Geophysical Research: Oceans, 120, 8528–8550. https://doi.org/10.1002/2015JC011103
Polovina, J. J., Howell, E. A., & Abecassis, M. (2008). Ocean's least productive waters are expanding. Geophysical Research Letters, 35, L03618. https://doi.org/10.1029/2007GL031745
Reverdin, G., Morisset, S., Marié, L., Bourras, D., Sutherland, G., Ward, B., et al. (2015). Surface salinity in the North Atlantic subtropical gyre during the STRASSE/SPURS summer 2012 cruise. Oceanography, 28(1), 114–123. https://doi.org/10.5670/oceanog.2015.09 Roesler, C. S., & Barnard, A. H. (2013). Optical proxy for phytoplankton biomass in the absence of photophysiology: Rethinking the
absorption line height. Methods in Oceanography, 7, 79–94. https://doi.org/10.1016/j.mio.2013.12.003
Roesler, C. S., Uitz, J., Claustre, H., Boss, E., Xing, X., Organelli, E., et al. (2017). Recommendations for obtaining unbiased chlorophyll estimates from in situ chlorophyllfluorometers: A global analysis of WET Labs ECO sensors. Limnology and Oceanography: Methods,
15(6), 572–585. https://doi.org/10.1002/lom3.10185
Romera‐Castillo, C., Sarmento, H., Álvarez‐Salgado, X. Á., Gasol, J. M., & Marrasé, C. (2010). Production of chromophoric dissolved organic matter by marine phytoplankton. Limnology and Oceanography, 55(1), 446–454. https://doi.org/10.4319/lo.2010.55.1.0446
Roshan, S., & DeVries, T. (2017). Efficient dissolved organic carbon production and export in the oligotrophic ocean. Nature
Communications, 8(1), 2036. https://doi.org/10.1038/s41467‐017‐02227‐3
Sauzède, R., Bittig, H. C., Claustre, H., Pasqueron de Fommervault, O., Gattuso, J.‐P., Legendre, L., & Johnson, K. S. (2017). Estimates of water‐column nutrient concentrations and carbonate system parameters in the global ocean: A novel approach based on neural net-works. Frontiers in Marine Science, 4, 128. https://doi.org/10.3389/fmars.2017.00128
Schmechtig, C., Claustre, H., Poteau, A., & D'Ortenzio, F. (2018). Bio‐Argo quality control manual for the Chlorophyll‐A concentration. https://doi.org/10.13155/35385
Schmechtig, C., Poteau, A., Claustre, H., D'Ortenzio, F., & Boss, E. (2015). Processing bio‐Argo chlorophyll‐A concentration at the DAC level. Argo data management. https://doi.org/10.13155/39468
Seritti, A., Morelli, E., Nannicini, L., & Del Vecchio, R. (1994). Production of hydrophobicfluorescent organic matter by the marine diatom
Phaeodactylum tricornutum. Chemosphere, 28(1), 117–129. https://doi.org/10.1016/0045‐6535(94)90205‐4
Siegel, D. A., & Michaels, A. F. (1996). Quantification of non‐algal light attenuation in the Sargasso Sea: Implications for biogeochemistry and remote sensing. Deep Sea Research, Part II, 43(2‐3), 321–345. https://doi.org/10.1016/0967‐0645(96)00088‐4
Smyth, T. J. (2011). Penetration of UV irradiance into the global ocean. Journal of Geophysical Research, 116, C11020. https://doi.org/ 10.1029/2011JC007183
Stedmon, C. A., & Nelson, N. B. (2015). The optical properties of DOM in the ocean. In D. A. Hansell & C. A. Carlson (Eds.), Biogeochemistry
of marine dissolved organic matter(2nd ed., pp. 481–508). San Diego: Academic.
10.1029/2019GL084699
Swan, C. M., Nelson, N. B., Siegel, D. A., & Kostadinov, T. S. (2012). The effect of surface irradiance on the absorption spectrum of chro-mophoric dissolved organic matter in the global ocean. Deep Sea Research, Part I, 63, 52–64. https://doi.org/10.1016/j.dsr.2012.01.008 Teira, E., Pazó, M. J., Serret, P., & Fernández, E. (2001). Dissolved organic carbon production by microbial populations in the Atlantic
Ocean. Limnology and Oceanography, 46(6), 1370–1377. https://doi.org/10.4319/lo.2001.46.6.1370
Thierry, V., Bittig, H., & The Argo‐BGC Team (2018). Argo quality control manual for dissolved oxygen concentration. https://doi.org/ 10.13155/46542
Thornton, D. C. O. (2014). Dissolved organic matter (DOM) release by phytoplankton in the contemporary and future ocean. European
Journal of Phycology, 49(1), 20–46. https://doi.org/10.1080/09670262.2013.875596
Wong, A., Keeley, R., Carval, T., & Argo Data Management Team (2019). Argo quality control manual for CTD and trajectory data. https://doi.org/10.13155/33951
Xing, X., Claustre, H., Blain, S., D'Ortenzio, F., Antoine, D., Ras, J., & Guinet, C. (2012). Quenching correction for in vivo chlorophyll fluorescence acquired by autonomous platforms: A case study with instrumented elephant seals in the Kerguelen region (Southern Ocean). Limnology and Oceanography: Methods, 10(7), 483–495. https://doi.org/10.4319/lom.2012.10.483
Yamashita, Y., Nosaka, Y., Suzuki, K., Ogawa, H., Takahashi, K., & Saito, H. (2013). Photobleaching as a factor controlling spectral char-acteristics of chromophoric dissolved organic matter in open ocean. Biogeosciences, 10(11), 7207–7217. https://doi.org/10.5194/bg‐10‐ 7207‐2013
Zhao, Z., Gonsior, M., Luek, J., Timko, S., Ianiri, H., Hertkorn, N., et al. (2017). Picocyanobacteria and deep‐fluorescent dissolved organic matter share similar optical properties. Nature Communications, 8, 15,284. https://doi.org/10.1038/ncomms15284
Erratum
In the originally published version of this article, the author affiliation Sorbonne Universit was published incorrectly. This error has since been corrected, and the present version may be considered the
authoritative version of record.