HAL Id: hal-00298706
https://hal.archives-ouvertes.fr/hal-00298706
Submitted on 6 Sep 2005HAL is a multi-disciplinary open access
archive for the deposit and dissemination of sci-entific research documents, whether they are pub-lished or not. The documents may come from teaching and research institutions in France or abroad, or from public or private research centers.
L’archive ouverte pluridisciplinaire HAL, est destinée au dépôt et à la diffusion de documents scientifiques de niveau recherche, publiés ou non, émanant des établissements d’enseignement et de recherche français ou étrangers, des laboratoires publics ou privés.
Flooding dynamics in a large low-gradient alluvial fan,
the Okavango Delta, Botswana, from analysis and
interpretation of a 30-year hydrometric record
P. Wolski, M. Murray-Hudson
To cite this version:
P. Wolski, M. Murray-Hudson. Flooding dynamics in a large low-gradient alluvial fan, the Okavango Delta, Botswana, from analysis and interpretation of a 30-year hydrometric record. Hydrology and Earth System Sciences Discussions, European Geosciences Union, 2005, 2 (5), pp.1865-1892. �hal-00298706�
HESSD
2, 1865–1892, 2005 Flooding dynamics in Okavango Delta P. Wolski and M. Murray-Hudson Title Page Abstract Introduction Conclusions References Tables Figures J I J I Back CloseFull Screen / Esc
Print Version Interactive Discussion
EGU
Hydrol. Earth Sys. Sci. Discuss., 2, 1865–1892, 2005 www.copernicus.org/EGU/hess/hessd/2/1865/
SRef-ID: 1812-2116/hessd/2005-2-1865 European Geosciences Union
Hydrology and Earth System Sciences Discussions
Papers published in Hydrology and Earth System Sciences Discussions are under open-access review for the journal Hydrology and Earth System Sciences
Flooding dynamics in a large low-gradient
alluvial fan, the Okavango Delta,
Botswana, from analysis and
interpretation of a 30-year hydrometric
record
P. Wolski and M. Murray-Hudson
Harry Oppenheimer Okavango Research Centre, Maun, Botswana
Received: 11 August 2005 – Accepted: 22 August 2005 – Published: 6 September 2005 Correspondence to: P. Wolski ([email protected])
HESSD
2, 1865–1892, 2005 Flooding dynamics in Okavango Delta P. Wolski and M. Murray-Hudson Title Page Abstract Introduction Conclusions References Tables Figures J I J I Back CloseFull Screen / Esc
Print Version Interactive Discussion
EGU
Abstract
The Okavango Delta is a flood-pulsed wetland, the resources of which support a large tourism industry and subsistence of the local population. In order to obtain an insight into the influence of various environmental factors on flood propagation and distribution in this system, an analysis was undertaken of a 30-year record of hydrometric data
(dis-5
charges and water levels) from one of the Delta distributaries. The analysis revealed that water levels and discharges at any given channel site in the analysed distributary are influenced by a complex interplay of flood wave and local rainfall input modified by channel-floodplain interactions, in-channel sedimentation and technical interventions, both at the given site and upstream. Additionally, cyclical variation of channel margin
10
vegetation due to nutrients recycling might play a role. It was shown that data from channels do not adequately represent flood dynamics and its change at the distribu-tary level. The paper contributes to the understanding of seasonal and long-term flood pulsing and their changes in low gradient systems of channels and floodplains.
1. Introduction
15
The dynamics of flood propagation and inundation in a channel-floodplain system con-stitute an important hydrological and ecological variable. Hydrologically, the interac-tions of channels with floodplains cause considerable variation in flood levels of the storage and conveyance capacity of the system. As a result, the flood wave is modified – often flattened and delayed – while passing through a channel-floodplain system,
20
and the flood frequency distribution itself can change, compared to that at upstream locations (Wolff and Burges,1994). The ecological role of the channel-floodplain in-teraction is expressed by the flood pulse concept (Junk et al.,1989;Middleton,1999). According to this concept, floodplain wetlands and riparian ecosystems are adjusted to and maintained by the pulsing of water, sediment and nutrients that occurs during
25
HESSD
2, 1865–1892, 2005 Flooding dynamics in Okavango Delta P. Wolski and M. Murray-Hudson Title Page Abstract Introduction Conclusions References Tables Figures J I J I Back CloseFull Screen / Esc
Print Version Interactive Discussion
EGU
spatial and temporal scales as an energy subsidy to the wetland ecosystem, explaining in part the high ecological productivity associated with such systems.
In the past, the dominant approach to river management has been focused on con-trolling rivers rather than managing them in sympathy with their natural operations, resulting in a considerable reduction in floodplain wetlands and loss of biodiversity and
5
ecosystem services (Tockner and Stanford, 2002). More recently, however, recog-nition of the role of flood pulsing and the hydrological role of floodplains has led to a tendency to re-establish natural channel-floodplain links and their hydrological and geomorphological dynamics in channel floodplain systems in regulated rivers for the sake of rehabilitation of riverine ecosystems. This recognition has also resulted in a
10
trend towards trying to maintain the natural dynamics in undisturbed systems, in order to maintain ecosystem services such as effective flood mitigation (Middleton, 1999). Flood dynamics in a channel-floodplain system can change due to exogenic processes such as climate change, endogenic processes such as geomorphological evolution of river channels and floodplains, and anthropogenic processes (channelization,
regula-15
tion, water diversion etc). Not all the change is undesirable, however. Continuous and episodic alluvial processes such as the natural evolution of river channels and flood-induced shifting of floodplain morphology are recognized as important processes of floodplain ecology. They cause habitat rejuvenation and thus maintain high habitat di-versity (Ellery and McCarthy, 1994; Hauer and Lorang, 2004; Richards et al.,2002;
20
van der Nat et al.,2003). They can also maintain floodplain communities at an early stage of succession, resulting in high productivity (Odum,1994). Thus, for the e ffec-tive management of river corridors and floodplain wetlands a thorough understanding is necessary of the natural dynamics of channel-floodplain systems and of endogenic and exogenic changes occurring in these systems.
25
The dynamics of floodplain flows and water levels and their change are often difficult to ascertain. Hydrological observation networks are generally focused on the in-bank situation rather than the overbank one. Off-channel flows can be measured directly by means of a current meter or by dye techniques (e.g.Stern et al.,2001). Indirectly, they
HESSD
2, 1865–1892, 2005 Flooding dynamics in Okavango Delta P. Wolski and M. Murray-Hudson Title Page Abstract Introduction Conclusions References Tables Figures J I J I Back CloseFull Screen / Esc
Print Version Interactive Discussion
EGU
can be obtained by the slope-area method involving hydraulic calculations based on post-event high flood mark surveys or on water levels measured with new airborne or space radar techniques (Alsdorf et al.,2000). Such measurements, however, are usu-ally campaign-based, and not continuous, and thus not reusu-ally suitable for longer term change analyses. Usually, overbank flood discharges are obtained by comparison with
5
continuous measurements at upstream/downstream stations where entire discharge is measurable (e.g.Wyzga,1999) or by extrapolation of a known in-bank stage-discharge curve to overbank conditions (e.g.Chen and Chiu,2004). However, these techniques are not suitable in systems where there is lateral differentiation of flood dynamics, such as in low gradient rivers and river deltas. Such environments are characterized by very
10
complicated and unsteady water regimes because of large proportion of flow carried as off-channel flow that might lead to the splitting of the flood wave into possibly indepen-dent flow paths of different dynamics. Additionally, the relationship between channel and floodplain flows varies with flood level, between systems, and within a system, depending on the hydraulic connectivity of floodplains, and the nature of the
channel-15
floodplain link. For example, in some systems the role of floodplain flow increases with flood levels, while in others, lateral floodplain storage effects dominate during larger floods, with little floodplain flow in the longitudinal direction (Wyzga,1999). Analysis of flood dynamics and change in such systems from time series of hydrological measure-ments has to take into account the occurrence of possible endogenic change taking
20
place. In addition, observations from a given hydrometric station have to be related to other stations, ideally where internal change is known not to take place, e.g. inlet to the delta (Polonsky,1996).
The Okavango Delta is a RAMSAR site, the natural resources of which support a large tourism industry and subsistence of the local population. In the last three decades
25
a general decline of flooding extent occurred, with some parts of the system being af-fected more than others. So far, the system has escaped major human interventions, but technical alterations such as channel clearing are being considered. These propos-als are prompted by drying up of floodplains and development of vegetation blockages
HESSD
2, 1865–1892, 2005 Flooding dynamics in Okavango Delta P. Wolski and M. Murray-Hudson Title Page Abstract Introduction Conclusions References Tables Figures J I J I Back CloseFull Screen / Esc
Print Version Interactive Discussion
EGU
in channels in the vicinity of settlements and safari camps. Such actions are, due to their capacity to alter the natural hydrological and geomorphological dynamics of the system, potentially harmful to the Delta ecosystem functioning, and they hydrotechni-cal results might not be sustainable. Understanding of the processes causing flood decline and flooding shifts is thus absolutely necessary for proper management of the
5
natural resources associated with the Delta in general, and for taking decisions about any technical interventions in particular.
In this paper we systematize and analyse hydrometric data from channels in the eastern part of the Okavango Delta, where responses differ widely, suggesting that at least several processes act simultaneously to produce the observed flooding
condi-10
tions. We detail processes causing the observed hydrological responses, and thus im-prove the understanding of the hydrological functioning of the Okavango Delta system. In the broader context, with the example of the Okavango Delta we illustrate issues of flooding dynamics and change in a channel-floodplain network of a low gradient broad system, as influenced by a combination of endogenic and exogenic processes, and as
15
modified by hydraulic relationships between channels and floodplains.
2. Study site
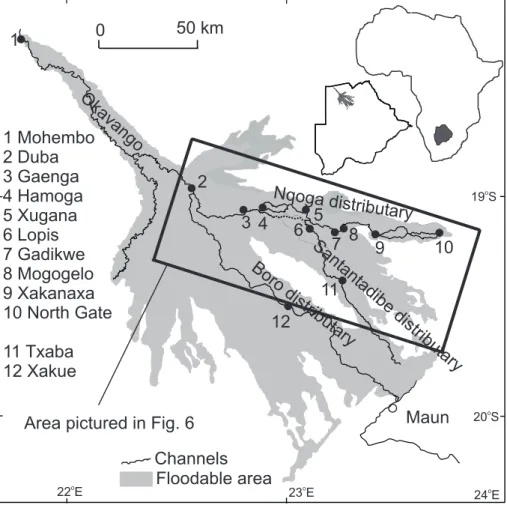
The main features of the Okavango Delta have been described in detail elsewhere in the literature (e.g.Gieske,1997;Gumbricht et al.,2004;McCarthy et al.,1998). In brief, the Delta is a large alluvial fan with a mean surface gradient in the order of 1:3700,
20
where water and sediment from the inflowing Okavango river are spread across the conical surface through a system of channels and floodplains (Fig.1). Channels in the system generally have a rectangular cross-section, and permeable banks formed by reeds and sedges (Ellery et al., 2003). The upper part of the Delta, the Panhandle, is a 15 km broad fault-bounded flat-bottomed valley, with a well defined meandering
25
channel. At the apex of the alluvial fan proper, the channel flows through a relatively unbounded system of floodplains. Further downstream, presence of chains of islands
HESSD
2, 1865–1892, 2005 Flooding dynamics in Okavango Delta P. Wolski and M. Murray-Hudson Title Page Abstract Introduction Conclusions References Tables Figures J I J I Back CloseFull Screen / Esc
Print Version Interactive Discussion
EGU
results in differentiation of relatively separate distributaries, forming the characteristic fan shape, with Chief’s Island, the largest land mass in the Delta, dividing the system into an eastern and a western part. Within each of the distributaries there is a relatively well defined channel, or system of channels, which drain the headwater floodplains of the distributary and often have no direct, or a very limited link to the main channel of
5
the Okavango river. The accession of flood to distributaries takes place either through a narrow channel link, or through seepage from the main channel across its vegetated banks. The most eastern distributary, including the Nqoga, Maunachira and Khwai river systems, referred to here simply as the Nqoga, is the direct extension of the main Okavango channel and thus considered here the primary distributary. The
Santanta-10
dibe distributary, which includes the Mboroga, Gomoti, Santantadibe and Mogogelo river systems branches off from the Nqoga east of Chief’s Island. The Boro distributary branches off west of Chief’s Island. The Santantadibe and the Boro are considered to be secondary distributaries.
The annual flood event in the Okavango Delta is off phase with the rainy season: the
15
rainy season lasts from November to March, while the flood wave peaks at the Delta inlet in April, and maximum flood extent is recorded in August/September. This is partly caused by delay of the flood wave on its way from the 600 km distant headwaters of the feeding Okavango river, and partly by slow propagation of the flood in the Delta proper.
3. Materials and methods
20
Data used in the analyses presented here were obtained from the Department of Water Affairs’ hydrological monitoring network of the Okavango Delta. This network comprises numerous water level gauging sites (H) and several discharge measure-ment sites (Q), all located on channels. Measuremeasure-ments are theoretically done once monthly, and more frequently only at Mohembo and Maun. Due to mainly accessibility
25
and logistical problems, long gaps are often present. Water levels are read from staff gauges. Discharge measurements are made with a current meter in natural channel
HESSD
2, 1865–1892, 2005 Flooding dynamics in Okavango Delta P. Wolski and M. Murray-Hudson Title Page Abstract Introduction Conclusions References Tables Figures J I J I Back CloseFull Screen / Esc
Print Version Interactive Discussion
EGU
cross-sections using standard hydrological methods. For the purpose of this work, discharge, mean flow velocity, mean and maximum recorded profile depth as well as width of measurement section, were extracted from DWA database for each discharge record (obviously, these were not available for water level stations). The elevation of channel bed with respect to gauge zero level (arbitrary) was then calculated by
sub-5
tracting recorded channel depth from the recorded water level.
All available time series were plotted and the data series were visually screened for outliers and possible systematic errors, but no strict outlier identification procedure was applied. The visually detected outliers were identified mostly as typographic errors, which in several cases were confirmed by reverting to original measurement forms. In
10
doubtful cases, the rule was to leave the suspect data points as they were, and take into consideration that they were possibly erroneous points during the analyses.
In most of the analysed data series trends were conspicuous and detectable by visual interpretation, and therefore statistical trend analyses were considered superflu-ous. Methods used in the analyses thus comprised visual interpretation of trends and
15
their comparison for various stations. This was done in a qualitative manner and in a framework of possible hydrological links between the parts of the analysed system that were represented by the measurement stations.
4. Observed variation in hydrological inputs and responses
4.1. Hydrological inputs
20
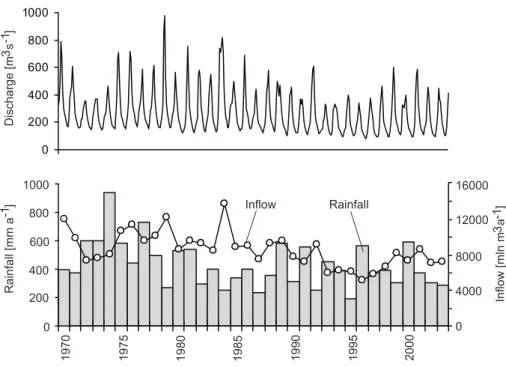
A reduction in rainfall and inflow to the Delta is observed between the 1970s and 1990s (Fig.2), with the lowest rainfall and inflow recorded respectively in 1995 and 1996. After 1996, there is a slight upward trend in inflow and a less accentuated one in rainfall. The river inflow to the Okavango Delta and rainfall over it are poorly correlated (r=0.08). Although rainy season flooding occurs only during high rainfall years, the flood extent
25
HESSD
2, 1865–1892, 2005 Flooding dynamics in Okavango Delta P. Wolski and M. Murray-Hudson Title Page Abstract Introduction Conclusions References Tables Figures J I J I Back CloseFull Screen / Esc
Print Version Interactive Discussion
EGU
also reflect antecedent wetness conditions (Gumbricht et al.,2004).
4.2. Water levels and discharges in the secondary distributaries (Boro and Santanta-dibe)
The behaviour of flood within each of the the two secondary distributaries is similar, and thus, for the sake of brevity, is presented here using selected stations only that are
5
considered representative of these systems. Flooding in the Boro distributary (Fig.3) is very dynamic in terms of both seasonal and interannual variation in water levels and discharges, and, by comparison with Fig.2, corresponds rather well to the variation in hydrological inputs. A characteristic feature of the inter-annual variation is the decline in water levels and discharges occurring in the 1990–1996 period and their subsequent
10
recovery between 1997 and 2000. In the Santantadibe distributary, there is very little seasonality in water levels, and discharges display a peculiar pattern, which appears to bear no relation to the water level trend.
4.3. Trends and variation in water levels and discharges in the primary distributary (Nqoga)
15
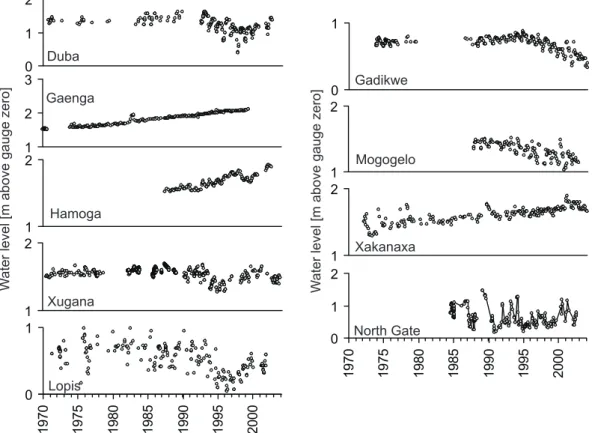
The Gaenga, Hamoga, Gadikwe, Mogogelo and Xakanaxa stations in the Nqoga dis-tributary (Fig.4), show trends in water levels that do not correspond to the inflow trend presented in Fig.2. Water levels at Gaenga, Hamoga and Xakanaxa have risen con-tinuously throughout the period of observations, while those at Gadikwe and Mogogelo are initially stable and start dropping in the 1990s, without the characteristic recovery
20
observed in inflow to the Delta, and in other distributary systems during the late 1990s. Duba, Xugana and Lopis (Fig.4) display stable water levels between 1970 and 1990, and after that water levels drop till 1996 and subsequently recover till 2000 to achieve levels similar to those of the 1980s. The station from the distal part of the distribu-tary, North Gate, shows rather erratic water level fluctuations, with a strong rise often
25
HESSD
2, 1865–1892, 2005 Flooding dynamics in Okavango Delta P. Wolski and M. Murray-Hudson Title Page Abstract Introduction Conclusions References Tables Figures J I J I Back CloseFull Screen / Esc
Print Version Interactive Discussion
EGU
level fluctuations is low at Gaenga and Hamoga (<0.15 m), but is more pronounced at Duba and the remaining stations (typically >0.3 m).
4.4. Trends and variation in flow characteristics and channel geometry at the Nqoga distributary stations
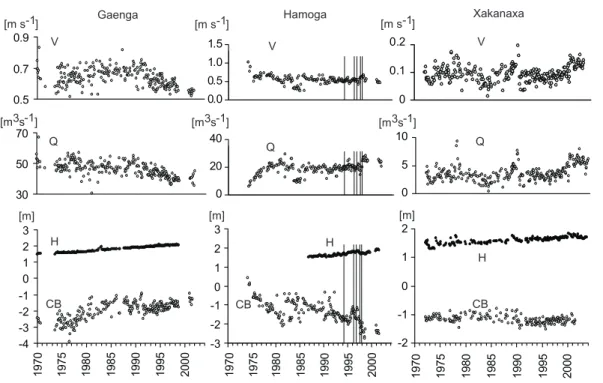
Gaenga station on Nqoga (Fig.5) shows, during the entire observation period, a steady
5
decline in discharges concurrent with the decline in flow velocities, and accompanied by a steady rise in channel bed elevation. At the Hamoga site (Fig. 5) discharges rose strongly between 1973 and 1979 and subsequently stabilized. Channel bottom elevation dropped by over 2 m between 1974 and 2000. A small reduction in mean flow velocity was recorded between 1974 and 2001. At Xakanaxa (Fig.5), flow velocity and
10
discharge varied in a pattern approximating a 10-year cycle. Channel bed elevation decreased by approximately 0.1 m between 1970 and 2001.
5. Interpretation
The responses observed in different reaches of the Nqoga distributary differ consider-ably, and do not appear to display any consistent pattern along the system. This is in
15
contrast to the other distributaries, i.e. Boro and Santantadibe, the responses of which differ, but are consistent within each. To explain the differences between the distribu-taries as well as differences between discrete reaches in the Nqoga, we consider here several processes, namely:
– channel aggradation,
20
– channel/floodplain interactions, – human interventions in the system,
HESSD
2, 1865–1892, 2005 Flooding dynamics in Okavango Delta P. Wolski and M. Murray-Hudson Title Page Abstract Introduction Conclusions References Tables Figures J I J I Back CloseFull Screen / Esc
Print Version Interactive Discussion
EGU
– dynamics of aquatic vegetation.
5.1. Channel aggradation processes
The process of aggradation of the Okavango Delta channels with bedload sediment and its effects on the hydrological conditions have been described previously by
Mc-Carthy and Ellery (1997). In short, the process results from the sediment carried into
5
the system by the Okavango river (mostly bedload, composed of well sorted fine to medium sands) being trapped in the channels, as it cannot be carried across the veg-etated banks due to low flow velocities. The deposition of sediment within the channel initiates a series of feedbacks. The build-up of the sediment causes a reduction of channel bed and longitudinal water level slope. This reduces flow velocity and makes
10
the channel susceptible to vegetation blockage, either in the form of accumulation of floating plant debris, or colonization by aquatic vegetation, or, most often by a com-bination of these. Upstream of the aggraded or blocked reach, the lateral (channel-floodplain) gradient increases considerably. Breach of the flanking vegetation might occur along a line of weakness, such as a hippo path, and a new channel can form,
15
bypassing the blocked section. Neotectonic activity may facilitate development of the new channel.
Conditions indicating channel aggradation, i.e. a slow, gradual rise in river bed level, a concomitant rise in water level and reduction in channel discharge, occur at Gaenga on the Nqoga. The process at Gaenga accommodates sediment supplied by the main
20
Okavango river, and is essentially a continuation of the aggradation of the Nqoga and upper Mboroga described byMcCarthy et al.(1987) andWilson (1973). The gradual rise in water levels is observed also at Hamoga, where it must be the effect of the same process, and indicates its sub-regional character. However, changes in channel geometry and channel discharge at Hamoga do not indicate the aggradation process.
25
The channel at Hamoga is man-made, and its hydrological responses are explained in details below in the section on human interventions in the system. A critical factor in the aggradation of the Gaenga/Hamoga area is that the morphology of the distributary
HESSD
2, 1865–1892, 2005 Flooding dynamics in Okavango Delta P. Wolski and M. Murray-Hudson Title Page Abstract Introduction Conclusions References Tables Figures J I J I Back CloseFull Screen / Esc
Print Version Interactive Discussion
EGU
is such that the water lost from the channel to the floodplains is retained within the distributary, although as off-channel flow. Therefore, no downstream effects of this process, i.e. no reduction of water level and discharges, are visible yet.
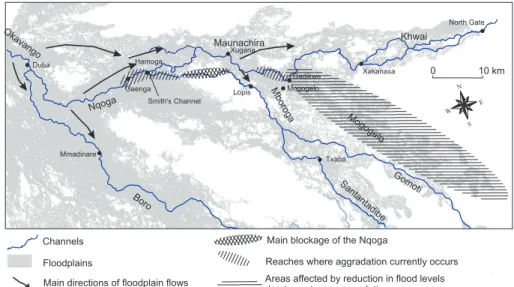
Channel aggradation is also taking place in the Maunachira reach between Xugana and Gadikwe (Fig.6), but this is not directly captured by the observation network.
Mc-5
Carthy et al. (1992) investigated this stretch of the Maunachira in 1987–1989, and found a significant reduction in channel flow velocity and reduction of sediment trans-port rate occurring in the downstream direction, accompanied by high lateral channel-floodplain water level gradients in the upper part of that reach. These were interpreted as indicative of aggradation of the lower reach of the Maunachira, and channel flow
10
being redirected towards the surrounding floodplains. The decline in water levels at the Gadikwe and Mogogelo sites (Fig.4) indicates that the process of deprivation of water in that area is currently active. At Txaba (Fig.3) and Xakanaxa (Fig.4) a rise in water levels is observed, indicating that probably, water previously supplying the Gadikwe and Mogogelo region is being redirected to those locations. The flow between the
15
upstream part of the failing Maunachira and the Khwai may be via floodplains to the north of the Maunachira channel (Fig. 6), in a sense straightening the route of the Maunachira between Xugana and Xakanaxa. Such a possibility is corroborated using reasoning similar to that applied byMcCarthy et al. (1992). Namely, the spectral re-sponse as seen in satellite images, suggests the presence of actively growing papyrus
20
at the eastern tip of Xugana lediba (lake). This indicates that fresh, nutrient rich water is actively passing through there towards floodplains linking that site with the Xakanaxa area.
The effects of aggradation of the Maunachira should also be manifested by rising water levels in the upstream of the affected reach, i.e. at Xugana. The water level
25
rise at Xugana was observed only until 1990, but after that the reduction in water level characteristic to the 1990s took place. As discussed below, the Xugana site responds rather strongly to the annual flood pulse and interannual variation in flood size (Fig.4). Therefore, the eventual increase in water levels resulting from aggradation of the middle
HESSD
2, 1865–1892, 2005 Flooding dynamics in Okavango Delta P. Wolski and M. Murray-Hudson Title Page Abstract Introduction Conclusions References Tables Figures J I J I Back CloseFull Screen / Esc
Print Version Interactive Discussion
EGU
Maunachira on Xugana are probably masked by the response of water levels at this station to the interannual variation in discharge.
5.2. Channel-floodplain interactions
Seasonal water level fluctuations are much more pronounced at Xugana and Lopis, and at Gadikwe and Mogogelo, than they are at Hamoga and Gaenga (Fig.4). Also,
5
water levels at Duba show stronger seasonal fluctuations than Gaenga and Hamoga. Previously, this was explained by the effect of flow confinement (McCarthy et al.,1998;
Wilson and Dinc¸er,1976). In the Gaenga and Hamoga area the flow emerging from the Panhandle becomes relatively unbounded, as the floodplains surrounding the channel are wide. Water flowing in from the Duba area, when spread uniformly over the large
10
area of floodplains around Gaenga could thus cause only minor water level fluctuations. When flow is confined in the Xugana area, seasonal water level fluctuations again become large. There is, however, a relatively well pronounced interannual variation visible in the downstream sites of Xugana and Lopis water level hydrographs, which cannot be explained by the flow confinement model, as this variation is not visible at
15
the upstream sites of Gaenga and Hamoga. This suggests that the Xugana and Lopis sites are supplied not only from the Nqoga channel, but also by a system of different dynamics. Considering the setting of the Xugana and Lopis area, the flood pulse must be delivered there by the floodplain system located to the north of the main Nqoga channel (Fig.6). Seasonally varying flows must originate from upstream of Gaenga,
20
probably from the vicinity of Duba, where seasonal fluctuations in channel water levels are well pronounced. Flood accession to that floodplain system must be by overbank spill through the east bank of the main channel.
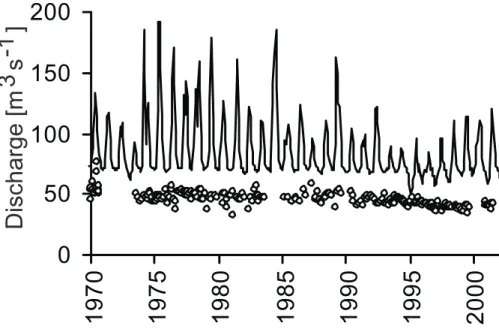
The differences in dynamics of channel and floodplain flows in the vicinity of Gaenga are illustrated in Fig. 7, which compares the observed discharges with ones
simu-25
lated by a semi-distributed hydrological model1. The model simulation represents
1
HESSD
2, 1865–1892, 2005 Flooding dynamics in Okavango Delta P. Wolski and M. Murray-Hudson Title Page Abstract Introduction Conclusions References Tables Figures J I J I Back CloseFull Screen / Esc
Print Version Interactive Discussion
EGU
distributary-wide discharge that is necessary to reproduce the observed flood expan-sion in the downstream parts of the distributary. Floodplain flows, which would account for the difference between the model simulated distribuary discharge and observed channel discharge, are obviously much more dynamic than the channel flow, and on average have similar magnitude as the channel flow.
5
The separation of flow into channel and floodplain flows characterized by di ffer-ent seasonal and interannual dynamics can be explained by the specificity of chan-nel/floodplain interactions. Channels in the Delta are bounded either by a floating pa-pyrus stands or by emergent vegetation, usually sedges and grasses (Ellery et al.,
1995). Along papyrus-defined banks, a small rise of channel water level causes rise of
10
the floating papyrus rhizome and thus a significant reduction in resistance to flow from the channel to the flanking floodplain. Along the reaches bound by rooted sedges and grasses, the resistance to lateral flow from channel to floodplain is a function of depth: increasing channel water levels meet with significantly decreasing resistance to flow from the channel to the flanking floodplain. This is a result of a decline in stem density,
15
diameter and resistance to bending with height in the bank vegetation. In both settings, under favourable conditions in the flanking floodplains, i.e. lower water level than that in the channel maintained by large evaporative area or strong downstream drainage, the flood wave surcharging the channel accedes to the floodplains. As a result of this process, the downstream reaches of the channel could receive a relatively constant
20
amount of water. The channel water level hydrograph thus gets considerably flattened in the downstream direction, i.e. seasonal and interannual variation is considerably attenuated.
The process of separation of flow into channel and floodplain flows of different sea-sonal and interannual dynamics, apart from causing the differences in seasonal
ampli-25
tude of water level fluctuations within Nqoga distributary, is the principal cause of major differences in flood dynamics at the scale of the entire Delta system. This process occurs in the area where the Boro separates from the Okavango main channel caus-the Okavango Delta, Botswana, J. Hydrol., submitted, 2005.
HESSD
2, 1865–1892, 2005 Flooding dynamics in Okavango Delta P. Wolski and M. Murray-Hudson Title Page Abstract Introduction Conclusions References Tables Figures J I J I Back CloseFull Screen / Esc
Print Version Interactive Discussion
EGU
ing large seasonal water level fluctuations and expansion/contraction of the inundated area in the Boro system, while the flooding in the Nqoga distributary generally remains more stable and permanent.
5.3. Effects of human interventions
Hamoga site is located at the inlet to Smith’s Channel, which is a man-made channel
5
opened in September 1973. It was cut between the failing Nqoga channel, upstream of a blockage, and one of the backswamp channels connecting to the Maunachira. The length of the cut stretch was 200 m. At the time of cutting, there was a 1.5 m water level difference between the Nqoga and the flanking floodplains, and vigorous flow with bed erosion was observed immediately after cutting. Data from Hamoga shows that
10
hydrological conditions and channel geometry have been changing since the opening of the channel, and that they are still changing today, 30 years later. Channel discharge increased initially fast but stabilized after 5 years. In view of the continuously changing channel geometry (i.e. erosion of the channel bottom) that discharge stabilization must express the adjustment of the sub-regional water level gradient to the presence of that
15
channel. The change in the geometry of Smith’s Channel expresses in turn a much slower adjustment of channel grade to that sub-regional water level gradient. The rise in water levels at Hamoga seems to be independent of processes taking place within the channel, and result rather from the larger-scale process of aggradation of the Nqoga.
20
The observable effects of Smith’s Channel opening on flood in the distributary are relatively local. The strong increase in Smith’s Channel discharges between 1973 and 1978 is reflected in neither upstream (Gaenga), nor downstream (Xugana) locations. The presence of Smith’s Channel has not affected the process of aggradation of Nqoga, and water continues to build up in the failing reach as evident by rising water levels at
25
Hamoga and Gaenga. The observed steady rise in water levels at Xakanaxa could potentially be caused by the opening of Smith’s Channel, as was suggested byKraatz
HESSD
2, 1865–1892, 2005 Flooding dynamics in Okavango Delta P. Wolski and M. Murray-Hudson Title Page Abstract Introduction Conclusions References Tables Figures J I J I Back CloseFull Screen / Esc
Print Version Interactive Discussion
EGU
(1992) in the mid-Maunachira, the effect of the Xakanaxa water level rise is probably caused rather by redirection of water from the headwaters of the Gomoti and Mogogelo than by the opening of Smith’s Channel. It is, however, possible (although not evident from the data) that the opening of Smith’s Channel caused an increase in bedload transport to the Maunachira and thus accelerated the process of its aggradation
be-5
tween Xugana and Gadikwe.
In spite of relatively high water flow velocities, Smith’s Channel, and the reaches downstream of it, have been blocked with floating papyrus several times since its open-ing. These blockages have periodically been cleared primarily for the purposes of keeping the channel navigable. Data on the clearing activities are available only for the
10
period of after 1983. These took place in Febrary–May 1994, January–March 1996, September 1996, May–June 1997 and September 1997 (Fig.5). The channel has not been cleared since then, and in 2002 a papyrus blockage extended for more than 1 km. Only the 1997 clearing activities were associated with an increase in flow velocities and discharge. It is reported that when the channel is blocked, there is relatively little flow
15
on its downstream side (McCarthy et al., 1992). The inflowing water, as recorded at Hamoga, must thus be relatively freely redirected from the channel to the surrounding floodplains. Therefore, the blocking of the Smith’s Channel does not significantly affect flows between Nqoga and Maunachira, implying that the bulk of water accession to the Maunachira is through bank filtration.
20
5.4. Responses to local rainfall and river flood
Local rainfall plays a role in flooding at North Gate on the Khwai (Fig. 4). There are distinct peaks in water level occurring during the rainy season. Although the North Gate record is fragmentary, the long-term variation seems to correspond to variation in rainfall more than to variation in upstream flows. The correlation coefficient r between
25
the maximum flood season water level at North Gate and annual rainfall is 0.78, be-tween the maximum flood season water level at North Gate and Xakanaxa flow velocity is 0.56 and between the maximum flood season water level at North Gate and annual
HESSD
2, 1865–1892, 2005 Flooding dynamics in Okavango Delta P. Wolski and M. Murray-Hudson Title Page Abstract Introduction Conclusions References Tables Figures J I J I Back CloseFull Screen / Esc
Print Version Interactive Discussion
EGU
Mohembo inflow volume is 0.60. At Lopis and Xugana, a rise in water levels is often recorded during rainy seasons (Fig. 4), but it is superimposed on the much stronger flood peak corresponding to the Okavango river flood wave, and the latter dominates the interannual variation in water levels at these stations. At Xakanaxa, rainy season water level peaks are visible only during the high rainfall years (1974, 1978, 1989,
5
2000), while at Gaenga and Hamoga there is no direct effect of rainfall visible, and trends at these stations are obviously not related to rainfall variation.
5.5. Dynamics of aquatic vegetation
Discharge at Xakanaxa shows variation approximating a 10-year cycle (Fig.5), and is unrelated to the variation in water levels. This peculiar variation is observed also in the
10
Santantadibe stations (Txaba in Fig.3and others not presented here), and has never been described before in the Okavango Delta, and to the best of our knowledge, in any other wetland system. At this stage, the processes underlying this cycle can only be hypothesised, and we think that the best explanation is that by dynamics of aquatic vegetation, as outlined below.
15
The velocity variation is not accompanied by a concurrent water level change. As there is no water level change, it is not likely that the flow velocity variation results from a change in water surface gradient. Therefore, the only possible explanation of the velocity variation seems to be a change in channel conveyance capacity. As the channel geometry (width and depth) also does not vary concurrently with flow velocity,
20
the variation in channel conveyance capacity has to be attributed to a change in resis-tance to flow. This could be caused by cyclical changes in channel or channel margin vegetation. Nutrients are supplied to the Okavango Delta mostly by the inflowing wa-ter. Because the loads are low, the system is generally considered oligotrophic (
Cron-berg et al., 1996), and channel-fringe and floodplain emergent macrophyte species
25
are adapted to these conditions, showing very tight nutrient cycling (Mitsch and
Gos-selink,2000;Thompson,1976). Given the perennial anaerobic conditions prevailing in the characteristically low-fluctuation Santantadibe distributary, it is possible that the
dis-HESSD
2, 1865–1892, 2005 Flooding dynamics in Okavango Delta P. Wolski and M. Murray-Hudson Title Page Abstract Introduction Conclusions References Tables Figures J I J I Back CloseFull Screen / Esc
Print Version Interactive Discussion
EGU
charge variations occur in response to a cyclic change in the density of channel fringing vegetation (and consequently its resistance to movement of water, both within channel and between channel and floodplain). Such a variation could be triggered by spikes in nutrient input (as, for example, might result from an extensive burn, or the re-flooding of desiccated floodplains, upstream – both these processes have been recorded in the
5
provenance of this system). The increased nutrient supply would result in a rapid over-growth of channel fringe vegetation, with a consequent increase in resistance to flow, but no change in “hard” channel geometry. The internal cycling efficiency of fringing plants would ensure that the effects of the spike would support growth for a number of seasons. Under the anaerobic conditions, however, senescence would gradually
10
remove nutrients from the active vegetation to be sequestered, or removed, in the slow cycling detrital processing system. The fringing vegetation would gradually revert to a less dense growth, allowing channel velocities to increase again. Undoubtedly, more work is required to elucidate these changes and their possible causes.
6. Conclusions
15
The data presented here were analysed in the context of improvement of the under-standing of seasonal and long-term flood pulsing and their changes in a low gradient system of channels and floodplains. We have described a system where channels and floodplains display significantly different seasonal and inter-annual dynamics of flood wave propagation. As a result, hydrometric stations located on channels record the
20
effects of in-channel changes, but the effects of variation of hydrological inputs are captured neither by water levels, nor by discharges. We were, however, able to show that such variation is present in the analysed system at the distributary level. This was done based on data from a few stations that to a certain extent integrated distributary-wide response, and displayed inter-annual variation qualitatively similar to that of
hy-25
drological inputs. Due to the lack of certainty as to the extent to which such stations reflect distributary-wide dynamics, as opposed to channel dynamics only, systematic
HESSD
2, 1865–1892, 2005 Flooding dynamics in Okavango Delta P. Wolski and M. Murray-Hudson Title Page Abstract Introduction Conclusions References Tables Figures J I J I Back CloseFull Screen / Esc
Print Version Interactive Discussion
EGU
analyses of flood changes in response to hydrological inputs were not possible. The Okavango Delta is a system with rather unique channel-floodplain interactions, creat-ing often extreme differences in channel and off-channel flood dynamics, probably not to be encountered in such an extent in other floodplain systems. However, it serves to show that analyses of flood pulse dynamics,change, and hydrological variation in a
5
large low gradient system cannot be done based on measurements at a single point of system cross-section. Such analyses have to be done using a comprehensive ar-ray of hydrometric observation sites, designed to capture variation of both in-channel and off-channel flows, and should preferably include flood extent maps derived from remote-sensing images. Little systematic work of such nature has been reported in the
10
hydrological literature.
The data set presented in this study allowed for the capture and systematization of major differences in seasonal and interannual dynamics in “channel” water levels and discharges within the analysed distributary. More importantly, the comparison of data from various stations allowed the identification of probable causes of these
15
differences. Water levels and discharges at any given channel site in the Nqoga system are influenced by a complex interplay of flood wave and local input modified by channel-floodplain interactions, sedimentation and technical interventions, both at the given site and upstream. Additionally, cyclical variation of channel margin vegetation due to nutrients recycling might play a role. These processes act at different scales, affecting
20
parts of the Nqoga distributary, but also the entire system of the Okavango Delta. The analyses presented here set the ground for on-going work addressing the seasonal and inter-annual dynamics of the flood pulse in the Okavango Delta, that will make use of detailed satellite data-derived flood maps.
Acknowledgements. Work presented here was funded by EU in the framework of a project
25
Water and Environmental Resources for Regional Development, coded ICA-4-CT-2001-10040. Department of Water Affairs, Republic of Botswana is acknowledged for providing the data.
HESSD
2, 1865–1892, 2005 Flooding dynamics in Okavango Delta P. Wolski and M. Murray-Hudson Title Page Abstract Introduction Conclusions References Tables Figures J I J I Back CloseFull Screen / Esc
Print Version Interactive Discussion
EGU
References
Alsdorf, D. E., Melack, J. M., Dunne, T., Mertes, L. A. K., Hess, L. L., and Smith, L. C.: Inter-ferometric radar measurements of water level changes on the Amazon flood plain, Nature, 404, 174–177, 2000. 1868
Chen, Y. C. and Chiu, C. L.: A fast method of flood discharge estimation, Hydrological
Pro-5
cesses, 18, 1671–1684, 2004. 1868
Cronberg, G., Gieske, A., Martins, E., Prince-Nengu, J., and Stenstrom, I.: Major ion chemistry, plankton, and bacterial assemblages of the Jao/Boro River, Okavango Delta, Botswana: the swamps and flood plains, Arch. Hodrobiol./Suppl., 3, 335–407, 1996. 1880
Ellery, W. N. and McCarthy, T. S.: Principles for the sustainable utilization of the Okavango
10
Delta ecosystem, Botswana, Biological Conservation, 70, 159–168, 1994. 1867
Ellery, W. N., Ellery, K., Rogers, K. H., and McCarthy, T. S.: The role of Cyperus papyrus L. in channel blockage and abandonment in the northeastern Okavango Delta, Botswana, African Journal of Ecology, 33, 25–49, 1995. 1877
Ellery, W. N., McCarthy, T. S., and Smith, N. D.: Vegetation, hydrology, and sedimentation
15
patterns on the major distributary system of the Okavango Fan, Botswana, Wetlands, 23, 357–375, 2003. 1869
Gieske, A.: Modelling outflow from the Jao/Boro River system in the Okavango Delta, Botswana, J. Hydrol., 193, 214–239, 1997. 1869
Gumbricht, T., Wolski, P., and McCarthy, T. S.: Forecasting the spatial extent of the annual flood
20
in the Okavango Delta, Botswana, J. Hydrol., 290, 178–191, 2004. 1869,1872
Hauer, F. H. and Lorang, M. S.: River regulation, decline of ecological resources, and potential for restoration in a semi-arid lands river in the western USA, Aquatic Sciences, 66, 388–401, 2004. 1867
Junk, W. J., Bayley, P. B., and Sparks, R. E.: The flood-pulse concept in river-floodplain
sys-25
tems, Special publication of the Canadian Journal of Fisheries and Aquatic Sciences, 106, 110–127, 1989. 1866
Kraatz, D. B.: Improvement of the water supply for flood recession farming in the molapo belt be-twen Maun and Shorobe and in the Thaoge area, Tech. rep., FAO/Government of Botswana, Molapo Development Project, TCP/BOT/2201, Maun, Botswana, 1983. 1878
30
McCarthy, T. and Ellery, W.: The fluvial dynamics of the Maunachira channel system, north-eastern Okavango swamps, Botswana, W. Water, South Africa, 23, 115–126, 1997. 1874
HESSD
2, 1865–1892, 2005 Flooding dynamics in Okavango Delta P. Wolski and M. Murray-Hudson Title Page Abstract Introduction Conclusions References Tables Figures J I J I Back CloseFull Screen / Esc
Print Version Interactive Discussion
EGU
McCarthy, T. S., Ellery, W. N., and Rogers, K. H.: Observation on the abandoned Nqoga Chan-nel of the Okavango Delta, Botswana Notes and Records, 19, 83–89, 1987. 1874
McCarthy, T. S., Ellery, W. N., and Stanistreet, I. G.: Avulsion mechanisms on the Okavango Fan, Botswana: the control of a fluvial system by vegetation, Sedimentology, 39, 779–795, 1992. 1875,1878,1879
5
McCarthy, T. S., Bloem, A., and Larkin, P. A.: Observations on the hydrology and geohydrology of the Okavango Delta, South African Journal of Geology, 101, 101–117, 1998. 1869,1876 Middleton, B. A.: Wetland restoration: Flood pulsing and disturbance dynamics, John Wiley
and Sons, New York, 1999. 1866,1867
Mitsch, W. J. and Gosselink, J. G.: Wetlands, John Wiley and Sons, New York, 2000. 1880
10
Odum, H. T.: Ecological and General Systems: an introduction to systems ecology, University Press of Colorado, Niwot, Co., 1994. 1866,1867
Polonsky, V. F.: Physicostatistical approach to river delta hydrology, Journal of Hydraulic Engi-neering, 122, 333–340, 1996. 1868
Richards, K., Brasington, J., and Hughes, F.: Geomorphic dynamics of floodplains:
ecologi-15
cal implications and a potential modelling strategy, Freshwater Biology, 47, 559–579, 2002. 1867
Stern, D. A., Khanbilvardi, R., Alair, J. C., and Richardson, W.: Description of flow through a natural wetland using dye tracer tests, Ecological Engineering, 18, 173-184, 2001. 1867 Thompson, K.: The primary productivity of African wetlands, with particular reference to the
20
Okavango Delta, in Symposium on the Okavango Delta and its future utilization, Botswana Society, Gaborone, Botswana, 1976. 1880
Tockner, K. and Stanford, J. A.: Riverine floodplains: present state and future trends, Environ-mental Conservation, 29, 308–330, 2002. 1867
van der Nat, D., Tockner, K., Edwards, P. J., Ward, J. V., and Gurnell, A. M.: Habitat change
25
in braided flood plains (Tagliamento, NE-Italy), Freshwater Biology, 48, 1799–1812, 2003. 1867
Wilson, B. H.: Some Natural and Man-made Changes in the Channels of the Okavango Delta, Botswana Notes and Records, 5, 132–153, 1973. 1874
Wilson, B. H. and Dinc¸er, T.: An introduction to the hydrology and hydrography of the Okavango
30
Delta, in Symposium on the Okavango Delta and its future utilization, Botswana Society, Gaborone, Botswana, 1976. 1876
HESSD
2, 1865–1892, 2005 Flooding dynamics in Okavango Delta P. Wolski and M. Murray-Hudson Title Page Abstract Introduction Conclusions References Tables Figures J I J I Back CloseFull Screen / Esc
Print Version Interactive Discussion
EGU
frequency, J. Hydrol., 153, 317–337, 1994. 1866
Wyzga, B.: Estimating mean flow velocity in channel and floodplain areas and its use for ex-plaining the pattern of overbank deposition and floodplain retention, Geomorphology, 28, 281–297, 1999. 1868
HESSD
2, 1865–1892, 2005 Flooding dynamics in Okavango Delta P. Wolski and M. Murray-Hudson Title Page Abstract Introduction Conclusions References Tables Figures J I J I Back CloseFull Screen / Esc
Print Version Interactive Discussion EGU Okavango 22 Eo 20 So 19 So 23 Eo 24 Eo 0 50 km Maun 1 Mohembo 2 Duba 3 Gaenga 4 Hamoga 5 Xugana 6 Lopis 7 Gadikwe 8 Mogogelo 9 Xakanaxa 10 North Gate 11 Txaba 12 Xakue 1 2 3 4 6 5 7 8 9 10 11 12 Channels Floodable area
Nqoga distributary
Boro distribut ary Sant ant adibe distribut ary
Area pictured in Fig. 6
HESSD
2, 1865–1892, 2005 Flooding dynamics in Okavango Delta P. Wolski and M. Murray-Hudson Title Page Abstract Introduction Conclusions References Tables Figures J I J I Back CloseFull Screen / Esc
Print Version Interactive Discussion EGU 0 200 400 600 800 1000 1000 800 600 400 200 0 0 4000 8000 12000 16000 1970 1975 1980 1985 1990 1995 2000 Discharge [m s ] 3 -1 Rainfall [mm a ] -1 Inflow [mln m a ] 3 -1 Rainfall Inflow
Fig. 2. Discharge hydrograph of Okavango river at Mohembo, mean annual rainfall and total annual inflow to the Okavango Delta.
HESSD
2, 1865–1892, 2005 Flooding dynamics in Okavango Delta P. Wolski and M. Murray-Hudson Title Page Abstract Introduction Conclusions References Tables Figures J I J I Back CloseFull Screen / Esc
Print Version Interactive Discussion EGU 0 1 2 3 1970 1975 1980 1985 1990 1995 2000 [m] [m] 1970 1975 1980 1985 1990 1995 2000 0 25 50 [m s ]3 -1 [m s ]3 -1 H H Q Q 0 1 2 0 10 20
Txaba (Santantadibe) Xakue (Boro)
Fig. 3. Water levels and discharges for selected stations on the Santantadibe and Boro system. Q – discharge, H – water level.
HESSD
2, 1865–1892, 2005 Flooding dynamics in Okavango Delta P. Wolski and M. Murray-Hudson Title Page Abstract Introduction Conclusions References Tables Figures J I J I Back CloseFull Screen / Esc
Print Version Interactive Discussion EGU 1 2 0 1 1 20 1 Xugana Lopis Gadikwe Mogogelo 1 2 1 2 Xakanaxa Hamoga 1 2 3 Gaenga North Gate 0 1 2 Duba W ater level [m above gauge zero] W ater level [m above gauge zero] 0 1 2 1970 1975 1980 1985 1990 1995 2000 1970 1975 1980 1985 1990 1995 2000
Fig. 4. Water level hydrographs for stations in the Nqoga system. Note differences in scale between Duba, Gaenga, North Gate and the remaining stations.
HESSD
2, 1865–1892, 2005 Flooding dynamics in Okavango Delta P. Wolski and M. Murray-Hudson Title Page Abstract Introduction Conclusions References Tables Figures J I J I Back CloseFull Screen / Esc
Print Version Interactive Discussion EGU H H Q V [m] [m] [m] CB CB Q V
Gaenga Hamoga Xakanaxa
H CB Q V 0.0 0.5 1.0 1.5 0 5 10 -2 -1 0 1 2 -3 -2 -1 0 1 2 3 0 20 40 0.5 0.7 0.9 30 50 70 -4 -3 -2 -1 0 1 2 3 0 5 0 5 0 5 197 197 198 198 199 199 2000 0 5 0 5 0 5 197 197 198 198 199 199 2000 0 5 0 5 0 5 197 197 198 198 199 199 2000 0 .1 .2 0 0 [m s ]-1 [m s ]-1 [m s ]-1 [m s ]3 -1 [m s ]3 -1 [m s ]3 -1
Fig. 5. Discharge and channel characteristics for stations in the Nqoga system. V – flow velocity, Q – discharge, H – water level, CB – channel bottom elevation relative to gauge zero, vertical lines in the Hamoga graphs represent Smith’s Channel clearing activities.
HESSD
2, 1865–1892, 2005 Flooding dynamics in Okavango Delta P. Wolski and M. Murray-Hudson Title Page Abstract Introduction Conclusions References Tables Figures J I J I Back CloseFull Screen / Esc
Print Version Interactive Discussion EGU Boro Nqoga Maunachira Mboroga Khwai Sant ant adibe Okavango Duba Mmadinare Gaenga Hamoga Smith's Channel Xugana Lopis Txaba Gadikwe Mogogelo Xakanaxa North Gate
Main blockage of the Nqoga
Reaches where aggradation currently occurs Main directions of floodplain flows Areas affected by reduction in flood levelsdue to upstream aggradation Channels
Floodplains
0 10 km
Gomoti Mogogelo
HESSD
2, 1865–1892, 2005 Flooding dynamics in Okavango Delta P. Wolski and M. Murray-Hudson Title Page Abstract Introduction Conclusions References Tables Figures J I J I Back CloseFull Screen / Esc
Print Version Interactive Discussion EGU
Discharge
[m
s
]
3
-1
0
50
100
150
200
1970
1975
1980
1985
1990
1995
2000
Fig. 7. Comparison of observed channel discharges at Gaenga (circles), and distributary dis-charges simulated by a hydrological model1for Gaenga cross-section (solid line).