HAL Id: hal-01794245
https://hal.sorbonne-universite.fr/hal-01794245
Submitted on 17 May 2018
HAL is a multi-disciplinary open access
archive for the deposit and dissemination of sci-entific research documents, whether they are pub-lished or not. The documents may come from teaching and research institutions in France or abroad, or from public or private research centers.
L’archive ouverte pluridisciplinaire HAL, est destinée au dépôt et à la diffusion de documents scientifiques de niveau recherche, publiés ou non, émanant des établissements d’enseignement et de recherche français ou étrangers, des laboratoires publics ou privés.
Application of Palynomorph Darkness Index (PDI) to
assess the thermal maturity of palynomorphs: A case
study from North Africa
Amalia Spina, Marco Vecoli, Armelle Riboulleau, Geoff Clayton, Simonetta
Cirilli, Alessandro Di Michele, Annunziato Marcogiuseppe, Roberto Rettori,
Paola Sassi, Thomas Servais, et al.
To cite this version:
Amalia Spina, Marco Vecoli, Armelle Riboulleau, Geoff Clayton, Simonetta Cirilli, et al.. Appli-cation of Palynomorph Darkness Index (PDI) to assess the thermal maturity of palynomorphs: A case study from North Africa. International Journal of Coal Geology, Elsevier, 2018, 188, pp.64-78. �10.1016/j.coal.2018.02.001�. �hal-01794245�
Application of Palynomorph Darkness Index (PDI) to assess the thermal maturity of palynomorphs: a case study from North Africa
Amalia Spinaa*, Marco Vecolib,c, Armelle Riboulleaud, Geoff Claytone, Simonetta Cirillia, Alessandro Di Michelea, Annunziato Marcogiuseppea, Roberto Rettoria, Paola Sassif, Thomas Servaisc, Laurent Riquierg
a. Department of Physics and Geology, University of Perugia, Perugia, Italy
b. Biostratigraphy Group, Geological Technical Services Department, Saudi Aramco, Dhahran 31311, Saudi Arabia
c. Evolution, Ecologie et Paléontologie - UMR CNRS 8198, Université de Lille, Villeneuve d’Ascq 59655, France
d. Laboratoire d’Océanologie et de Géosciences, UMR 8187, Université de Lille, CNRS, Université du Littoral Côte d’Opale, Villeneuve d’Ascq 59655, France
e. Department of Animal and Plant Sciences, University of Sheffield, Sheffield, UK. f. Department of Chemistry, Biology and Biotechnology, University of Perugia, Perugia, Italy
g. Institut des Sciences de la Terre Paris (ISTEP) - UMR CNRS 7193, Université Paris 6, 75252 Paris, France
Abstract
This study focuses on the thermal maturity assessment of Silurian-Devonian sediments from the Ghadamis Basin, North Africa, comparing optical and geochemical analyses of palynomorphs. In southern Tunisia, the investigated subsurface cored section comprises the Argiles Principales Formation of Silurian age. In Libya, the succession studied covers the Awaynat Wanin III and IV formations, assigned to the Late Devonian (Frasnian-Famennian).
Geochemical approaches used to reconstruct thermal alteration of sediments necessitate advanced, relatively expensive analytical techniques. In this study, the effectiveness of the less costly, relatively simple approaches of visually assessing palynomorph colour to determine thermal alteration (i.e., SCI: Spore Colour Index, TAI: Thermal Alteration Index and PDI: Palynomorph Darkness Index) was evaluated.
SCI and TAI are qualitative methods, strictly related to the operator’s perception, which use ten and five point scales respectively, to characterize colour in terms of illustrated specimens and/or descriptions. In contrast, PDI is obtained from the measurement of the red, green and blue (RGB) intensities of light transmitted through palynomorphs, using standard optical microscopes and digital cameras.
The palynomorph-based thermal alteration estimates were compared to Rock-Eval pyrolysis data from the same samples. This calibration showed a linear relationship between these quantitative parameters and PDI. These results show that PDI is more reliable than the SCI and TAI methods.
Keywords: Organic matter, thermal maturity, Silurian, Devonian, Palynomorph Darkness Index,
1. Introduction
It is well known that palynomorphs can be used successfully for a wide range of geological investigations other than biostratigraphy, including sediment provenance analysis (e.g., Vecoli and Samuelsson, 2001), structural geology (e.g. Delcaillau et al., 1998; Dorning, 1986), geo-thermometry (e.g. Pross et al., 2007) and hydrocarbon source rock potential (e.g. Jiang et al., 2016). Sedimentary organic matter (OM) is known for its high sensitivity to thermal evolution. Palynomorphs (e.g. sporomorphs and acritarchs) are composed of resistant organic polymers, the exact molecular structure of which remains the subject of debate; an important characteristic of these polymers is the internal re-ordering of their molecular structure resulting from processes acting during burial (depth and duration, geothermal flux, fluid geochemistry). In many palynomorphs, these processes result in colour alteration that is directly related to the maximum temperature attained. Nonetheless, post-depositional
oxidation due to weathering can not only corrode or even destroy palynomorphs but can also lighten their colour (e.g. Traverse, 2008 and references therein). The characteristic of
palynomorphs to change colour with increasing temperature has enabled the development of powerful tools for identifying the thermal history of sedimentary basins (e.g., Batten, 1996; Marshall, 1991; Smith, 1983; Gray and Boucout, 1975). In order to evaluate the thermal maturity of sedimentary OM, several optical, physical and chemical maturity methods have been developed (Hartkopf-Fröder et al., 2015 and references therein). Thermal maturity is generally estimated using organic geochemistry (e.g. Rock-Eval pyrolysis; etc.) and optical methods (e.g. Thermal Alteration Index, Spore Colour Index, Acritarch Alteration Index, Palynomorph Darkness Index, Vitrinite and Chitinozoan Reflectances, etc.). Rock-Eval pyrolysis provides different information on the organic content, such as the petroleum potential of a rock, the nature of the kerogen and Tmax, which is defined as the pyrolysis
temperature at which the maximum amount of hydrocarbon is released by kerogen (Espitalié et al., 1986). As a general rule, Tmax increases linearly with increasing maturity of the OM.
Organic optical methods such as the Thermal Alteration Index (TAI; Staplin, 1969), Spore Color Index (SCI; Smith, 1983), Acritarch Alteration Index (AAI; Williams et al., 1998: Legall et al., 1981) are based on the sensitivity of palynomorph colour to evolve progressively in response to increasing temperature in the lower range of thermal maturity (Marshall,
1991). These approaches are based on the visual inspection of a selected class of palynomorphs to determine their alteration index that can then be correlated with other indicators such as vitrinite reflectance. The estimation of thermal maturity based on optical investigation of microfossils is also relatively inexpensive. Geochemical methods have the main advantage of being independent from the operator’s colour perception in contrast to the qualitative TAI, SCI and similar methods. That said, some organic
geochemical methods are less reliable in rocks with scarce OM and need specialized and relatively expensive analytical equipment. Recently, Goodhue and Clayton (2010) proposed a new
quantitative method to establish the thermal maturity of OM: the Palynomorph Darkness Index (PDI). This is a relatively simple method that utilizes a transmitted light microscope with digital imaging capacity and software capable of simple image analysis. In this study, we applied this method to samples from two subsurface sections in the Ghadamis Basin in southern Tunisia and western Libya of Silurian and Devonian age respectively. PDI values were calibrated against a variety of other thermal maturity indicators in order to evaluate the PDI as a method that can provide a rapid and inexpensive means of estimating thermal maturity and can be deployed during routine palynostratigraphic investigations in thermal history studies of sedimentary basins.
2. Geological setting
The studied subsurface material was obtained from two boreholes, one in southern Tunisia (Tt-1 borehole), and one in western Libya (D1-26 borehole). During Silurian-Devonian time, the study area occupied the depocentre of the Ghadamis Basin, covering an area of about 200,000 km2 (Fig. 1). This is now an intracratonic depression containing important hydrocarbon plays. To the north and east, the Ghadamis Basin is bounded by the Talemzane Arch (Dahar-Naffusah High) and the Qarqaf Uplift, respectively. The western margin of the basin is marked by the prominent Amguid-El Biod High, a highly faulted uplift trend. To the south, the Ghadamis Basin is separated from the neighbouring Illizi Basin by a series of highs of lower relief. All of these structural features have complex histories, originating during the late Precambrian Pan African orogeny and undergoing repeated reactivation during the Phanerozoic. The sedimentary succession of the Ghadamis Basin ranges in age from Palaeozoic to Cenozoic. It attains a maximum thickness of 3600 m and consists of alternating transgressive and regressive marine sandstone, shales, siltstones and locally
limestones, and is represented by the Mamuniyat, Tanezzuft, Acacus, Tadrart, Ouan Kasa, Awaynat Wanin, Tahara and Mrar formations (Acheche et al., 2001).
3. Lithostratigraphy
3.1 Tt-1 borehole
The studied stratigraphic interval from -1286.9m to -1240.5m, belongs to the “Argiles Principales” Formation, attributed to the Rhuddanian- Ludfordian time interval (Fig. 2; Vecoli et al., 2009; Jaeger et al., 1975). The basal part of the formation consists of sandstones and quartzites with interbedded shale layers passing to dark grey to black shales and marls, with rare limestone/dolostone
From bottom to top, graptolites of the vesiculosus and of the murchisoni and rigidus zones indicate a Rhuddanian and Sheinwoodian age, respectively. The lundgreni graptolite Zone of Homerian age, lies near -1273m to -1270.5m. The overlaying interval includes the vulgaris graptolite Zone of late Wenlock to ?lower Ludlow age (Jaeger et al., 1975). The uppermost interval (from −1247.9m), yielded miospores and chitinozoans of late Ludfordian age (Vecoli et al., 2009). The Silurian sequence ends at a major erosional surface, above which Lopingian deposits were documented (Jaeger et al., 1975).
3.2 D1-26 borehole
The D1-26 borehole penetrated the Acacus Fm. (Silurian) to Garian Fm. (Turonian). In the present study, core samples from the Devonian Awaynat Wanin Group were analysed (Fig. 2). In its Awaynat Wanin type area, this group is subdivided into four formations, the Awaynat Wanin I to IV (Ben Rahuma et al., 2008; Mergl & Massa, 2000). The same formations were also reported by Massa (1988) from subsurface data. Rocks with the highest hydrocarbon source rock potential are developed in the Awaymat Wanin III and IV formations, where this palynological study was yielded. The Awaynat Wanin III Fm. is characterized by an abundance of shales. The Awaynat Wanin IV Fm. is mainly characterized by calcilutites with shaly intercalations in the lower part. The upper part consists of shales with scattered sandstone intercalations. The sediments of the Awaynat Wanin Group were deposited in a shallow marine deltaic environment within the storm wave base, with prodelta silty clay/claystone beds passing upward into distributary channel sandstones. Fluvial intervals are minor but present (Vos, 1981).
Massa (1988) indicated that the radioactive shale is located at the transition between the Awaynat Wanin III and IV formations. Samples from core 7 are within the radioactive shales but samples from core 8 are outside this unit. The resistivity curve shows a marked increase from -2353m to ~-2362.2m (Fig. 2) corresponding to the organic-rich clays. From these observations, the boundary between the Awaynat Wanin III and IV formations is placed at -2353m.
The macrofauna and microfauna are impoverished due to restricted facies or even euxinic
conditions. Small bivalves, tentaculites, foraminifera and ostracods are recognized and the Awaynat Wanin IV Fm. was tentatively attributed to the Famennian (Massa, 1988).
4. Material and methods
Twenty-six samples (8 from Tt-1 borehole and 18 from D1-26 borehole) were processed for palynological and geochemical study, including PDI, and Rock-Eval analyses as follows:
Twenty grams of sediments from each sample were dissolved in HCl and HF to isolate the organic fraction. No oxidation was performed on the organic residue which was sieved at 10 μm in order to eliminate the finer fraction of the amorphous OM and facilitate optical microscopy. Three to nine palynological slides for each sample were studied in order to reach a 250 palynomorph count for each sample. The stratigraphical occurrence of miospore taxa in borehole D1-26 is shown in Table 1. Palynological slides are stored in the collection of the UMR 8198 Evo-Eco-Paleo, Université de Lille, Villeneuve d’Ascq (France).
Thermal Alteration Index (TAI) and Spore Colour Index (SCI):
Optical microscopy was used to establish the thermal maturity of the OM in this study. TAI
(Staplin, 1969) and SCI (Marshall and Yule, 1999; Hillier and Marshall, 1992; Collins, 1990; Fisher et al., 1980; Haseldonckx, 1979; Fig. 3) were assessed from the colour of smooth, unfolded and unornamented miospore specimens in unoxidised residues based on a visual comparison to Munsell colour standards as suggested by Pearson (1990) in Traverse (2008). TAI uses a five-point scale. Transparent to pale yellow colour indicates TAI 1, medium orange TAI 2, dark brown TAI 3, black TAI 4, and vitreous black with breakage indicates TAI 5 (Staplin, 1969). SCI ranges from 1 to 10 and reflects a colour gradation from colourless or pale yellow to black (Fig. 3). Approximately 50 miospores per sample were examined in order to estimate TAI and SCI.
Acritarch Alteration Index (AAI):
In the present study, AAI was established for leiospheres as suggested by Legall et al. (1981) and for acritarchs as indicated by Williams et al. (1998; Fig. 3). Legall et al. (1981) studied the change in leiosphere colour and proposed a 5-point scale, the Acritarch Colour Alteration Index (AAI), originally based on leiosphere and acritarch colour. Leiospheres and acritarchs change progressively in colour from light yellow and translucent, through pale yellow, yellow orange, orange, brown, to black. However, more recent studies reveal that leiospheres may follow a different colour maturity path to that of acritarchs (Hartkopf-Fröder et al. 2015; Williams et al., 1998) with leiosphere colour changing more rapidly at lower temperatures than that of acritarchs (Duggan and Clayton, 2008; Dorning, 1986), probably due to differences in wall chemistry. The scale of Legall et al. (1981) may therefore be more applicable to prasinophycean algae than to acritarchs. In the scale of Legall et al. (1981), translucent to light yellow (AAI = 1) and light yellow to pale yellow (AAI = 2) indicate the immature hydrocarbon zone (temperatures less than 70 °C). Pale yellow to orange leiospheres (AAI = 3) indicate the upper part of the oil and wet gas window, and orange to dark brown leiospheres (AAI = 4) indicate the peak of the oil and wet gas window. Black leiospheres (AAI = 5) are indicative of the lower oil and wet gas window and the upper part of the dry gas window. A
different, 4-point AAI scale for acritarchs colour change was proposed by Williams et al. (1998). Acritarchs considered in this study are thin, smooth-walled forms without an inner body. About 50 acritarchs and prasinophycean algae (i.e. Tasmanites) per sample were selected in order to estimate AAI.
Palynomorph Darkness Index (PDI):
PDI is determined from measurement of the red, green and blue (RGB) intensities of light transmitted through palynomorphs to produce a single greyscale value. In the present study,
palynomorphs were digitally imaged using a Leica DM1000 microscope, with a LeicaICC50® with 3.1 mpx resolution digital camera, and LAS EZ® image acquisition software. The palynomorph content of twenty-six samples (eight from Tt-1 borehole and eighteen from D1-26 borehole) was suitable for PDI analysis. Approximately thirty palynomorphs (10 miospores, 10 acritarchs, 10
Tasmanites) per sample were selected. Ten measurements of circa 16 µm2 areas were performed for
each palynomorph. Unornamented, unfolded, smooth and unalterated acritarchs, Tasmanites and miospores as Retusotriletes spp. and Ambitisporites sp. were chosen for PDI studies (Table 2). Images were collected at a constant illumination setting using 40× magnification. These images were analysed using ImageJ, an open source Java image processing program
(http://imagej.net/ImageJ) and the following procedure. The palynomorph interior was selected manually using the Lasso Selection Tool of ImageJ. The palynomorph image was acquired and processed to obtain a PDI value for each sample analysed (Plate 1), following the suggestions of Goodhue and Clayton (2010). PDI (i.e. PDImiospore, PDIacritarch, PDITasmanites) values obtained
from the Tt-1 and D1-26 boreholes, respectively, are shown in Table 2.
Rock-Eval Pyrolysis:
The two main aims of Rock-Eval pyrolysis analysis were to characterize the type and maturity of the OM present and to determine the petroleum potential of the rocks sampled.
The total organic carbon content (TOC in weight %) from Tt-1 core samples was determined on 100 mg of ground sediment sample with a Rock-Eval instrument, an Oil Show Analyser device (OSA or RE2, Espitalié et al., 1986) at the Université Paris 6, France. The D1-26 core samples were
analyzed on a Rock-Eval 6 instrument (RE6) at the Institut Français du Pétrole. Other parameters given by the Rock-Eval are the petroleum potential (S2 in mg HC/ g of rock), the hydrogen index
(HI in mg HC/g TOC) depending to the origin and state of preservation of the OM, and the Tm ax
(°C), an indicator of thermal maturity of the OM (Espitalié et al., 1986).
Detailed taxonomic evaluation of the various groups of palynomorphs is beyond the scope of the present paper. Here, only the major features of the assemblages and their chronostratigraphic significance are discussed in order to assess the age determination. The investigated sequence comprises the top of the Awaynat Wanin III Fm. and the overlying Awaynat Wanin IV Fm. From bottom to top, the palynological assemblage varies in terms of preservation, diversity and
palynomorph content (Plate 2, Table 1). Permanent tetrads such as Tetrahedraletes medinensis and dyads such as Dyadospora murusattenuata in assemblage with smooth trilete spores as well as
Ambitisporites sp. and Retusotriletes spp. occurred scarcely in the Awaynat Wanin III Fm.
(-2381.4m to -2375.9m). Near to the top of the Awaynat Wanin III Fm. (-2372.2m), trilete spores such as Cymbosporites senex, C. cyathus, Grandispora inculta and Verrucosisporites polygonalis occurred. Only a few specimens of Retusotriletes spp. were recognized from the lowest sample of the Awaynat IV Fm. The remaining basal part (-2348.1m to -2346.9m) was barren in terms of miospore content. The upper levels of the Awaynat Wanin IV Fm. (-2164.0m to -2158.3m) yielded a very well preserved and diversified microflora. The assemblage is characterized by an abundance of Retispora lepidophyta and less R. macroreticulata in assemblage with Knoxisporites literatus,
Verrucosisporites nitidus and other miospore taxa.
The microflora recorded shows close similarities with Mid-Late Devonian assemblages from
Gondwana and other palaeogeographic areas. Almost all the miospores from the top of the Awaynat Wanin III Fm. are Frasnian or older. Grandispora inculta has been recorded previously from the Givetian to Frasnian of Algeria (Moreau-Benoit et al., 1993; Boumendjel et al., 1988), Saudi Arabia and Tunisia (Breuer and Steemans, 2013) and Libya (Moreau-Benoit, 1989). Other forms such as C.
cyathus and G. lemurata have a worldwide distribution, extending through the Givetian and
Frasnian (Breuer and Steemans, 2013 with references). Loboziak and Streel (1989) attributed core sample -2440.0m, from near the base of the Awaynat Wanin III Fm. to the Frasnian. Accordingly, on the basis of the stratigraphic range of miospores recorded and the age attribution of the sample from -2440.0m, we assigned a Frasnian age to the Awaynat Wanin III Fm.
Spores such as R. lepidophyta, from the topmost Awaynat Wanin IV Fm., show a widespread and global distribution and are stratigraphically confined to the latest Devonian (late Famennian), as reported by numerous authors. In the palynological literature, R. lepidophyta is considered to be a late Famennian palynostratigraphic index species, making its latest occurrence in close proximity to the Devonian-Carboniferous boundary (Wicander and Playford, 2013 and references therein). The co-occurrence of V. nitidus further restricts the age of this assemblage to the LN
(lepidophyta-nitidus) biozone of Streel et al. (1987). Accordingly, the uppermost Awaynat Wanin IV Fm.
Acritarch assemblages are well-preserved, relatively abundant and well diversified in the analysed samples, indicating fully marine, shelf depositional conditions, throughout the study section. Biostratigraphically important species were recognized, such as Umbellasphaeridium deflandrei,
Unellium winslowiae, Polyedryxium pharaone, P. decorum, Stellinium octoaster, Maranhites cf. brasiliensis. Evittia spp., Duvernaysphaera spp. and Gorgonisphaeridium spp. were also recorded.
Overall, the above assemblage is consistent with a Late Devonian (Frasnian-Famennian) age, in agreement with the age indications from the miospore assemblage.
6. Thermal maturation of sedimentary organic matter
6.1 TAI and SCI
As shown in Fig. 4A, in Tt-1 borehole, TAI and SCI were established from five core-samples, all of which fall within the oil window with the exception of one sample (-1240.5m). A slight trend of decreasing TAI and SCI values upwards is observed. On the other hand, in D1-26 borehole, 4 of 15 core-samples fall within the oil window with the other 11 core-samples indicate an immature stage, though most of these fall close to the oil window (Fig. 4E). TAI and SCI values are more variable in D1-26 than in Tt-1, and no clear trend upwards is observed.
6.2 AAI
In the present study, the AAI of Williams et al. (1998; Fig. 4B, F) and Legall et al. (1981; Fig. 4C, G) were established for acritarchs and prasinophycaeans, respectively, from both the Tt-1 and D1-26 boreholes. Four samples from the Tt-1 borehole fall in the oil window on the basis of acritarch colour, the other samples showed AAI values less than 1.8, suggesting a position in the biogenic gas window (immature zone). A slight decreasing trend of AAI values upwards is noted (Fig. 4B). Different results were obtained in the same borehole from determinations of the AAI of Legall et al. (1981) on the basis of Tasmanites colour. In this case, all the samples fall within the oil window (Fig. 4C), without any trend upward. The AAI values of acritarchs from the D1-26 borehole indicate that only seven samples fall within the biogenic gas window and all the others lie within the oil window (Fig. 4F). Similar results were obtained from the AAI of Tasmanites (Fig. 4G). No clear trend of AAI values based on acritarchs and Tasmanites is observed.
6.3 PDI
In borehole Tt1, average PDI values for each group of palynomorphs show little variation: almost constant values are noted for Tasmanites and miospores, while a slight decreasing trend upward is
noted for acritarchs (Fig. 4D). Acritarchs systematically show lower PDI values than Tasmanites and miospores, reflecting their overall lighter colour. In borehole D1-26, PDI values show more variability (Fig. 4D) with no vertical trend in PDI observed. As in the Tt-1 samples, acritarchs generally show lower PDI values, though the difference to the other palynomorphs is smaller than in Tt-1. It can be observed that some samples (-2350.6m, -2377.4m, -2380.2m) systematically show lower PDI values for the three palynomorphs groups compared to the other samples (Fig. 4H).
6.4 Rock-Eval Pyrolysis
Rock-Eval pyrolysis results from borehole Tt-1 previously published by Vecoli et al. (2009) are summarized in Table 2 and Fig. 5A. These values indicate that generally the OM dominantly belongs to Type II, and is of marine origin. The average Tm ax value of 436°C indicates that, overall,
the OM is at the beginning of the oil window in the interval investigated. Pyrolysis results from borehole D1-26 are presented in Table 2 and Fig. 5B. Although they include the radioactive shales that are rich in OM of marine origin, the samples investigated are only moderately to poorly enriched in OM with a mean TOC of 1.6%. The samples studied are mostly characterized by Type III OM corresponding to altered OM of marine origin, and/or to terrestrial OM, although the other OM corresponds to Type II. The average Tm ax value of 437°C indicates that the OM has reached the
beginning of the oil window. Nevertheless, samples from the upper interval (cores 6 and 7) are slightly less mature than the samples from the lower interval (core 8).
6.5 PDI and SCI-AAI
A correlation between PDI and SCI-AAI values from both boreholes (Fig. 6) shows that:
- when PDI and the other colour indicator based on the same palynomorph are compared (Fig. 6A), they generally appear positively well correlated, with exception of PDITasm anites vs. AAITasm anites in
borehole Tt-1 (R2=0.17);
- when different thermal maturity indicators from different palynomorphs are considered (e.g. PDImiospore vs. PDIacritarch; PDImiospore vs. AAI; SCI vs. AAI; etc.), as a rule a positive correlation is
generally observed, but of poorer quality (Fig. 6A). This may be related to the fact that colour changes in the different palynomorphs (i.e. miospore, acritarch, Tasmanites) do not occur at the same maturity level. This has been previously described in the literature (e.g. Hartkopf-Fröder et al., 2015 and references therein) and can be related to the different chemical composition of the tissues of these different palynomorphs.
(Fig. 6B, C, D), their correlation is positive although the value of R2 is only around 0.6. This weak positive correlation might be related to the discrepancy observed between the two datasets from Tt-1- and DTt-1-26 boreholes, when the PDI-Tm ax data are plotted together (see the discussion below).
6.6. Rock-Eval Pyrolysis and PDI
PDI values were calibrated with Rock-Eval Pyrolysis data from Tt-1 and D1-26 boreholes (Fig. 7; Table 2). When all the data from borehole D1-26 are plotted, PDI shows a generally positive linear correlation with Tm ax, consistent with the increased value of PDI with maturity observed by
Goodhue and Clayton (2010). Nevertheless, a few data points fall out of the correlation (Fig. 7B). This is the case for the PDI data of miospores and Tasmanites in sample -2158.3m, which appear abnormally high compared to the Tm ax value. Because the number of data points from borehole Tt-1
is smaller, correlations of PDI data with Tm ax values are less solid than in borehole D1-26. However,
a positive correlation is observed between Tm ax and PDI data of miospores and Tasmanites. No clear
correlation between Tm ax and PDI values from acritarchs is observed (Fig. 7A). Several samples in
this borehole were very poor in acritarchs and large standard deviations on the data are observed, which might explain the absence of correlation.
The absence of a correlation between PDI and Tm ax values in some samples could result from a
bleaching or a darkening of palynomorphs, leading to lower or higher PDI values, respectively. The modification of palynomorphs colour can be related to oxidation within soils, in the case of
sporomorphs, during transport, or during periods of enhanced oxygenation of the sediment (Tyson, 1995). For this reason, these outlying samples were removed from further consideration, and only samples showing a strong linear PDI -Tm ax relationship were plotted in the other PDI vs. Rock-Eval
parameter diagrams (Hydrogen Index, S2 and Production Index; Fig. 7C-H).
In both boreholes, PDI is negatively and poorly correlated with PI (R2 < 0.05), although, in Tt-1, the negative correlation of PDImiospore is clear (R2 value ~0.67; Fig. 7G). The poor correlation between
PDI and PI values is surprising, since both parameters should increase with maturity. However, PI values also depend on petroleum migration: expulsion of petroleum from the rock leads to a decrease of the S1 and PI, while these parameters increase in the case of oil accumulation in a rock
(Espitalié et al., 1986). A negative or very low correlation between PDI and PI values can therefore be expected for rocks where petroleum migration has occurred as is likely to be the case in both studied boreholes.
In borehole Tt-1 and D1-26, for all three palynomorph groups the PDI is generally weakly correlated with HI (Fig. 7C, D). Correlation between PDI and S2 is also poor (Fig. 7E, F).
mostly due to one sample with a high S2 value (-2371.3m). Hydrogen index values decrease when
the maturity of the OM increases (Espitalié et al., 1986). For this reason, one might expect to observe a good negative correlation between HI and PDI values. Nevertheless, HI values also strongly depend on the origin of the organic matter and its degree of (bio)degradation (Espitalié et al., 1986). As previously discussed, the Rock-Eval parameters indicate that in both boreholes, the organic matter belongs to the types II and III (Fig. 5), indicating that the source and/or degree of degradation of the OM is variable. In addition, S2 and HI values also depend on oil migration,
which likely occurred in these boreholes. Bearing in mind that mature algo-bacterial (type II) OM can have a higher HI value than immature OM of terrestrial origin (type III), the variable origin of the OM in both boreholes Tt-1 and D1-26, added to possible oil migration, probably explains the poor correlations observed between PDI and HI.
As shown in Fig. 8 (A, C, E), for each category of palynomorphs, the correlation between PDI and
Tm ax values is different in the two studied cores. As a result, poor correlations between PDImiospore
and PDITasmanites values and Rock-Eval data are obtained when data from the two boreholes are combined (Fig. 8A, E). The discrepancy between these two datasets could be of geological origin and either related to different sedimentological context for the two studied intervals (Massa, 1988; Vecoli et al., 2009), or to different source organisms for the OM. The similar discrepancy observed between the two boreholes in the SCI or AAI vs. PDI data (Fig. 6) gives support to such
explanation. Nevertheless, we explored the possibility that it could be due to the different origins of Rock-Eval data. Indeed, these came from two different machines: RE2 for Tt-1 borehole and RE6 for D1-26 borehole. Behar et al. (2001) showed there was a small difference in S2 values and
consequently in Tm ax values generated by these different generations of Rock-Eval machines: RE6
gives slightly higher Tm ax values than RE2. We converted Tm axRE6 values from D1-26 to Tm axRE2
values following the equation Tm axRE2 = 0.895(Tm axRE6) + 41.870 proposed by Behar et al. (2001;
Table 2). After conversion of Tm ax values, while the PDI-Tm ax correlation for the total dataset is little
modified for acritarchs (Fig. 8D), this correlation improves for miospores and Tasmanites (Fig. 8B, F).
6.7 Rock-Eval Pyrolysis and SCI-AAI
SCI and AAI values were also compared with Rock-Eval Pyrolysis data by plotting the same samples considered for PDI calibration vs. Tm ax (Fig. 9).
In borehole Tt-1 both SCI and AAI (calculated on acritarchs) are not well correlated with Tm ax
showing R2~0.2 and 0.5, respectively (Fig. 9A, C) and AAI (calculated on Tasmanites) and Tm ax
number of data in this borehole. Better results were obtained from correlation of optical and Rock-Eval parameters in D1-26 borehole. Here, AAI (calculated on acritarchs) and Tm ax show a strong
positive correlation (R2~0.8; Fig. 9D), while positive correlations were obtained for SCI (Fig. 9B) and AAI (calculated on Tasmanites: Fig. 9F).
6.8 Vitrinite reflectance and PDI in D1-26 borehole.
Recently, Clayton et al. (2017) tentatively established the relationship between PDI determined on spores and Ro (i.e. vitrinite reflectance, the industry standard for determination of maturity) to be: PDI=65.01Ro+11.587. In D1-26 borehole, this relationship was used to calculate the vitrinite reflectance values from PDImiospore (Table 2). The vitrinite reflectance for the interval from -2164m
to -2158.3m calculated ranges from 0.47 to 0.65% with an average of 0.52%. This value supports the vitrinite reflectance measurements of 0.41 to 0.45% published by Underdown et al. (2007) from the considered depth interval. Encouraging results were also obtained for the other depth interval of D1-26 considered in this work, ranging from -2381.4m to -2346.9m where the vitrinite reflectance rangess from 0.51 to 0.59% and the vitrinite values calculated from PDImiospore are of 0.56%.
7. Conclusions
In the present study, we have analysed the organic matter content from two stratigraphic intervals of different ages: the first one belongs to the “Argiles Principales” in Tt-1 borehole, attributed to Wenlock-Ludlow time interval by Jaeger et al. (1975) and Vecoli et al. (2009); the second one is characterized by the Awaynat Wanin III and IV formations in borehole D1-26, attributed on the basis of palynomorphs content, to the Frasnian - latest Famennian.
Thermal maturity of the OM was estimated using Rock-Eval Pyrolysis and optical methods (TAI, SCI, AAI and PDI). Rock-Eval pyrolysis indicates that in both boreholes the OM is at the beginning of the oil window. The organic matter is mainly of marine origin (Type II) in Tt-1 borehole, while in borehole D1-26, some samples belong to Type III, indicating altered OM of marine origin, and/or terrestrial OM.
We are fully aware that, although our dataset is quite small and that the range of maturity of the samples studied here is not large, comparison of different thermal maturity indices revealed that the qualitative methods, TAI and SCI do not always yield reliable results. Conversely, our data confirm the validity of the quantitative PDI method as a thermal indicator. We here show that, in addition to sporomorphs, the PDI approach can be applied to marine palynomorphs (acritarchs and
Tasmanites). As for the other optical methods, PDI values in a sample vary according to the
palynomorph considered, so that only PDI values from the same type of palynomorph must be compared. Though more studies are needed before establishing a reliable calibration of PDI values against Rock-Eval, our data suggest that, like Tm ax, PDI could have a general applicability, as long
as it is applied only to the same type of palynomorph. The direct correlation of sporomorph PDI to vitrinite reflectance recently proposed by Clayton et al. (2017) is also validated here.
Acknowledgements
This study could not have been possible without the support of the late Dominique Massa, who provided core material and other precious information on Tt-1 and D1-26 boreholes, including petrophysical logs. Editor Shifeng Dai, Professor Jen O’Keefe and two anonymous reviewers are thanked for their constructive criticisms that highly improved the original version of this paper. This research did not receive any specific grant from funding agencies in the public, commercial, or not-for-profit sectors.
References
Acheche, M.H., Rabet, A.M., Ghariani, H., Ouahchi, A., Montgomery, S.L., 2001. Ghadames Basin, southern Tunisia: a reappraisal of Triassic reservoirs and future prospectivity. AAPG Bulletin 85, 765–780.
Batten, D.J., 1996. Palynofacies and petroleum potential. In: Jansonius, J., McGregor, D.C. (Eds.), Palynology: Principles and Applications 3. AASP Foundation, Dallas, 1065–1084. Behar, F., Beaumont, V., Penteado, H.D.B., 2001. Rock-Eval 6 technology:
performances and developments. Oil & Gas Science and Technology 56, 111-134.
Ben Rahuma, M., Proust, J.N., Eschard, R., 2008. The Stratigraphic Evolution of the Devonian Sequences, Awaynat Wanin area, Southern Ghadamis Basin: a Fieldguide Book. Libyan Petroleum Institute (LPI) Tripoli, Libya, 1-67. Boumendjel, K., Loboziak, S., Paris, F., Steemans, P., Streel, M., 1988. Biostratigraphie des miospore et des Chitinozoairis du Silurian Supérieur et du Dévonien dans le Bassin d’Illizi (SE du Sahara Algerien). Geobios 21, 329-357.
Boumendjel, K., Loboziak, S., Paris, F., Steemans, P., Streel, M., 1988.
Biostratigraphie des miospores et des chitinozoaires du Silurien supérieur et du Dévonien dans le Bassin d'Illizi (S.E. du Sahara algérien). Geobios 32, 329-357.
Breuer, P., Steemans, P., 2013. Devonian spore assemblages from northwestern Gondwana: taxonomy and biostratigraphy. Palaeontological Association 89, 1-163. Clayton, G., Goodhue, R., Abdelbagi, S. T., Vecoli, M., 2017. Correlation of
Palynomorph Darkness Index and vitrinite reflectance in a submature Carboniferous well section in northern Saudi Arabia. Revue de Micropaléontologie 60, 411-416.
Collins, A., 1990. The 1–10 Spore Colour Index (SCI) scale: a universally applicable colour maturation scale, based on graded, picked palynomorphs. Mededelingen - Rijks Geologische Dienst 45, 39–47.
Delcaillau, B., Deffontaines, B., Floissac, L., Angelier, J., Deramond, J., Souquet, P., Chu, H.T., Lee, J.F., 1998. Morphotectonic evidence from lateral propagation of an active frontal fold; Pakuashan anticline, foothills of Taiwan. Geomorphology 24, 263–290. Dorning, K.J., 1986. Organic microfossil geothermal alteration and interpretation of regional tectonic provinces. Journal of the Geological Society143, 219–220.
Duggan, C.M.B., Clayton, G., 2008. Colour change in the acritarch Veryhachium as an indicator of thermal maturity. GeoArabia 13, 125–136
Espitalié, J., Deroo, G., Marquis, F., 1986. La pyrolyse Rock-Eval et ses applications. Revue de l'Institut Français du Pétrole 41, 73–89.
Fisher, M.J., Barnard, P.C., Cooper, B.S., 1980. Organic maturation and hydrocarbon generation in the Mesozoic sediments of the Sverdrup Basin, Arctic Canada. Proceedings 4th International Palynological Conference 2, 581–588
Goodhue, R., Clayton, G., 2010. Palynomorph Darkness Index (PDI) – a new technique for assessing thermal maturity. Palynology 34, 147-156.
Gray, J., Boucot, A. J., 1975. Colour changes in pollen and spores: a review. Geological Society of America Bulletin, 86, 1019-1033.
Hartkopf-Fröder, C., Königshof, P., Littke, R., Schwarzbauer, J., 2015. Optical thermal maturity parameters and organic geochemical alteration at low grade diagenesis to anchimetamorphism: a review. International Journal of Coal Geology 150, 74-119.
Haseldonckx, P., 1979. Relation of palynomorph colour and sedimentary organic matter to thermal maturation and hydrocarbon generating potential. CCOP Technical Bulletin 6, 41-53.
Hillier, S., Marshall, J.E.A., 1992. Organic maturation, thermal history and hydrocarbon generation in the Orcadian Basin, Scotland. Journal of the Geological Society 149, 491–502
Jaeger, H., Bonnefous, J., Massa, D., 1975. Le Silurien enTunisie; ses relations avec le Silurien de Libye nord-occidentale. Bulletin de la Société Géologique de France 7, 68–76.
Jiang, D., Robbins, E.I., Wang, Y., Yang, H., 2016. Spore/Pollen Fossil Colouration and Petroleum Source Rock Quality. In: Jiang, D., Robbins, E.I., Wang, Y., Yang, H. (Eds.), Petrolipalynology. Springer Berlin Heidelberg, 123-127.
Legall, F.D., Barnes, C.R., Macqueen, R.W., 1981. Thermal maturation, burial history and hotspot development, Paleozoic strata of southern Ontario-Quebec, from conodont and acritarch colour alteration studies. Bulletin of Canadian Petroleum Geology 29, 492–539.
Loboziak, S., Streel, M., 1989. Middle-Upper Devonian miospores from the Ghadamis Basin (Tunisia-Libya): Systematics and stratigraphy. Review of Palaeobotany and Palynology, 58, 173-196.
Marshall, J.E.A., Yule, B.L., 1999. Spore colour measurement. In: Jones, T.P., Rowe, N.P. (Eds.), Fossil Plants and Spores: Modern Techniques. Geological Society, London, 165–168.
Marshall, J.E.A., 1991. Quantitative spore colour. Journal of the Geological Society, London 148, 223–233.
Massa, D., 1988. Paléozoïque de Libye Occidentale. Stratigraphie et Paléogéographie. Thèse Sc. Univ. Nice, 1-2, 514 pp., Nice.
Mergl, M., &Massa, D. (2000). A palaeontological review of the Devonian and Carboniferous succession of the Murzuq Basin and the Djado Sub-basin. Geological exploration in Murzuq Basin. Elsevier, Amsterdam, 41-88.
Moreau-Benoit, A., 1989. Les spores du Dévonien moyen et supérieur de Libye occidentale: compléments, systématique, répartition stratigraphique. Centre National de la Recherche Scientifique, Paris. Cahiers de Micropaléontologie 4, 5-32.
Moreau-Benoit, A., Coquel, R., Latreche, S., 1993. Palynological study of the Devonian in the Illizi Basin (East Algerian Sahara) biostratigraphical approach. Geobios 26, 3-31.
Oasis oils Company (1961) D1-26 final log.
Pearson, D.L., 1990. Pollen/spore colour “standard”. 2nd Printing of Version #2. Phillips Petroleum Company.
Pross, J., Pletsch, T., Shillington, D. J., Ligouis, B., Schellenberg, F., Kus, J., 2007. Thermal alteration of terrestrial palynomorphs in mid-Cretaceous organic-rich mudstones intruded by an igneous sill (Newfoundland Margin, ODP Hole 1276A). International Journal of Coal Geology, 70, 277-291.
Smith, P.M.R., 1983. Spectral correlation of spore coloration standards J. Brooks (Ed.), Petroleum Geochemistry and Exploration of Europe, Geological Society, London, 289-294 Staplin, F.L., 1969. Sedimentary organic matter, organic metamorphism and oil and gas occurrence. Bulletin of Canadian Petroleum Geology 17, 47-66.
Streel, M., Higgs, K., Loboziak, S., Riegel, W., Steemans, P., 1987. Spore stratigraphy and correlation with faunas and floras in the type marine Devonian of the Ardenne-Rhenish regions. Review of Palaeobotany and Palynology 50, 211-229.
Traverse, A., 2008. Paleopalynology. Second Edition Series: Topics in Geobiology, 28, 2nd ed. 2007. Corr. 2nd printing, 2008.
Tyson, R.V., 1995. Palynological kerogen classification. In Sedimentary Organic Matter. Springer Netherlands, 341-365.
Underdown, R., Redfern, J., 2007. The importance of constraining regional exhumation in basin modelling: a hydrocarbon maturation history of the Ghadames Basin, North Africa. Petroleum Geoscience 13, 253-270.
Vecoli, M., Samuelsson, J., 2001. Quantitative evaluation of microplankton
palaeobiogeography in the Ordovician–Early Silurian of the northern Trans European Suture Zone: implications for the timing of the Avalonia–Baltica collision. Review of Palaeobotany and Palynology 115, 43-68. Vecoli, M., Riboulleau, A., Versteegh, G., 2009. Palynology, organic geochemistry, and carbon isotope analysis of a latest Ordovician through Silurian clastic succession from borehole Tt-1, Ghadamis Basin, southern Tunisia, North Africa: palaeoenvironmental interpretation. Palaeogeography, Palaeoclimatology, Palaeoecology 273, 378-394.
Vos, R.G., 1981. Sedimentology of an Ordovician fan delta complex, western Libya. Sedimentary Geology 29, 153-170.
Wicander, R., Playford, G., 2013. Marine and terrestrial palynofloras from transitional Devonian– Mississippian strata, Illinois Basin, USA. Boletino Geológico y Minero 124, 589-637.
Williams, S.H., Burden, E.T., Mukhopadhyay, P.K., 1998. Thermal maturity and burial history of Paleozoic rocks in western Newfoundland. Canadian Journal of Earth Science 35, 1307–1322. Yule, B.L., Roberts, S., Marshall, J.E.A., 2000. The thermal evolution of sporopollenin. Organic Geochemistry 31, 859–870.
Figure captions:
Fig. 1: Location map of the boreholes studied in the Ghadamis Basin (from Underdown et al., 2007 with reference).
Fig. 2: Stratigraphic log and sonic and resistivity curve (the scale is unknown) of investigated tract of borehole D1-26 (modified from Oasis Oils Company, 1961). Black rectangles with numbers correspond to cored sections. Stratigraphic log of investigated tract of borehole Tt-1 (for more detailed information on the lithostratigraphy please refer to Vecoli et al., 2009).
Fig. 3: Phases of oil and gas generation and correlation between optical thermal maturity parameters (from Hartkopf-Fröder et al., 2015 and references therein).
Fig. 4: Organic matter alteration index from Tt-1 and D1-26 boreholes. Tt-1 borehole: A: Thermal Alteration Index (TAI) and Spore Colour Index of miospores; B: Acritarch Alteration Index (AAI) of acritarchs; C: Acritarch Alteration Index (AAI) of Tasmanites; D: PDI of miospores, acritarchs and Tasmanites. D1-26 borehole: E: Thermal Alteration Index (TAI) and Spore Colour Index of miospores; F: Acritarch Alteration Index (AAI) of acritarchs; G: Acritarch Alteration Index (AAI) of Tasmanites; H: PDI of miospores, acritarchs and Tasmanites.
Fig. 5: Diagram of Espitalié et al (1986) showing the relationship between HI and Tm ax in the
borehole Tt-1 (A) and in the borehole D1-26 (B).
Fig. 6: Correlation of PDI and SCI-AAI values from Tt-1 and D1-26 boreholes. R2 value in the yellow cell indicates a negative correlation between the values of thermal maturity parameters. Fig. 7: Correlation of PDI and Rock-Eval Pyrolysis data (e.g. Tm ax, S1, HI and PI) in Tt-1 and D1-26
boreholes. PDImiospore: orange dots and line; PDIacritarch: blue dots and line; PDITasmanites: green dots and line.
Fig. 8: PDI-Tm ax correlation for the total dataset. A: Tm ax values from two different machines: RE2
for Tt-1 borehole and RE6 for D1-26 borehole. B: Tm axRE6 values from D1-26 borehole converted in
Tm axRE2 applying the formula of Behar et al. (2001).
Fig. 9: Correlation of SCI-AAI and Tm ax values in Tt-1 and D1-26 boreholes. PDImiospore: orange
dots and line; PDIacritarch: blue dots and line; PDITasmanites: green dots and line.
Plate 1: Representative palynomorphs selected for PDI analysis (scale bar indicates 10 µm) before and after the conversion in grey scale, see Goodhue and Clayton, 2010; p. 148.
3, 4: Acritarch (borehole D1-26, slide 2158.3 (3)) 5,6: Tasmanites sp. (borehole D1-26, slide 2158.3 (3))
Plate 2: Miospore and acritarchs from D1-26 borehole (scale bar indicates 10 µm) 1. Geminospora lemurata Balme emend. Playford 1983 (slide 2158.3(1))
2. Retispora lepidophyta (Kedo) Playford 1976 (slide 2158.8(2)) 3. Verrucosisporites nitidus Playford 1964 (slide 2159.5(1))
4. Grandispora incognita (Kedo) McGregor and Camfield, 1976 (slide 2372.2(2)) 5. Retispora macroreticulata (Kedo) Byvscheva 1985 (slide 2158.8(3))
6. Verrucosisporites premnus Richardson 1965 (slide 2158.3(3))
7. Verrucosisporites scurrus (Naumova) McGregor and Camfield 1976 (slide 2372.2(3)) 8. Knoxisporites literatus (Waltz) Playford 1963 (slide 2158.8(1))
9. Archaeozonotriletes variabilis (Naumova) Allen 1965 (slide 2158.8(1)) 10. Unellium winslowiae Rauscher 1969 (slide 2350.6(2))
11. Umbellasphaeridium deflandrei (Moreau-Benoit) Jardiné, Combaz, Magloire, Peniguel and Vachey, 1972 (slide 2350.6(2))
12. Polyedryxium pharaone Deunff 1961 (slide 2371.3(1)) 13. Polyedryxium decorum Deunff 1955 (slide 2350.6(2))
14. Stellinium octoaster Jardiné, Combaz, Magloire, Peniguel and Vachey, 1972 (slide 2371.3(1)) 15. Maranhites cf. brasiliensis Brito 1965 (slide 2350.6(2))
Table 1: Miospore occurrences in D1-26 borehole.
Awaynat Wanin III Fm. Awaynat Wanin IV Fm. Lithostratigraphy
2 3 8 1 .4 2 3 8 1 .1 2 3 8 0 .7 2 3 8 0 .5 2 3 8 0 .2 2 3 7 8 .0 2 3 7 7 .4 2 3 7 5 .9 2 3 7 2 .2 2 3 7 1 .3 2 3 5 0 .6 2 3 4 8 .1 2 3 4 6 .9 2 1 6 4 .0 2 1 6 0 .1 2 1 5 9 .5 2 1 5 8 .8 2 1 5 8 .3 sa mp le n o m io s p o re Tetrahedraletes medinensis Dyadospora murusattenuata Retusotriletes spp. Amb itisporites sp. Archaeozonotriletes variabilis Cymb osporites cyathus Cymb osporites senex Cymb osporites sp. Geminospora lemurata Grandispora incognita Grandispora inculta Grandispora rarispinosa Verrucosisporites polygonalis Verrucosisporites premnus Verrucosisporites scurrus Verrucosisporites spp. Knoxisporites literatus Knoxisporites sp. Retispora lepidophyta Retispora macroreticulata Verrucosisporites nitidus
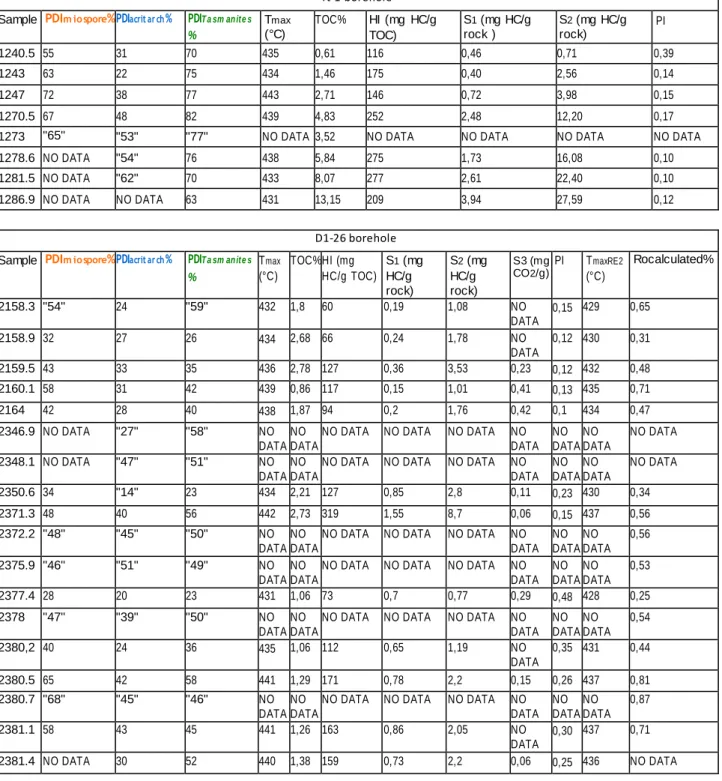
Table 2: Tt-1 borehole: PDI values, TOC and Rock Eval Pyrolysis parameters.
D1-26 borehole: PDI values, TOC and Rock Eval Pyrolysis parameters; Tm axRE2 values obtained
converting Tm axRE6 values applying the formula of Behar et al. (2001). Rocalculated%: vitrinite
reflectance values obtained from PDImiospore applying the formula of Clayton et al. (2017). PDI
values in quotes were not considered for PDI calibration vs. Tm ax, the other Rock-Eval Pyrolysis
parameters (e.g. S1, HI and PI) and for PDI calibration vs. SCI and AAI values.
Tt-1 borehole Sample PDIm iospore%PDIacrit ar ch% PDIT a sm an ite s
% Tmax (°C) TOC% HI (mg HC/g TOC) S1 (mg HC/g rock ) S2 (mg HC/g rock) PI 1240.5 55 31 70 435 0,61 116 0,46 0,71 0,39 1243 63 22 75 434 1,46 175 0,40 2,56 0,14 1247 72 38 77 443 2,71 146 0,72 3,98 0,15 1270.5 67 48 82 439 4,83 252 2,48 12,20 0,17
1273 "65" "53" "77" NO DATA 3,52 NO DATA NO DATA NO DATA NO DATA
1278.6 NO DATA "54" 76 438 5,84 275 1,73 16,08 0,10
1281.5 NO DATA "62" 70 433 8,07 277 2,61 22,40 0,10
1286.9 NO DATA NO DATA 63 431 13,15 209 3,94 27,59 0,12
D1-26 borehole Sample PDIm iospore%PDIacrit ar ch% PDIT a sm an ite s
% Tmax (°C) TOC% HI (mg HC/g TOC) S1 (mg HC/g rock) S2 (mg HC/g rock) S3 (mg CO2/g) PI TmaxRE2 (°C) Rocalculated% 2158.3 "54" 24 "59" 432 1,8 60 0,19 1,08 NO DATA 0,15 429 0,65 2158.9 32 27 26 434 2,68 66 0,24 1,78 NO DATA 0,12 430 0,31 2159.5 43 33 35 436 2,78 127 0,36 3,53 0,23 0,12 432 0,48 2160.1 58 31 42 439 0,86 117 0,15 1,01 0,41 0,13 435 0,71 2164 42 28 40 438 1,87 94 0,2 1,76 0,42 0,1 434 0,47 2346.9 NO DATA "27" "58" NO DATA NO DATA
NO DATA NO DATA NO DATA NO DATA NO DATA NO DATA NO DATA 2348.1 NO DATA "47" "51" NO DATA NO DATA
NO DATA NO DATA NO DATA NO DATA NO DATA NO DATA NO DATA 2350.6 34 "14" 23 434 2,21 127 0,85 2,8 0,11 0,23 430 0,34 2371.3 48 40 56 442 2,73 319 1,55 8,7 0,06 0,15 437 0,56 2372.2 "48" "45" "50" NO DATA NO DATA
NO DATA NO DATA NO DATA NO DATA NO DATA NO DATA 0,56 2375.9 "46" "51" "49" NO DATA NO DATA
NO DATA NO DATA NO DATA NO DATA NO DATA NO DATA 0,53 2377.4 28 20 23 431 1,06 73 0,7 0,77 0,29 0,48 428 0,25 2378 "47" "39" "50" NO DATA NO DATA
NO DATA NO DATA NO DATA NO DATA NO DATA NO DATA 0,54 2380,2 40 24 36 435 1,06 112 0,65 1,19 NO DATA 0,35 431 0,44 2380.5 65 42 58 441 1,29 171 0,78 2,2 0,15 0,26 437 0,81 2380.7 "68" "45" "46" NO DATA NO DATA
NO DATA NO DATA NO DATA NO DATA NO DATA NO DATA 0,87 2381.1 58 43 45 441 1,26 163 0,86 2,05 NO DATA 0,30 437 0,71 2381.4 NO DATA 30 52 440 1,38 159 0,73 2,2 0,06 0,25 436 NO DATA