HAL Id: hal-00298374
https://hal.archives-ouvertes.fr/hal-00298374
Submitted on 16 May 2006HAL is a multi-disciplinary open access
archive for the deposit and dissemination of sci-entific research documents, whether they are pub-lished or not. The documents may come from teaching and research institutions in France or abroad, or from public or private research centers.
L’archive ouverte pluridisciplinaire HAL, est destinée au dépôt et à la diffusion de documents scientifiques de niveau recherche, publiés ou non, émanant des établissements d’enseignement et de recherche français ou étrangers, des laboratoires publics ou privés.
M3A system (2000?2005) ? operation and maintenance
G. Petihakis, P. Drakopoulos, C. Nittis, V. Zervakis, C. Christodoulou, C.
Tziavos
To cite this version:
G. Petihakis, P. Drakopoulos, C. Nittis, V. Zervakis, C. Christodoulou, et al.. M3A system (2000?2005) ? operation and maintenance. Ocean Science Discussions, European Geosciences Union, 2006, 3 (3), pp.165-198. �hal-00298374�
OSD
3, 165–198, 2006 M3A system G. Petihakis et al. Title Page Abstract Introduction Conclusions References Tables Figures J I J I Back CloseFull Screen / Esc
Printer-friendly Version
Interactive Discussion
EGU
Ocean Sci. Discuss., 3, 165–198, 2006 www.ocean-sci-discuss.net/3/165/2006/ © Author(s) 2006. This work is licensed under a Creative Commons License.
Ocean Science Discussions
Papers published in Ocean Science Discussions are under open-access review for the journal Ocean Science
M3A system (2000–2005) – operation and
maintenance
G. Petihakis1, P. Drakopoulos2, C. Nittis1, V. Zervakis3, C. Christodoulou1, and C. Tziavos1
1
Institute of Oceanography, Hellenic Center for Marine Research, P.O. BOX 2214, 71003 Iraklion, Crete, Greece
2
Optical Instruments Laboratory, Department of Optics, Technological Institute of Athens, Greece
3
Department of Marine Science, University of the Aegean, Mytilene, Greece Received: 5 April 2006 – Accepted: 27 April 2006 – Published: 16 May 2006 Correspondence to: G. Petihakis ([email protected])
OSD
3, 165–198, 2006 M3A system G. Petihakis et al. Title Page Abstract Introduction Conclusions References Tables Figures J I J I Back CloseFull Screen / Esc
Printer-friendly Version
Interactive Discussion
EGU
Abstract
During the Pilot Phase of the Mediterranean Forecasting System (MFSPP) (1998– 2001) a prototype observing system (Mediterranean Moored Multi-sensor Array – M3A) was designed, developed and operated in the Cretan Sea for continuous oceano-graphic measurements in real time. The main problems encountered were associated
5
with biofouling, underwater and aerial communication and with the design of the sur-face buoy. In the second phase of the MFS project named Mediterranean Forecasting System Towards Environmental Predictions (MFSTEP) (2001–2005), the aim was to solve those problems and to consolidate the M3A. During the approximately five years of operation there were 13 scheduled and 15 emergency visits with a total duration of
10
65 days. The acquired experience through the maintenance program proved that the continuous observation of a so important system with a relative low cost is feasible.
1 Introduction
Oceans are very dynamic systems with active processes that include physics, chem-istry and biology. The state of knowledge concerning our planet’s oceans is built
pri-15
marily upon the foundation of spatial exploration (Colwell, 2003). However if these processes are to be understood, if new insights are to be gained, if quantitative models are to be validated satisfactorily, then observations are needed over the time scales appropriate to the dynamics of these processes (Colwell, 2003). Although the classi-cal expeditions of short cruises focused on particular issues will continue in the future,
20
the rapid technological development and the need to explore ocean processes in time, will revolutionize how ocean science will be conducted in the new millennium (Isern and Clark, 2003). This approach is not as some people think monitoring but instead is an active exploration of system dynamics in the time component. In the framework of EuroGOOS, a multi national effort to develop an integrated operational monitoring
25
OSD
3, 165–198, 2006 M3A system G. Petihakis et al. Title Page Abstract Introduction Conclusions References Tables Figures J I J I Back CloseFull Screen / Esc
Printer-friendly Version
Interactive Discussion
EGU
Forecasting System (MFS) project (Pinardi and Flemming, 1998). During the Pilot Phase of the Project (1998–2001), a significant element of the designed observing systems was the Mediterranean Moored Multi-sensor Array (M3A), a prototype obser-vatory that was designed to form the base of a permanent network of moored stations for continuous recording of open-ocean conditions in the Mediterranean Sea (Nittis et
5
al., 2003). This first phase was devoted to the design, integration, deployment and pre-operational testing of the M3A station, the main features of which were i) moored in deep ocean (over 1000 m), ii) measuring capability of physical parameters down to 500 m, biogeochemical parameters down to 100m and air-sea interaction parameters at surface, iii) raw data transmission in real time and iv) low maintenance cost due to
10
large autonomy and easy handling of the system. In this way, the system would be able to monitor the upper thermocline variability of the general circulation and biochemical processes in the euphotic zone, producing important oceanographic and atmospheric data for calibration/validation of ecological models as well as for the development of data assimilation techniques (Petihakis et al., 2002; Triantafyllou et al., 2003b). For the
15
location of the buoy a site at the Cretan Sea was chosen, since although close to the coast (24 nm north of Heraklion) it is an area of open sea conditions, characterised as extremely oligotrophic where dense waters with intermediate and deep characteristics are formed (Balopoulos et al., 1999; Theocharis et al., 1999).
In the second phase of the MFS project named Mediterranean Forecasting System
20
Towards Environmental Predictions (MFSTEP) (2001–2005), the aim was to consoli-date the M3A and in particular i) to improve the functionality of the system and upgrade its capabilities (new underwater and satellite communications, new bio-optical mea-surements, new surface buoy) and ii) to expand the network with two more buoys, one in the Eastern and one in the Western Mediterranean Sea. The three stations together
25
were designed to be the data producers for the validation of the basin scale current forecasts, serving as subsurface extrapolation data set for surface satellite colour data and for assimilation into the ecosystem models.
OSD
3, 165–198, 2006 M3A system G. Petihakis et al. Title Page Abstract Introduction Conclusions References Tables Figures J I J I Back CloseFull Screen / Esc
Printer-friendly Version
Interactive Discussion
EGU
the quality of M3A data during the first phase (Drakopoulos et al., 2004), it was decided that anti-fouling techniques should be tested at the beginning of the second phase and the most appropriate should be used in all three systems. Thus a test program was car-ried out in the Saronikos gulf for a 3 month period where selected instruments from line 2 were moored on a stand-alone mooring closed to a fish farm. Finally all components
5
of the upgraded M3A system were tested in an experimental tank while special atten-tion was given to the newly integrated components, the data flow between the various sub-systems and the calibration of the sensors though a series of lab experiments.
2 M3A design and configuration
The station was deployed in the Cretan Sea (Fig. 1) in January 2000 with coordinates
10
35,39,627 N and 24,59,080 E at a depth of 1030 m with R/V Aegaeo. A detailed analy-sis of the system configuration during the pilot project has been presented by Nittis et al. (2003) and is briefly described here. Synoptically the measured parameters were: water temperature and salinity at −1, −30, −50, −75, −100, −150, −250, −350, and −500 m, wave height and direction, current speed and direction of water current in
15
the 0–500 m water column, dissolved oxygen, chlorophyll, turbidity and photosynthetic active radiation (PAR) at −1, −30, −50, −75, −100 m, nitrate concentration at 45 m, air temperature, wind speed and direction, atmospheric pressure and relative humid-ity. As mentioned above one of the central aims was the development of a low cost system achieved mainly through the minimization of maintenance effort. Thus a triple
20
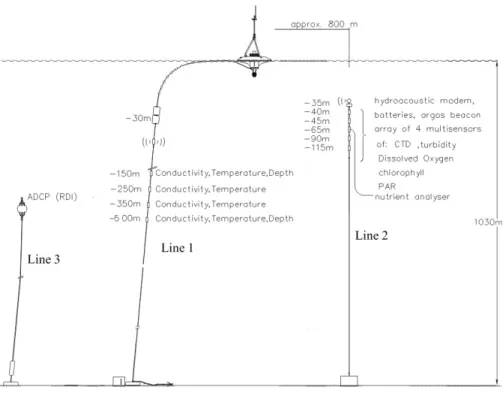
configuration was chosen (Fig. 2) with each line having different servicing demands. The central line was hosting the surface buoy and the deep layer physical parame-ters – SeaCat sensors (−150, −250, −350, −500) for temperature, conductivity and pressure, attached on to a 600 m inductive-modem cable. Additionally a hydroacoustic modem was also attached in the inductive-modem cable in order to receive data from
25
line 2 which then would be transferred to the surface buoy. At surface, temperature, conductivity, turbidity, dissolved oxygen and chlorophyll-a sensors attached under the
OSD
3, 165–198, 2006 M3A system G. Petihakis et al. Title Page Abstract Introduction Conclusions References Tables Figures J I J I Back CloseFull Screen / Esc
Printer-friendly Version
Interactive Discussion
EGU
buoy were measuring the state of the surface water, while there were meteorological and wave sensors (wind speed and direction, air temperature, atmospheric pressure, humidity, wave height and direction), and of course the data storage and transmission system. Line 2 was deployed approximately 0.7 nm to the south of line 1, designed to remain submerged, hosting four CTD instruments at 40, 65, 90 and 115 m, and a
5
nitrate analyser at 45 m depth. Each CTD unit had temperature, conductivity, pressure, dissolved oxygen, transmissometer, chlorophyll-a, and PAR sensors. The CTD’s were connected with inductive cables, transferring data to a computer (Nireus) responsible for the transmition to line 1 (through an acoustic modem), located at the top of the line. The third line was hosting the upward looking ADCP instrument measuring the
cur-10
rent profile of the 0–500 m water layer. As there was no real-time data transfer to the surface buoy due to the large volume of data the ADCP was anchored about 1 nm away from line 1.
To confront the M3A system problems that became emergent during the first phase, a number of modifications – upgrades were performed prior to redeployment at the
15
second phase.
The buoy used in the pilot phase was an available one (Thanos and Pezirtzoglou, 1997), primarily designed as a wave directional data buoy of wave rider type. Although the inside electronics were improved in order to fulfil the project demands, hulls’ hydro-dynamic performance, was optimised to behave as a wave follower. The deep waters
20
oceanographic buoys, such as M3A, may operate as robust and reduced movement devices, not necessarily having attached directional waves sensing device. Omitting this kind of measurements, the robustness was improved the maintenance intervals were increased, and hull’s movements were minimized by appropriate floatation shape design. The new buoy was constructed to withstand wave heights up to 12 m with a
25
significant flexibility in the design and with a modular construction (easily exchangeable parts, i.e. electronics, floaters, mast, underwater units and selectable dimensions). A new compass on board of the buoy was installed in order to reduce the power con-sumption, and the wind generator was replaced with a significantly lighter one with a
OSD
3, 165–198, 2006 M3A system G. Petihakis et al. Title Page Abstract Introduction Conclusions References Tables Figures J I J I Back CloseFull Screen / Esc
Printer-friendly Version
Interactive Discussion
EGU
better energy conversion coefficient. Several cable harnesses inside the instrumen-tation container were redesigned, in order to fulfil the worldwide standards while the meteorological package was enriched with new sensors (solar radiation, rainfall).
Additionally new underwater and satellite communication systems were implemented i.e. satellite transceiver, mobile phones, under-water acoustic bi-directional modems,
5
IMC modems while the underwater hardwired network was embedded into the buoy container and attached on the mooring line. To overcome the problem of communica-tion between the two lines during summer (thermocline development), higher rates (up to 4800 Bits/sec.) were developed.
An important new capability of the system was the bi-directional data transfer and
10
remote reprogramming of various devices. This is a two stage and a two way signal transferring, one from the operational centre to the buoy PC via satellite and mobile phone, and a second from buoy to the underwater mooring lines. Finally the beneath the hull attached instrumentation was replaced with a much simpler and functional new package.
15
As line 2 during the first phase proved to be quite efficient it was decided that it should remain practically as originally developed with only exception the necessary improvements in order to minimise biofouling effects. The optical sensors attached on the four SBE-16s on line 2, were:
1. PAR sensors (model 193SA manufactured by LI-COR).
20
2. Fluorometers (WETSTAR by Wetlabs)
3. Transmissometers (C-star by Wetlabs) at 660 nm with a 25 cm path length. From the very first deployment it became evident that fluorometers and transmis-someters factory calibration was not correct as biological production in the Cretan Sea is significantly lower compared to most other areas where marine observatories are
25
operating. Thus laboratory experiments were designed and bibliographic information was used in order to perform site-specific calibrations for those optical sensors and to estimate the range of values to be used prior to deployment.
OSD
3, 165–198, 2006 M3A system G. Petihakis et al. Title Page Abstract Introduction Conclusions References Tables Figures J I J I Back CloseFull Screen / Esc
Printer-friendly Version
Interactive Discussion
EGU
Additionally in the developed configuration, the PAR sensors were open (to the sur-rounding water column) while the fluorometers and transmissometers were closed by means of tubing and pump. All the above instruments are prone to biofouling. Based on the experience of the previous deployments during the MFS Pilot Project, biofouling posed a problem for the bio-optical measurements (Drakopoulos et al., 2003), despite
5
the oligotrophy of the Cretan Sea (Tselepides and Polychronaki, 1996). Thus, it was decided that some antifouling technique would have to be applied, in order to improve the quality of the bio-optical measurements during the MFSTEP project. In order to select the most proper technique, a pilot study described below was conducted.
3 Pre-top period (pre-deployment procedures) 10
3.1 Testing anti-fouling techniques
Most of anti-biofouling techniques depend on maintaining a toxic environment to the marine organisms close to the sensors’ location. This usually is achieved either with the presence of copper near the sensors (by means of copper shutter or tubing) or bromine solution. Despite the fact that incorporation of copper-shutters is a very promising
15
technology, it could not be used in this case, as the already existing instrumentation did not had a provision for the mounting of such device. Thus, the uses of bromine solution and copper tubing were selected for testing and comparison.
For the open instruments (PAR sensors) two configurations were deployed. One with a copper disk attached bellow the sensor’s diffusing bulb and a standard one
20
without any particular action to prevent biofouling. For the rest of the sensors four, different configurations were deployed, one with no protection, one with copper tubing, one with bromine and a final one with a combination of both. The copper configura-tion simply included the replacement of most plastic tubing adjacent to the fluorometer and transmissometer (both upstream and downstream) with copper tubing (∅10 mm)
25
OSD
3, 165–198, 2006 M3A system G. Petihakis et al. Title Page Abstract Introduction Conclusions References Tables Figures J I J I Back CloseFull Screen / Esc
Printer-friendly Version
Interactive Discussion
EGU
tablets, attached between the fluorometer and the transmissometer, in order to slowly and constantly release bromine solution through diffusion towards both sensors. Er-roneous readings were avoided in all sensors by means of flushing for 15 s prior to measurement.
In order to evaluate the above different approaches, an experiment was carried out
5
close to a fish-farm situated off the islet of Patroklos in Saronikos Gulf, Greece. This site was chosen for its relatively eutrophic environment due to intensive fishfarming activities, minimizing thus the duration of the experiment. The experimental site was approximately 50 m eastwards from the fish cages directly influenced by the farm as indicated by the increased deposition of organic material on the benthic system. A total
10
of two antifouling-test deployments were made.
The four different CTD setups, were deployed at the same depth (10 m) in neighbor-ing moorneighbor-ings at a total water depth of 18 m and set to sample hourly. The choice of deploying four moorings instead of one was taken in order to maintain the CTD plat-forms at the same depth (identical conditions of light/nutrients and chlorophyll) and
15
thus obtain comparable measurements. To aid the interpretation of the results, a cur-rent meter was included in one of the moorings and a weather station was set at the aquaculture facility. The first deployment started on 20 May 2003, and lasted until 8 July 2003 when it was retrieved due to the strong algal build-up as observed by in-situ scuba.
20
Analysis of the collected data showed that the open sensors (PARs) behaved in a similar manner regardless the anticipated toxic environment at the moorings with bromine and copper. Intercomparison of PAR and incoming solar radiation time series after the removal of the daily cycle by means of filtering, showed a decrease of sensi-tivity in the order of 40% in 50 days with an accelerating trend towards the end of the
25
deployment period (Fig. 3).
The fluorometers recorded no obvious increase in chlorophyll concentration despite the external build up of organisms with only exception the one with no protection which showed an increasing trend towards the end of the deployment. It should be noted here
OSD
3, 165–198, 2006 M3A system G. Petihakis et al. Title Page Abstract Introduction Conclusions References Tables Figures J I J I Back CloseFull Screen / Esc
Printer-friendly Version
Interactive Discussion
EGU
that the chlorophyll concentration as measured from bottle samples in the lab, ranged from 0.06 to 0.09 µg/lt.
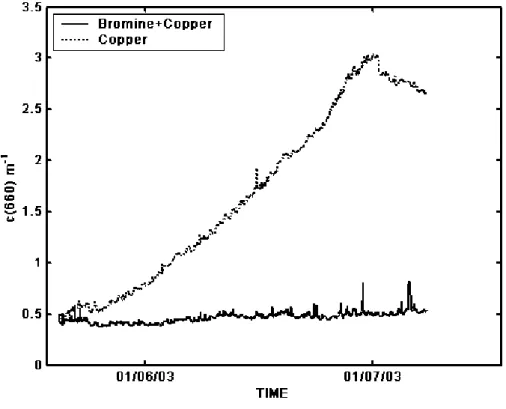
The interpretation of the transmissometer’s readings was more straightforward. An exponential increase was evident in all configurations that had no bromine canister, indicative of optical window contamination. An interesting result was that the one with
5
the least bio-fouling was the setup, which incorporated both copper tubing and bromine solution (Fig. 4). This was in contrast to the results reported elsewhere (Manov et al., 2003; Seim et al., 2000).
Upon the retrieval of the moorings, a post-calibration was performed to assess the effects of the biofouling to the sensors, and assess any potential drift.
10
Considering the low content of chl-a experienced during the first deployment a sec-ond trial took place in the same area in Spring 2004, aiming to record the spring bloom. The two CTD platforms were deployed in separate moorings at an approximate depth of 7 m, at a water column depth of about 20 m. The deployment took place on 24 March and the recovery on 22 May 2004. The platform S1 was equipped only with copper
15
tubing, while the platform S2 employed both copper tubing and bromide solution. On producing the engineering units of chl-a fluorescence, the calibration coefficients produced during the 19 May 2003 laboratory calibration experiment, were used. As the calibration coefficients for the 2930 sensor (S4) gave unaccepted values, it was decided to use those for the 2928 (S2) sensor (see Sect. 3.2).
20
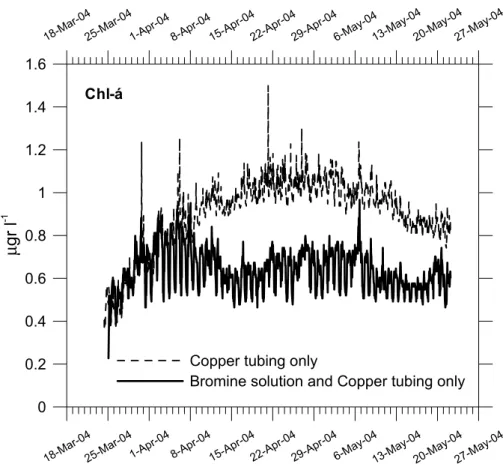
The fluorometers produced almost identical time-series for about 10 days, which is the time when the S4 fluorometer measurements started diverging in relation to S1 measurements (Fig. 5). This in effect suggests that the calibration procedure was rather successful. After 3 April the chl-a fluorescence recorded by S4 was systemat-ically lower than S1 showing no trend at all, while the S1 reached a maximum value
25
of 1.2 microgr l−1 before a slow, gradual decrease to lower values. Overall there was no clear sign of a strong Spring bloom which we were hoping to record. The negative trend of the S1 fluorometer measurements during the second half of the deployment period suggests that the measurements were not infested by biofouling.
OSD
3, 165–198, 2006 M3A system G. Petihakis et al. Title Page Abstract Introduction Conclusions References Tables Figures J I J I Back CloseFull Screen / Esc
Printer-friendly Version
Interactive Discussion
EGU
3.2 Laboratory sensor calibration
As mentioned above the area of deployment is characterized by its extreme olig-otrophism, and as the range of values was expected to be significantly lower in the Cretan Sea compared to a regular coastal sea, or even open ocean, the factory cali-bration of the fluorometers was considered inappropriate. Thus, in an attempt to
per-5
form site-specific calibrations for this very oligotrophic environment of the Cretan Sea, laboratory experiments were designed and bibliographic information was used in order to estimate the range of values to be used.
The fluorometers were calibrated, both before the pilot study deployment and after the pilot study deployment. This calibration was based on five samples of local
phy-10
toplankton populations which were nutrient-enriched and cultured for about 10 days to attain discrete chl-a concentration values. After a 15 min sampling by the fluores-cence sensors, a reference value was estimated by extracting phytoplankton by means of filtering and measuring its chl-α fluorescence with a TURNER AU-10 laboratory fluorometer. The fluorescence values were converted to phytoplankton concentration
15
following Yentsch and Menzel (1963).
The fluorometer calibration that was performed the day before the Patroklos deploy-ment is presented in Fig. 6. Comparing the range of the chl-α values obtained using the factory calibrations (Fig. 6a) with the range obtained after applying the calibration coefficients obtained with the presently described method (Fig. 6d), it becomes evident
20
that the calibration was a necessary exercise, as the use of the factory calibrations would result to a severe overestimation of the phytoplankton concentrations during the experiment. Thus, considering the above result it was decided that the newly obtained calibration coefficients would be adopted. Furthermore, it is interesting to note the unstable behavior of fluorometer with s/n 2729, and the zero values that periodically
25
sensor s/n 2730 produced. The latter were attributed to air bubbles trapped in the tub-ing in the vicinity of the fluorometer sensor. Regardtub-ing the unstable behavior of the 2729 sensor (which behaved well throughout the field experiment), this is most
possi-OSD
3, 165–198, 2006 M3A system G. Petihakis et al. Title Page Abstract Introduction Conclusions References Tables Figures J I J I Back CloseFull Screen / Esc
Printer-friendly Version
Interactive Discussion
EGU
bly due to a rather inefficient experimental design. In order to facilitate and accelerate the whole process, the fluorometer measurements were performed on the same con-trol solutions. Thus, a single water circuit was designed, connecting the tubing of all four CTD platforms, and forcing the same solution to be sampled by all sensors. As the fluorometer that exhibited unstable behavior was the last in the row, it is assumed
5
that the phytoplankton had lost its fluorescence responsiveness as a result of the three previous successive light stimulations.
Transmissometers were post deployment calibrated by the standard method of block-ing the receiver and obtainblock-ing a dark readblock-ing of output voltage and by takblock-ing several voltage readings in de-ionized water to obtain a clean water offset.
10
4 Top period
4.1 Periodic maintenance
As already mentioned a significant aspect right from the start of the project was the minimisation of cost, achieved mainly through the minimization of maintenance effort. The three line configuration approach adopted could ensure the low operation cost
15
as only a relatively small part of the equipment had to be frequently removed. More specifically for line 1 hosting the buoy a bimonthly servicing schedule was decided only for the buoy sensors with an on-site procedure, while for the SeaCats the servic-ing interval due to the absence of foulservic-ing was limited to battery replacement every 12 months. Since the sensors of line 2 were in the euphotic zone, fouling was expected
20
to significantly affect the accuracy of the measurements prohibiting long deployment intervals. Additionally the wet chemistry procedure of nitrate analysis and the 3 h sam-pling frequency of all sensors determined a bimonthly maintenance interval. Although the design was such that during servicing the full line had to be recovered and rede-ployed, the whole operation could be carried out with a small R/V such as Philia. For
25
OSD
3, 165–198, 2006 M3A system G. Petihakis et al. Title Page Abstract Introduction Conclusions References Tables Figures J I J I Back CloseFull Screen / Esc
Printer-friendly Version
Interactive Discussion
EGU
6 months mainly for battery replacement, data downloading and cleaning. Additionally for emergency visits the inflatable IOLKOS was used.
In the course of phase 1 and phase 2 of the MFS project 13 scheduled and 15 emergency visits were performed (Table 1). In detail the duration of the scheduled maintenance trips was three days with the first one dedicated to the retrieval of line 2
5
(and line 3 when applicable). After 21/2h of sailing from Heraklion harbour, R/V Philia reached the deployment site. Line 2 was acoustically released and once surfaced; the top part of the line was brought into the deck and disconnected from the lower part. Fol-lowing all instruments were disconnected and removed while the approximately 800 m rope of the lower part was rolled into the ship’s drum. All instruments, cables and
float-10
ing spheres were thoroughly cleaned with the use of mild detergent and low-pressure washing gun. Parallel to the above, water samples from the depths of 0, 35, 40, 60, 85, 110 and 200 m were collected with niskin bottles and a CTD profile (conductivity, tem-perature, pressure, dissolved oxygen, fluorescence, turbidity and PAR) down to 1000 m was also done. A small amount of the water samples was immediately used for
dis-15
solved oxygen estimation (fixing) while from the rest, a known quantity (approximately 2 liters) was filtered at boat’s wet lab. After that both filters and filtered water were placed in the freezer until transported to HCMR chemistry lab for estimation of chlorophyll and nutrients (Phosphate, Nitrate, Nitrite, Ammonium and Silicate). In addition all sensors onboard the buoy were cleaned by divers who also examined the anchoring and
ca-20
ble systems. Once at Heraklion harbour the 4 CTD’s and the Nutrient Analyzer were transported into HCMR facilities for further maintenance and downloading of data.
During the second day at the HCMR facilities several tasks were taking place simul-taneously. The fixed oxygen samples were analyzed with the Winkler (Carpenter, 1965) method while the nutrient analyzer was brought to the chemistry lab where it was
thor-25
oughly cleaned and data was downloaded to a PC. The syringe and the inlet-outlets were dismantled and washed with mild acid to remove any organic deposits while the colorimeter was flushed with a mild soap. The analyzer bags were filled with fresh chemicals and a new cadmium column was prepared. The efficiency of the colorimeter
OSD
3, 165–198, 2006 M3A system G. Petihakis et al. Title Page Abstract Introduction Conclusions References Tables Figures J I J I Back CloseFull Screen / Esc
Printer-friendly Version
Interactive Discussion
EGU
was tested in the lab against known concentration solutions and once satisfactory, the sampling protocol was programmed. Data from the CTD’s and Nireus was downloaded into a PC and all sensors were dismantled, carefully cleaned and serviced according to the manufacturer’s instructions. In several occasions malfunctioning censors as re-vealed by the acquired data had to be removed for servicing, either on spot or send
5
to the corresponding factory. In addition all sensor batteries were evaluated and when appropriate replaced with new ones. Once serviced, CTD’s and nutrient analyzer were transported into R/V Philia where they were connected with the corresponding cables and the whole line was re-assembled and set to standby for deployment (instruments were not powered).
10
Early at the third day before departure a final check was performed at all instruments, which were then activated in order to have same reference measurements prior to the deployment. Although the deployment area is characterised by very small slopes, once in the sea, a communication check with the acoustic releasers was done to ensure that the system had been anchoraged at the correct depth.
15
During the following days nutrients and chl-a concentrations were estimated at HCMR chemistry lab using standard methods. A Turner 00-AU-10 fluorometer was used for the chlorophyll-a analysis. Fluorescence was converted to chlorophyll-a using the formula of (Yentsch and Menzel, 1963). Temperature, salinity, light attenuation and PAR data were compared against reference CTD measurements carried out by the
20
SBE-25 of R/V Filia and the SBE-911 of R/V Aegaeo respectively. Salinity measure-ments of the reference CTD casts were corrected against Salinometer analysis of the water samples.
Emergency trips were mainly done with the HCMR inflatable IOLKOS for a number of causes most of which were related with communication problems.
25
4.2 Post-deployment sensor calibration
During the first phase, soon after each maintenance using the recorded values by the M3A instruments and the reference in-situ measured values, correction coefficients
OSD
3, 165–198, 2006 M3A system G. Petihakis et al. Title Page Abstract Introduction Conclusions References Tables Figures J I J I Back CloseFull Screen / Esc
Printer-friendly Version
Interactive Discussion
EGU
were estimated for the transfer functions that convert the sensors output to engineer-ing units (Nittis et al., 2003). In all cases, correction coefficients were applied to the oxygen and chlorophyll-a measurements where the deviation between in-situ and refer-ence measurements was significantly exceeding the sensor’s accuracy (0.5–1.2 ml/l for dissolved oxygen, 1.2–3.2 µg/l for a). In fact, the initial values of
chlorophyll-5
a estimated by the M3A fluorometers were one order of magnitude higher than the ref-erence values (0.6–3.2 µg/l instead of 0.05–0.5 µg/l). This was most probably related to the fact that the sensors had been calibrated by the manufacturer with different phy-toplankton populations as mentioned above. Furthermore the instrument’s range (0– 75 µg/l) was much larger than the typical ranges of the oligotrophic Cretan Sea. Thus
10
at the second phase it was decided to correct the manufacturer’s calibration through a series of lab experiments as already described.
It is interesting to note that for each oxygen or chlorophyll sensors, the correction coefficients estimated during the first 8 months of operation were each time the same (January, May and August 2000). This indicates that the sensors had a stable behavior
15
during that period. The coefficients estimated during the following maintenance vis-its were different, indicating an important impact of the increased fouling during the summer period.
4.3 Problems encountered
The main problem during the first phase of the project was caused by a false
connec-20
tion of the umbilical cable with the surface buoy. The first sign of the problem was the decreasing quality of data transmission from line 1 and 2 through the umbilical which appeared approximately 3 weeks after the deployment. The replacement of a connec-tor which was thought to be the source of the problem was not the solution, as proved five months later when the surface buoy broke off. After approximately one week the
25
buoy was found having being washed ashore and severely damaged at the north east coast of Crete. It was decided that line 1 would remain in position without any real-time transmission and without surface data. Thus all data from lines 2 and 3 would be
down-OSD
3, 165–198, 2006 M3A system G. Petihakis et al. Title Page Abstract Introduction Conclusions References Tables Figures J I J I Back CloseFull Screen / Esc
Printer-friendly Version
Interactive Discussion
EGU
loaded during scheduled maintenance and data from line 1 once the whole line would be retrieved. During the first five months due to a problematic Argos antenna most of the collected data was transferred with GSM network. An interesting outcome is that the GSM backup solution gave an overall 80% successful data retrieval in contrast with the Argos where the percentage dropped to 60% (Nittis et al., 2003).
5
With the various sensors the main problems were associated with the light transmis-sion and PAR sensors as these are very sensitive to fouling as mentioned before. In ad-dition PAR sensors exhibited problems associated with their amplifiers while dissolved oxygen sensors were rather reliable provided a re-calibration routine was performed with in-situ data. As expected temperature and salinity sensors were very reliable
with-10
out any need for re-calibration.
Soon after the start of the second phase of the project, there were some problems associated with the bi-directional data transfer and remote reprogramming of the buoy causing inefficient data transfer to HCMR. Although these problems were successfully solved on site during an emergency visit, soon after the communication was completely
15
lost. Thus in the course of a scheduled maintenance the buoy was removed and trans-ferred to HCMR for servicing. Apart from a couple of flooded solar panel junction boxes which were easily repaired, the main problem of the buoy was a destroyed PC moth-erboard. Since a replacement part was not available it was decided that deployment of the buoy should be postponed until the next scheduled maintenance. There were
20
also problems with Line 2, and in particular with the recently factory serviced nutrient analyser which once more was flooded due to a faulty gasket at the syringe piston. Un-fortunately although the instrument had made measurements during the deployment period (all chemicals were used) it proved impossible to recover the data. As during the first phase there was gas build up inside the Nireus PC battery housing requiring
25
very careful handling, in the second phase bleeding valves were installed one of which proved to be faulty flooding the container. Thus as there were no data stored in the underwater PC, all data were downloaded from each individual CTD with the excep-tion of the top one (S/N 3) in which the batteries were completely drained, loosing all
OSD
3, 165–198, 2006 M3A system G. Petihakis et al. Title Page Abstract Introduction Conclusions References Tables Figures J I J I Back CloseFull Screen / Esc
Printer-friendly Version
Interactive Discussion
EGU
measurements. This problem with drained batteries persisted for most of the second phase for the top of the line CTD (S/N 3) as well as for the S/N 1 at 60 m and S/N 4 at 110 m during the last deployment, exhibiting a serious disadvantage of the particular instruments as the data are not stored in a flash type memory.
Finally in October 2005, 14 months after the first deployment the buoy once more
5
broke loose and was found in the eastern part of Crete, thankfully before being washed ashore. Surprisingly the 16 mm wire rope was clean-cut at approximately 600 m depth, loosing 12 pairs of floating spheres and two acoustic releasers. However all four CT’s mounted on the inductive wire rope were recovered in very good condition and all data were downloaded successfully.
10
5 Buoy performance
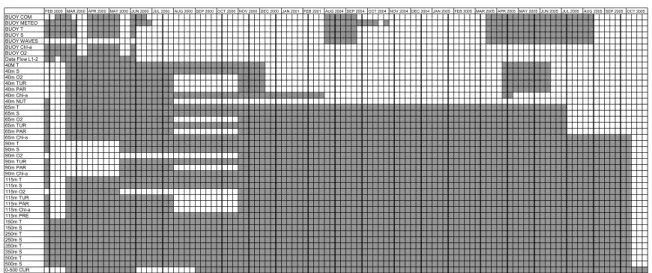
In Table 2, the overall performance of the M3A system during the two phases is pre-sented. It is evident that the most reliable instruments were the four CT’s producing non-stop measurements of temperature and salinity in contrast with the nitrate analyser which had a working period of approximately 4 months. Although the latter was one
15
of the first instruments produced and unavoidably had a number of defects, the data produced was exceptionally good even for the oligotrophic Cretan Sea. Additionally most of the problems related to the optical sensors during the first phase were suc-cessfully solved, while the serious disadvantage of the CTD’s relying solely on power for data storage, resulted in the loss of significant data. The surface buoy has proved
20
to be the weakest part of the system since it had the longer periods of inactivity due to malfunction of different sub-components. Since this buoy has already extended its expected lifetime its upgrade or replacement is among the highest priorities for the next years. Finally, the line-3 ADCP had an overall very good performance and provided a long time series of current profiles in the 0–500 m layer.
25
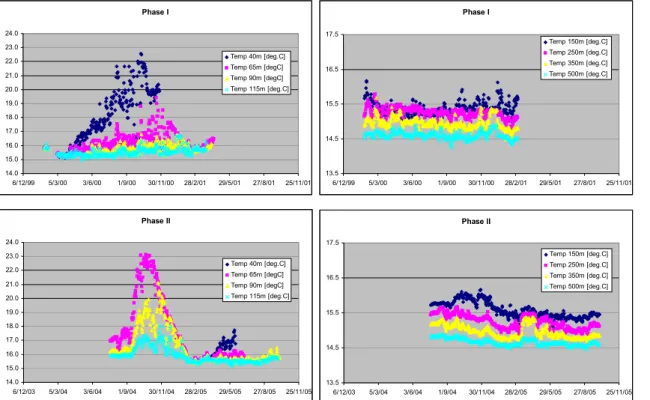
The temperature time series at various depths are shown in Fig. 7. Comparing the top part of the water column during the two phases one can observe a clear warming
OSD
3, 165–198, 2006 M3A system G. Petihakis et al. Title Page Abstract Introduction Conclusions References Tables Figures J I J I Back CloseFull Screen / Esc
Printer-friendly Version
Interactive Discussion
EGU
of the upper 100 m between the periods. Such variability can be justified by the fast response of the seasonal thermocline to interannual variability of atmospheric forc-ing. The respective differences in the lower part (100–500 m) of the water column are smaller but an increased temporal variability and a stronger stratification is presented in Phase-II compared to Phase-I. This can be attributed either to interannual variability
5
of vertical mixing and diffusive processes or to shorter time scale (synoptic) variability of the mesoscale features (cyclonic-anticyclonic dipole) that control the dynamics of the Cretan Sea (Cardin et al., 2003).
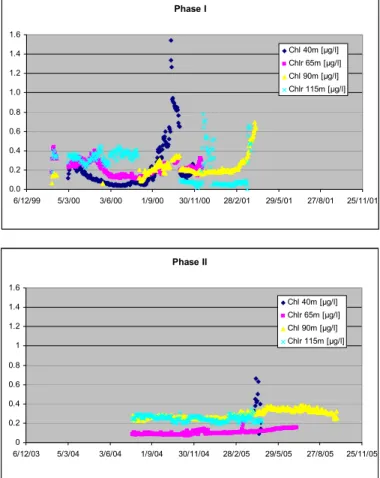
The calibrated chlorophyll-a measurements from the four fluorometers in line 2 dur-ing the two phases of MFS project are shown in Fig. 8. A noticeable feature is the
10
reduced variability in all chl-a measurements during the second phase, although the data at 40 m, is rather inadequate which is the depth expected to show such phenom-ena.
6 Conclusions
During the pilot phase of the Mediterranean Forecasting System a prototype observing
15
system was designed, developed and operated in the Cretan Sea aiming towards the continuous recording of multi parametric data. Such time series are a valuable tool for both the insight into the system dynamics as well as a prerequisite for model de-velopment, calibration and validation. The low maintenance cost, a key aspect of the project, forced towards a modular design allowing different servicing intervals between
20
the various parts of the system. Thus only the necessary components were maintained at each visit avoiding the use of large and expensive vessels and at the same time en-suring a fast response to system failures. Although, the use of distributed units that communicate through underwater acoustic links is a promising technology, in this par-ticular application there were significant problems associated with the communication
25
between the two lines. A false connection on the umbilical cable transferring data of both line 1 and 2 to the surface buoy, disrupted the internal data flow of the system
OSD
3, 165–198, 2006 M3A system G. Petihakis et al. Title Page Abstract Introduction Conclusions References Tables Figures J I J I Back CloseFull Screen / Esc
Printer-friendly Version
Interactive Discussion
EGU
few weeks after the deployment. Due to this the possibility of hydro-acoustic commu-nications could not be fully explored. Apart from the underwater communication, the Argos system proved to be rather inefficient for the transfer of data to HCMR, with an approximately 60% recovery, mainly due to the large volume of transmitted information. On the other hand although transfer of data through the GSM network was significantly
5
more reliable (80%), this method is not recommended in open sea conditions. The other significant source of problems was the optical sensors which were found to be very sensitive to biofouling and in particular the light transmittance sensors. Although the fluorometers were also affected the severity was related to particular times of the year when there was elevated production in the system as well as to long deployments.
10
An interesting phenomenon was the strong vertical displacement of instruments due to very high currents as recorded by pressure sensors and the ADCP respectively. Although this effect was visible in all time series it was easily excluded using a simple interpolation method with only exception the Chl-a data as the sensor response during this vertical movement cannot be predicted. Overall, during the first phase, dissolved
15
oxygen and chlorophyll-a sensors were able to provide reliable data after consistent re-calibration against in-situ measurements during each maintenance cruise.
With the significant experience gained during the 2000–2001 deployment the project moved to the second phase with three major aims, the first of which was the improve-ment of both underwater and aerial communications. Thus under-water acoustic
bi-20
directional modems and IMC modems were used, while the underwater hardwired net-work was embedded into the buoy container and attached on the mooring line. To overcome the problem of communication between the two lines during summer (ther-mocline development), higher rates (up to 4800 Bits/s) were developed. For the aerial communication, a tested and very reliable technology used on the 11 Seawatch buoys
25
that operate in the Aegean Sea in the framework of the Poseidon project (Nittis et al., 2001) was selected, transmitting all data through Inmarsat-C satellite. The disadvan-tages of the new system were the increased energy requirements and the increased running cost, but at the same time there was the possibility of two-way communication,
OSD
3, 165–198, 2006 M3A system G. Petihakis et al. Title Page Abstract Introduction Conclusions References Tables Figures J I J I Back CloseFull Screen / Esc
Printer-friendly Version
Interactive Discussion
EGU
an important feature as minor problems could be solved from HCMR avoiding on-site visits.
The second aim was the redesign of the surface buoy increasing modularity and flexibility and at the same time decreasing complexity and servicing requirements. Par-ticular attention was paid in the optimisation of the hull’s hydrodynamic performance
5
increasing the buoy’s ability to withstand waves up to 12 m.
The final aim was the minimisation of the biofouling effect especially for the optical sensors. To overcome this problem new methods and anti-fouling techniques have been developed, such as the generation of biocide chlorine compounds on tin oxide coating, the use of UV pulses, the incorporation of cooper shutters, the use of copper
10
tubing and the bromide pumping technique, each one with its advantages and disad-vantages. As not all of the above methods could be simultaneously applied it was decided to perform a pilot field study were some of these method would be evaluated on similar, with the deployment site, environmental conditions. As the copper-shutter technology was not available and applicable to the M3A instrument configuration, the
15
techniques of bromine solution and copper shielding (tubing) were tested. The short experimental study suggested that a combination of copper tubing and bromine solu-tion would be more efficient than each one separately, and therefore this was selected for application to the M3A mooring. This pilot test demonstrates that, the M3A system could be used in the future as a test-bed where prototypes and new methodologies
20
are evaluated. Parallel to the above several quality control procedures accompanied the deployment of the M3A platform during the second phase. The oligotrophy of the Aegean Sea dictated the need to ignore factory calibrations of the fluorometers, and perform site-specific laboratory calibrations of the sensors. The calibration of each sen-sor was based on five samples of local phytoplankton populations which were
nutrient-25
enriched and cultured for about 10 days to attain discrete chl-a concentration values. This procedure was proved necessary and produced calibration coefficients that gave results comparable to the measurements obtained with the laboratory analysis method. Analysis of the collected data during the two phases of MFS project indicates the
OSD
3, 165–198, 2006 M3A system G. Petihakis et al. Title Page Abstract Introduction Conclusions References Tables Figures J I J I Back CloseFull Screen / Esc
Printer-friendly Version
Interactive Discussion
EGU
highly variable character of the Cretan Sea. The circulation in the Cretan Sea is dic-tated by the combined effect of two gyral features, an anticyclonic eddy in the west and a cyclonic eddy in the east of the M3A (Georgopoulos et al., 2000; Theocharis et al., 1999). Additionally there are a number of water masses, with the Modified Atlantic Waters (MAW) occupying the surface layers, the Cretan Intermediate Water (CIW)
be-5
neath it and the very important Transient Mediterranean Water (TMW). The latter is an old water mass characterised by high nutrient and low oxygen concentrations, that under certain circumstances (increased eddy dipole intensity) can enrich the euphotic zone initiating small-scale phytoplankton blooms. The extreme oligotrophic character in conjunction with the phosphorus limitation pushes the system towards a microbial
10
loop especially during periods of stratification, recycling nutrients very fast. Only during mixing the system adopts a more traditional type of food chain with bigger phytoplank-ton cells and energy being transfer to higher trophic levels. The above features result in a highly variable environment with phenomena at very short time scales, almost im-possible to capture with traditional sampling trips, demonstrating thus the importance
15
of continuous multidisciplinary monitoring.
One of the common issues related to ocean observatories is the limited use of the produced data by the scientific community. This problem is both due to the limited access in the data and to the fact that the data needs of the modellers and/or the ex-perimentalists are rarely taken into account during the design of the platforms. In the
20
case of the M3A this first issue has been adequately tackled by making widely avail-able all data sets through the project web site. Additionally during the system design phase there was significant feedback between the possible users as to where and what sensors should be used. As a result the data has been used for both process studies that improve our understanding of the Mediterranean Sea functioning (Cardin et al.,
25
2003) and for the development of ecological models that simulate its ecosystem vari-ability (Allen et al., 2002; Petihakis et al., 2002; Siddorn and Allen, 2003; Triantafyllou et al., 2003b). A very important aspect of the produced data is its use in assimilation methods developed by HCMR in order to be able to use real-time M3A data into the
OSD
3, 165–198, 2006 M3A system G. Petihakis et al. Title Page Abstract Introduction Conclusions References Tables Figures J I J I Back CloseFull Screen / Esc
Printer-friendly Version
Interactive Discussion
EGU
MFS operational forecasting system (Hoteit et al., 2003, 2004, 2005; Triantafyllou et al., 2003a).
There are a number of marine research topics that observation systems will offer a great deal in the future, such as the high frequency study of biogeochemical pro-cesses and in particular the influence of anthropogenic perturbations in the ecosystem
5
dynamics (Nittis et al., 2003), the ocean-climate coupling and the understanding of car-bon dioxide sequestration and the model development. Simulating models not only can offer significant insight towards the understanding of marine ecological processes but can also act as tools for effective management and in particular for the fragile and highly variable coastal zones. Predicting the behaviour of the marine environment and
under-10
standing its variability is an essential part of the management of marine resources. It is therefore essential to have an operational coastal ocean environmental monitoring and forecast system. Such a system will constitute an essential tool in guiding marine resources management and, additionally, it would form an early warning system of po-tentially harmful ecological events and aid the formulation of cost effective preventive
15
and remedial measures.
The three dimensional modelling of marine ecosystems is lagging behind the mod-elling of marine physics, because it requires robust hydrodynamic models, adequate computing resources and most importantly adequate field data. Additionally to achieve predictive capabilities, deterministic ecosystem models need to be updated with
biolog-20
ical, physical and chemical data at relevant space-time scales. Unfortunately in most areas long, high frequency time series of crucial for the models, system parameters do not exist. A network of ocean observatories collecting a wide range of high-resolution measurements along with the capability of adaptive sampling of environmental events, would greatly enhance the ability of researchers to develop and improve models of
25
oceanographic processes (Isern and Clark, 2003).
The overall experience from the two phases of MFS project suggests that a con-tinuous operation of the M3A system is feasible at relatively low cost, although new developments and improvements in particular parts remains an open issue. During the
OSD
3, 165–198, 2006 M3A system G. Petihakis et al. Title Page Abstract Introduction Conclusions References Tables Figures J I J I Back CloseFull Screen / Esc
Printer-friendly Version
Interactive Discussion
EGU
last years important technological solutions have been produced by the continuously growing research industry. Thus more and more parameters can now days be mea-sured both onboard platforms and underwater in a wide range of conditions and with rather long servicing intervals. Although there is still a long way on this research topic especially on biochemical parameters the future is very promising.
5
Acknowledgements. The work was carried out in the framework of the Mediterranean Fore-casting System – Pilot Project (MFSPP) and Towards Environmental Predictions (MFSTEP) projects. We acknowledge the support of the European Commission MAST3 Program that fi-nanced the project the General Secretary of Research and Technology of the Hellenic Ministry of Development for co-financing.
10
References
Allen, J. I., Somerfield, P. J., and Siddorn, J. R.: Primary and bacterial production in the Mediter-ranean Sea: a modelling study, J. Marine Syst., 33–34, 473–495, 2002.
Balopoulos, T. E., Theocharis, A., Kontoyiannis, H., Varnavas, S., Voutsinou-Taliadouri, F., Iona, A., Souvermezoglou, A., Ignatiades, L., Gotsis-Skretas, O., and Pavlidou, A.: Major
15
advances in the oceanography of the southern Aegean Sea – Cretan Straits system (eastern Mediterranean), Progress in Oceanography, 44, 109–130, 1999.
Cardin, V., Gaˇci´c, M., Nittis, K., Kovaˇcevi´c, V., and Perini, L.: Sub-inertial variability in the Cretan Sea from M3A buoy, Ann. Geophys., 21(1), 89–102, 2003.
Carpenter, J. H.: The accuracy of the Winkler method for the dissolved oxygen analysis,
Lim-20
nology and Oceanology, 10, 135–140, 1965.
Colwell, R.: Ocean research interactive observatories networks (ORION): Planning for the fu-ture of ocean science at the National Science Foundation, Ocean Observing Systems, 37(3), 15–20, 2003.
Drakopoulos, P., Petihakis, G., Valavanis, V., Nittis, K., and Triantafyllou, G.: Optical variability
25
associated with phytoplankton dynamics in the Cretan Sea during 2000 and 2001, Elsevier Oceanography Series, Elsevier BV, pp. 554–561, 2003.
Pre-OSD
3, 165–198, 2006 M3A system G. Petihakis et al. Title Page Abstract Introduction Conclusions References Tables Figures J I J I Back CloseFull Screen / Esc
Printer-friendly Version
Interactive Discussion
EGU
liminary experiments towards controlling biofouling effects on the M3A array’s optical instru-ments, Rapp. Comm. Int. Mer Medit., 37, 92, 2004.
Georgopoulos, D., Chronis, G., Zervakis, V., Lykousis, V., Poulos, S., and Iona, A.: Hydrol-ogy and circulation in the Southern Cretan Sea during the CINCS experiment (May 1994– September 1995), Progress in Oceanography, 46, 89–112, 2000.
5
Hoteit, I., Triantafyllou, G., and Petihakis, G.: Towards a data assimilation system for the Cretan sea ecosystem using a simplified Kalman filter, J. Marine Syst., 45, 159–171, 2004.
Hoteit, I., Triantafyllou, G., and Petihakis, G.: Efficient data assimilation into a complex 3-D physical-biogeochemical model using a semi-evolutive partially-local Kalman filters, Ann. Geophys., 23, 1–15, 2005.
10
Hoteit, I., Triantafyllou, G., Petihakis, G., and Allen, J. I.: A singular evolutive Kalman filter to assimilate real in-situ data in a 1-D marine ecosystem model, Ann. Geophys., 21, 389–397, 2003.
Isern, A. R. and Clark, H. L.: The ocean observatories initiative: A continued presence for interactive ocean research, Ocean Observing Systems, 37(3), 26–41, 2003.
15
Manov, D. V., Chang, G. C., and Dickey, T. D.: Methods for reducing biofouling of moored optical sensors, J. Atmos. Ocean. Tech., 21(6), 958–968, 2004.
Nittis, K., Tziavos, C., Thanos, I., Drakopoulos, P., Cardin, V., Gacic, M., Petihakis, G., and Basana, R.: The Mediterranean Moored Multi-sensor Array (M3A): System Development and Initial Results, Ann. Geophys., 21(1), 75–87, 2003.
20
Nittis, K., Zervakis, V., Perivoliotis, L., Papadopoulos, A., and Chronis, G.: Operational Monitor-ing and ForecastMonitor-ing in the Aegean Sea: System Limitations and ForecastMonitor-ing Skill Evaluation, Marine Pollution Bulletin, 43(7–12), 154–163, 2001.
Petihakis, G., Triantafyllou, G., Allen, J. I., Hoteit, I., and Dounas, C.: Modelling the Spatial and Temporal Variability of the Cretan Sea Ecosystem, J. Marine Syst., 36(3–4), 173–196,
25
2002.
Pinardi, N. and Flemming, E.: The Mediterranean Forecasting System, Science Plan, 11. Eu-roGOOS Publication, Southampton, 1998.
Seim, H., Nelson, J., Bane, J., Blanton, J., Werner, F., Jahnke, R., Moran, M., Zepp, R., and Paffenhofer, G.: SABSOON science report, Skidaway Institute of Oceanography, Savannah,
30
USA, 2000.
Siddorn, J. R. and Allen, J. I.: Surface heat fluxes and ecosystem function in the Cretan Sea (eastern Mediterranean): a modelling study, Ann. Geophys., 21(1), 377–388, 2003.
OSD
3, 165–198, 2006 M3A system G. Petihakis et al. Title Page Abstract Introduction Conclusions References Tables Figures J I J I Back CloseFull Screen / Esc
Printer-friendly Version
Interactive Discussion
EGU
Thanos, I. and Pezirtzoglou, E.: Design and Construction of a Prototype Wave Directional Data Buoy, Hellenic Symposium on Oceanography and Fisheries, NCMR, Kavala, Greece, 1997. Theocharis, A., Balopoulos, E., Kioroglou, S., Kontoyiannis, H., and Iona, A.: A synthesis of
the circulation and hydrography of the South Aegean Sea and the Straits of the Cretan Arc (March 1994–January 1995), Progress in Oceanography, 44, 469–509, 1999.
5
Triantafyllou, G., Hoteit, I., and Petihakis, G.: A singular evolutive interpolated Kalman filter for efficient data assimilation in a 3-D complex physical-biogeochemical model of the Cretan Sea, J. Marine Syst., 40–41, 213–231, 2003a.
Triantafyllou, G., Petihakis, G., and Allen, J. I.: Assessing the performance of the Cretan Sea ecosystem model with the use of high frequency M3A buoy data set, Ann. Geophys., 21,
10
365–375, 2003b.
Tselepides, A. and Polychronaki, T.: Pelagic-benthic coupling in the oligotrophic Cretan Sea (Ne Mediterranean), IMBC, Iraklio, 1996.
Yentsch, C. S. and Menzel, D. W.: A method for the determination of phytoplankton chlorophyll and phaeophytin by fluorescence, Deep-Sea Res., 10, 221–231, 1963.
OSD
3, 165–198, 2006 M3A system G. Petihakis et al. Title Page Abstract Introduction Conclusions References Tables Figures J I J I Back CloseFull Screen / Esc
Printer-friendly Version
Interactive Discussion
EGU
Table 1. Visits to M3A.
Vessel Date Type Problems
Aegeao 27/1/00 Scheduled Start of MFSPP Line 3 was not deployed due to ADCP malfunctioning Philia 9/2/00 Emergency Redeployment of line 2
Philia 2/3/00 Emergency The serviced ADCP was deployed (line 3) Philia 4/3/00 Scheduled Due to sensor problems CTD S/N3 was removed.
Iolkos 22/4/00 Emergency After a problematic communication with the buoy it was discovered that the cen-tral mast with the antennas was broken.
Iolkos 24/4/00 Emergency The broken part mast was removed and the antennas secured on the remaining structure but not the wind generator, weather station probes etc
Iolkos 28/4/00 Emergency Communication problems with ARGOS
Iolkos 9/5/00 Emergency Due to decreased quality transmittance of data from line 1 to the main computer on board the buoy an underwater connector was replaced
Iolkos 12/5/00 Emergency The onboard PC was removed for maintenance Philia 15–17/5/00 Scheduled The oxygen sensors at CTD S/N3 & 4 were not working Iolkos 1/6/00 Emergency PC communication problems
Iolkos 5/7/00 Emergency The surface buoy broke off and was recovered at the east Crete.
Philia 10/7/00 Due to ship traffic the top part of line 1 was submerged to 20–30 m by adding weights.
Philia 31/7–2/8/00 Scheduled Due to ADCP malfunction mooring line 3 was not deployed Philia 31/8/2000 Emergency Deployment of line3
Philia 29-31/10/00 Scheduled CTD malfunctioning sensors – S/N3 (40 m) turbidity, PAR and oxygen, – S/N1 (65 m) oxygen and PAR, – S/N 2 (90 m) oxygen and PAR - S/N 4 (115 m) oxygen, PAR, turbidity chl-a. Also the nutrient analyser due to a falt in the syringe did not perform any measurements.
Philia 6/3/2001 Scheduled Maintenance of line 2
Philia 19–22/4/01 Scheduled The nutrient analyzer was not functioning and could not be fixed, while there were problems with CTD S/N 3 at 40 m which had no measurements with only exception the Chl-a sensor.
Aegaeo 27/11/01 Scheduled End of MFSPP Aegaeo 20/7/04 Scheduled Start of MFSTEP
Iolkos 4/8/04 Emergency The onboard PC was rebooted Iolkos 17/9/04 Emergency The communication was lost
Philia 1–5/11/04 Scheduled Apart from the maintenance of line 2 the surface buoy was removed Philia 6–8/4/05 Scheduled The serviced buoy was attached once more in line 1
Iolkos 20/4/05 Emergency Small repairs on surface buoy Iolkos 25/4/05 Emergency The onboard PC was rebooted
Philia 22/10/05 Emergency Line 1 had broke off and the was recovered in the East Crete
Philia 16–22/11/05 Scheduled Line 3 was removed and from line 2 CTD S/N1 was replaced with a SeaCat sensor from line 1.
OSD
3, 165–198, 2006 M3A system G. Petihakis et al. Title Page Abstract Introduction Conclusions References Tables Figures J I J I Back CloseFull Screen / Esc
Printer-friendly Version
Interactive Discussion
EGU
Table 2. System performance (white colour indicates absence or bad data). Table 2. System performance (white colour indicates absence or bad data)
FEB 2000 MAR 2000 APR 2000 MAY 2000 JUN 2000 JUL 2000AUG 2000 SEP 2000 OCT 2000 NOV 2000 DEC 2000 JAN 2001 FEB 2001 AUG 2004 SEP 2004 OCT 2004 NOV 2004 DEC 2004 JAN 2005 FEB 2005 MAR 2005 APR 2005 MAY 2005 JUN 2005 JUL 2005AUG 2005 SEP 2005 OCT 2005
BUOY COM BUOY METEO BUOY T BUOY S BUOY WAVES BUOY Chl-a BUOY O2 Data Flow L1-2 40M T 40m S 40m O2 40m TUR 40m PAR 40m Chl-a 40m NUT 65m T 65m S 65m O2 65m TUR 65m PAR 65m Chl-a 90m T 90m S 90m O2 90m TUR 90m PAR 90m Chl-a 115m T 115m S 115m O2 115m TUR 115m PAR 115m Chl-a 115m PRE 150m T 150m S 250m T 250m S 350m T 350m S 500m T 500m S 0-500 CUR 22
OSD
3, 165–198, 2006 M3A system G. Petihakis et al. Title Page Abstract Introduction Conclusions References Tables Figures J I J I Back CloseFull Screen / Esc
Printer-friendly Version
Interactive Discussion
EGU
Figure 1.
Location of M3A station
23
Fig. 1. Location of M3A station.OSD
3, 165–198, 2006 M3A system G. Petihakis et al. Title Page Abstract Introduction Conclusions References Tables Figures J I J I Back CloseFull Screen / Esc
Printer-friendly Version
Interactive Discussion
EGU
Figure 2. M3A station setup
Fig. 2. M3A station setup.
OSD
3, 165–198, 2006 M3A system G. Petihakis et al. Title Page Abstract Introduction Conclusions References Tables Figures J I J I Back CloseFull Screen / Esc
Printer-friendly Version Interactive Discussion EGU 01/06 01/07 100 150 200 250 300 350 400 450
Figure 3. Lowpass filtered PAR (blue) and incoming solar radiation (green). Note the progressive increase of the distance of the two lines, suggesting the buildup of biofouling on the surface of the PAR sensor bulb.
25
Fig. 3. Lowpass filtered PAR (blue) and incoming solar radiation (green). Note the progressive
increase of the distance of the two lines, suggesting the buildup of biofouling on the surface of the PAR sensor bulb.
OSD
3, 165–198, 2006 M3A system G. Petihakis et al. Title Page Abstract Introduction Conclusions References Tables Figures J I J I Back CloseFull Screen / Esc
Printer-friendly Version
Interactive Discussion
EGU
Figure 4. Beam attenuation coefficient time series for two transmissometers, one with the copper tubing (dashed line) and one with the combined bromine solution and copper tubing (solid line).
Fig. 4. Beam attenuation coefficient time series for two transmissometers, one with the copper
tubing (dashed line) and one with the combined bromine solution and copper tubing (solid line).
OSD
3, 165–198, 2006 M3A system G. Petihakis et al. Title Page Abstract Introduction Conclusions References Tables Figures J I J I Back CloseFull Screen / Esc
Printer-friendly Version Interactive Discussion EGU 18-Ma r-04 25-Ma r-04 1-A pr-04 8-A pr-04 15-Ap r-04 22-Ap r-04 29-Ap r-04 6-M ay-04 13-Ma y-04 20-Ma y-04 27-Ma y-04 0 0.2 0.4 0.6 0.8 1 1.2 1.4 1.6 μ gr l -1 18-Ma r-04 25-Ma r-04 1-A pr-04 8-A pr-04 15-Ap r-04 22-Ap r-04 29-Ap r-04 6-May-0 4 13-Ma y-04 20-Ma y-04 27-Ma y-04 Copper tubing only
Bromine solution and Copper tubing only Chl-á
Figure 5. Comparison of Chl-α fluorometers during the second deployment experiment
Fig. 5. Comparison of Chl-α fluorometers during the second deployment experiment.
OSD
3, 165–198, 2006 M3A system G. Petihakis et al. Title Page Abstract Introduction Conclusions References Tables Figures J I J I Back CloseFull Screen / Esc
Printer-friendly Version
Interactive Discussion
EGU
Figure 6. Fluorometer calibration results are presented, as time series of (a) chl-α concentration of the alternating control solutions based on factory calibration values, (b) corresponding voltage of the fluorometers, (c) reference values obtained via the laboratory method and (d) calibrated and filtered values.
Fig. 6. Fluorometer calibration results are presented, as time series of (a) chl-α concentration of
the alternating control solutions based on factory calibration values,(b) corresponding voltage
of the fluorometers,(c) reference values obtained via the laboratory method and (d) calibrated
OSD
3, 165–198, 2006 M3A system G. Petihakis et al. Title Page Abstract Introduction Conclusions References Tables Figures J I J I Back CloseFull Screen / Esc
Printer-friendly Version Interactive Discussion EGU Phase I 14.0 15.0 16.0 17.0 18.0 19.0 20.0 21.0 22.0 23.0 24.0 6/12/99 5/3/00 3/6/00 1/9/00 30/11/00 28/2/01 29/5/01 27/8/01 25/11/01 Temp 40m [deg.C] Temp 65m [degC] Temp 90m [degC] Temp 115m [deg.C] Phase II 14.0 15.0 16.0 17.0 18.0 19.0 20.0 21.0 22.0 23.0 24.0 6/12/03 5/3/04 3/6/04 1/9/04 30/11/04 28/2/05 29/5/05 27/8/05 25/11/05 Temp 40m [deg.C] Temp 65m [degC] Temp 90m [degC] Temp 115m [deg.C] Phase I 13.5 14.5 15.5 16.5 17.5 6/12/99 5/3/00 3/6/00 1/9/00 30/11/00 28/2/01 29/5/01 27/8/01 25/11/01 Temp 150m [deg.C] Temp 250m [deg.C] Temp 350m [deg.C] Temp 500m [deg.C] Phase II 13.5 14.5 15.5 16.5 17.5 6/12/03 5/3/04 3/6/04 1/9/04 30/11/04 28/2/05 29/5/05 27/8/05 25/11/05 Temp 150m [deg.C] Temp 250m [deg.C] Temp 350m [deg.C] Temp 500m [deg.C]
Figure 7.Temperature measurements at various depths during Phase I and Phase II of MFS project
29
Fig. 7. Temperature measurements at various depths during Phase I and Phase II of MFS
project.
OSD
3, 165–198, 2006 M3A system G. Petihakis et al. Title Page Abstract Introduction Conclusions References Tables Figures J I J I Back CloseFull Screen / Esc
Printer-friendly Version Interactive Discussion EGU Phase I 0.0 0.2 0.4 0.6 0.8 1.0 1.2 1.4 1.6 6/12/99 5/3/00 3/6/00 1/9/00 30/11/00 28/2/01 29/5/01 27/8/01 25/11/01 Chl 40m [μg/l] Chlr 65m [μg/l] Chl 90m [μg/l] Chlr 115m [μg/l] Phase II 0 0.2 0.4 0.6 0.8 1 1.2 1.4 1.6 6/12/03 5/3/04 3/6/04 1/9/04 30/11/04 28/2/05 29/5/05 27/8/05 25/11/05 Chl 40m [μg/l] Chlr 65m [μg/l] Chl 90m [μg/l] Chlr 115m [μg/l]
Figure 7.Chlorophyll-a measurements at various depths during Phase I and Phase II of MFS project
Fig. 8. Chlorophyll-a measurements at various depths during Phase I and Phase II of MFS
project.