HAL Id: hal-00987906
https://hal-univ-paris.archives-ouvertes.fr/hal-00987906
Submitted on 11 May 2014
HAL is a multi-disciplinary open access
archive for the deposit and dissemination of
sci-entific research documents, whether they are
pub-lished or not. The documents may come from
teaching and research institutions in France or
abroad, or from public or private research centers.
L’archive ouverte pluridisciplinaire HAL, est
destinée au dépôt et à la diffusion de documents
scientifiques de niveau recherche, publiés ou non,
émanant des établissements d’enseignement et de
recherche français ou étrangers, des laboratoires
publics ou privés.
Mass transfer between Eastern Tien Shan and adjacent
basins (central Asia): constraints on regional tectonics
and topography
F Métivier, Y Gaudemer
To cite this version:
F Métivier, Y Gaudemer. Mass transfer between Eastern Tien Shan and adjacent basins (central
Asia): constraints on regional tectonics and topography. Geophysical Journal International, Oxford
University Press (OUP), 1997, 128, pp.1-17. �hal-00987906�
Mass transfer between eastern Tien Shan and adjacent basins
(central Asia): constraints on regional tectonics and topography
Franqois Metivier and Yves Gaudemer
Laboratoirede Tectonique, Mkcaniquedela LithosphPre, URA 1093, Institutde Physiquedu Globede Paris, 4place Jussieu. 75252Paris CedexOS, France. E-mail: metivier @ ipgp. jussieu.fr and gaudemer @ ipgp. jussieu.fr
Accepted 1996 July 5. Received 1996 February 13
S U M M A R Y
Using depths and ages derived from isopachs, drill-holes or cross-sections, it is possible to reconstruct the space-time depositional history of a sedimentary basin. Drill holes and cross-sections give the local sedimentation history, while isopachs allow the definition of the spatial distribution of the sediments. Assuming several simple hypotheses, such as similarity of the strata and regional applicability of results derived from local analyses, one can reconstruct balanced maps of the solid (or grain) volumes, and hence the mass of sediments deposited during several time intervals since the Palaeogene.
Applying this method to the Tarim and Dzungar basins (NW China), we estimate the total Cenozoic solid-phase volume and mass of sediments stored to be 1358
f
520 x lo3 km3 (36.7f
14 x 1017 kg) and 172f
56 x lo3 km3 (4.6f
1.5 x 10¹⁷ kg) respectively. The reconstruction also enables us to detect two main pulses in the sedimentation. The first, around 17 Ma, affected only the northern part of the Tarim Basin (also known as the Kucha or Kuche Depression) at the foot of the Tien Shan Mountains and supports the idea that the presently active shortening regime in that range started at that time. The second, 5 to 6 Ma, affected most of the depositional areas of the region and may have an even greater geographical extent. Assuming local isostasy, we estimate the volume of shortening induced by the rotation of the Tarim block relative to Siberia and stored in the range and adjacent basins to be between 1.15 x lo6 and 4.23 x lo6 km3. This correspbnds to a clockwise rota- tion of between 2.5" and 8.7". We use these results in two simple models of self-similar growth of pyramidal topographies that approximately fit the eastern Tien Shan.Key words: Cenozoic, sedimentary basins, Tien Shan.
I N T R O D U C T I O N
In the last 10 years, the analysis of morphology has proven to be a powerful tool in the study of active tectonics (e.g. Hanks e t a / . 1984; Weldon & Sieh 1985; Armijo e t a / . 1986; Tapponnier et a / . 1990; Gaudemer et a/. 1995). By measuring offsets of the pre-Holocene morphology, it is possible to determine slip rates on active faults. If one wants to use mor- phology to quantify tectonics over a longer period of time and on a larger scale, one must take into account the fact that the present-day morphology is the result of the competing influ- ences, integrated over that period, of tectonics, which induces mass movements along faults in the crust, and the erosion- sedimentation cycle, which induces mass transport by water and wind. Therefore, one has to estimate the various mass transfers between mountain ranges and sedimentary basins, the ultimate goal being to calculate the palaeotopography
z ( x , y , t ) at each point (x,y) of a given region at any time t in the past.
Because of the complex interactions between tectonic uplift, denudation and crustal processes at depth, it is difficult, if not impossible, to do this directly in the mountain ranges. By contrast, it is legitimate, to first order, to consider that basins, at least in regions of interior drainage, experience only mass accumulation from the outside and internal redistribution. Because no mass is lost, it is theoretically possible to determine how accumulation has varied with time and therefore how the surrounding source area has evolved. Thus, a first step towards establishing palaeoelevations is to reconstitute the history of sedimentary basins in terms of mass accumulation M ( x , y , t ) (Hay, Shaw & Wold 1989).
This reasoning has led us to calculate the mass stored in two depositional areas, the Tarim and Dzungar basins (northwestern China), which remained closed basins during at
M A S S S T O R E D I N A S E D I M E N T A R Y B A S I N least the Neogene arid Quaternary, in order to reconstruct the
tectonic evolution of the eastern l i e n Shan range (Fig. I )
during that period. Other studies (Chen e t a / . 199 I ; Allen et ul. Mass accumulation per unit area 1993: Avouac ct t i / . 1993; Hendrix, Damitru & Graham 1994)
give a basis for comparison with our results.
In practice. however, the sedimentary record takes the form of successive strata representing the net accumulation over finite time intervals. lherefore, one can only estimate the average of mass accumulation during these intervals. Besides, because of the lack of a well-defined mechanism for large-scale erosion in a region wherc strike-slip faulting and thrusting can produce significant changes in drainage area, it is difficult to determine the source of'a given sedimentary particle. Thus the inass estimated to have accumulated during a n interval can
Calculating mass from measurements of sediment thickness implies a knowledge of how the density of the sediment varies withdepth. There are two ways of making such a calculation ifthe stratigraphic sequence is known: { ( z I , I , ) . i = I . . . . N } where each ( z l . t i ) pair defines the age ( r , ) and the depth ( z l ) (in m) of the ith stratum (the first being the youngest). l h e first method requires a knowledge of the density / I ( : ) . while t he second requires knowledge ofthe porosity ~ ( z ) . Given the depth and the density, the inass accumulation M per unit area over a time interval A / is
-
M ( A / ) =
c:
p ( z ) d:, only be redistributed. with any certainty, uniformly over thecorresponding drainage area.
.
I,We propose a method of balanced reconstruction of the different strata of a sedimentary basin that gives us access to spatial mass accumulation rates on a discretized grid, aver- aged over difcrent time intervals. We use this reconstruction together with the present-day topography to establish a general mass balance between the Tien Shan Range and the two basins. This Icads LIS to propose a simple model of the
evolution of the average elevation of the range during the
where z , and z2 are the upper and lower limits o f the stratum deposited during time interval A / = 12 ~ / I . This is the most pre- cise way to obtain M ( A t ) . Because knowledge of p ( : ) is often poor, one can derive the mass from a knowledge of the porosity.
From depth and porosity, one can obtain the grain volume (Gallagher 1989), which can be directly related t o the mass by the grain density p,(z) :
p,(z)[l ~ ( ~ ( z ) ] dz. ( 3 )
Cenozoic.
Figure 2 . ( a ) G i - a i i i densit) measurements compiled from ODP sites 717, 718 and 71YA showing a clear linear trend. Mean value of'grain density is JJ = 2.78 t 0.2 gcin
'.
( h ) Solidity curves f o r sandstones. normal shales and undercompacted shales from Baldwin & Butler (IYXS), and the average solidity curve ~ised in this study (eq. 5 ) . Thinner lines give uncertainties for the curves of Baldwin & Butler (1985); the shaded area shows theuncertainty envelope for the average solidity curve. -
Tectonics and topography in Central asia 3
The grain density is often considered to be constant,
p ,
as shown in Fig. 2(a), where density measurements from ODP sites 717, 718 and 719 (Cochran et al. 1989) show that for thesediments of the Bengal fan
p
= 2.78 k 0.14 x lo3 kg m-3 ( 2 0 ) ~ (3)very close to the widely accepted average value of 2.7 x lo3 kg m-3 (Baldwin & Butler 1985; Curray 1994) that we use in this study.
Unfortunately, most of the time neither of the two variables p ( z ) or o ( z ) is known. To solve this problem we have used the general solidity-depth curves [ S ( z ) = 1 - ~ ( z ) ] for shales, undercompacted shales and sandstones given by Baldwin & Butler (1985) with their respective uncertainty ranges:
for normal shale
for under compacted shale (4)
\
Sc(z) = 1 - 0 . 4 9 e x p ( Z ) for coarse sediments3700
and we have averaged these three curves with an exponential solidity-depth curve,
sg(~)
= 1 - 0.43 exp( -2-).
3014The uncertainty linked to any estimate of the thickness of the solid phase with this solidity-depth relationship is about
30 per cent (grey shade in Fig. 2b). Eq. (1) becomes
Mass accumulation along a cross-section M ( x , t )
Most of the maps we use in this study show isopachs only for long time intervals (e.g. Mesozoic or Cenozoic). In order to obtain a detailed estimate of mass transfers through time, it is necessary to refine the sedimentary record by incorporating a more accurate description of sedimentation with time. This can be accomplished with detailed stratigraphic columns, as given by drill holes. To study deposition in a given basin during the Neogene, we first calculate the thickness of Neogene sedi- ments, H ( x ) , for the entire basin by interpolation of local
thicknesses of Neogene sediments given by isopachs and drill- hole measurements. The next step is based on the hypothesis that relative thicknesses are uniform throughout the basin. Let us assume first that only one drill hole is available. Measurements at point xo indicate that the thicknesses of the N
layers accumulated during the Neogene are hi(xo),
i = 1, . . . , N,with
(7) where H(.xo) is the total thickness of Neogene sediments at
location -x0. Introducing the ratios
we assume that, at any location x in the basin,
hi(-x) = R i H ( . x ) , for i = 1 , . . .
,
N , (9)which means that relative thicknesses are uniform all over the basin (Fig. 3a). If M drill-hole measurements are available, we
divide the basin into M domains, according to a criterion of minimum distance to drill-hole sites. As before,
h , ( x ) = R , H ( . x ) , for i = 1,. . . , N a n d j = 1 ,... , M , (10) where H(.x) is again the total thickness of Neogene sediments,
R , are the relative thicknesses of the i = 1 , . . . , N layers
measured in drill holesj = 1,. . . , M (Fig. 3b), and h I I ( x ) is the thickness of the ith layer at the point x whose nearest drillsite is
j. Sharp discontinuities at boundaries of adjacent domains are
then smoothed out to ensure continuity of thickness (Fig. 3c). Given an average grain density, it is now possible to calculate the mass per unit area at each node of the grid that covers the basin, and hence, by integration over the basin area, the mass deposited in the entire basin.
Mass accumulation in a basin M ( x , y , t )
The 2-D generalization is straightforward, and we only give here the corresponding forms of eqs (7) to (10):
f o r i = 1 , . . . , N , hi( xo 1 yo R . - - H ( x o , y o ) ' h i ( x , y ) = R i H ( x , y ) , for i = 1 , . . . , N , hq(x,y) = R q H ( x , y ) , for i = 1 , . . . , N , a n d j = 1, . . . , M .
Eq. (14) gives the general formula for the reconstruction of N different stratigraphic layers provided the following are known: (1) the cumulative thickness of these layers everywhere in the depositional area; and (2) the exact stratigraphy at M
different points. The cumulative thickness is given by isopach data digitized and interpolated on a regular grid, thus our reconstruction has a maximum resolution given by the grid spacing. If we have one drill log at each grid point the problem is completely determined and the reconstruction defined. It is therefore clear that the precision of our reconstruction, for example the reconstruction of prograding strata in a foreland basin at our large (100 km2) scale of resolution, relies on the density and resolution of the drilling or cross-sectional data available. All steps of the calculation contribute to the uncertainty of the final result; to compensate for the possible scarcity of our data set we systematically maximize the uncer- tainties. Details are discussed in the Appendix.
A P P L I C A T I O N T O T H E T I E N S H A N
The area under investigation extends westwards of the Altyn Shan Mountains to the border between China and Kazakhstan (Fig. 1). Within this region, two great sedimentary basins, the Tarim and the Dzungar, are now deserts covered mostly by aeolian deposits. They collect most of the weathered material brought by the rivers incising the surrounding high mountains. TheTarim Basin extends from Kashgar in the west to the Altyn Mountains in the east and is bounded to the south by the Kunlun Mountains and the Tibetan Plateau. At its northerly limit is the southern piedmont of the Tien Shan Mountains.
The Tien Shan Mountain Belt extends from the western border of the Fergana Basin (Uzbekistan) to Mogoy east of the Turfan depression (Fig. 1). The mean elevation of the range lies
around 2500 m above sea level, with the highest peaks
4
F. Mktivier and Y. Gaudemeri Bachu (Flg4, N1)
I
Kuche a m (Flg4. NZ)! (78.5E 39.lN) (82.9E; 41.3N)
/
depth (m) Neogene ratios1
depth (m) Neogene ratiosculminating above 7000 m. Although the core of the mountain is very old and reflects a complex Palaeozoic history, the pre- sent-day topography of the range is recent and is clearly linked to the India-Asia collision (e.g. Tapponnier & Molnar 1979; Avouac et al. 1993). The northward motion of India induced a clockwise rotation of the old and stable Tarim block relative to Siberia and Dzungaria (Avouac 1991; Chen et al. 1991). The
onset of this Cenozoic rotation is still a matter of debate. The following dates have been proposed: around 16 Ma (Avouac et al. 1993), 24 Ma (Hendrix et ~1.1994) and 36 Ma (Windley et al. 1990; Allen et al. 1993). The amount of finite rotation is estimated to be of the order of 6" to 9" by Avouac et al. (1993) and Chen et al. (1991). This rotation induced a shortening of the order of 13 mma-' (Avouac & Tapponnier 1993) between the Tarim and Dzungar blocks that was accommodated by thrust systems on both sides of the Tien Shan, which were responsible for the building of the Cenozoic topography. Gravity anomalies (Burov et al. 1990) also attest to the flexural
loading of the Tarim and Dzungarian lithospheric plates as a result of the thrusting.
Some of the erosion products of the western side of the range are delivered to the Fergana Basin by the Syr Darya and Naryn rivers, whose drainage areas extend eastwards to 78"E long- itude (Fig. 1). To the North, the Ili River collects sediments from the southern flank of the Polouokenu Shan, northeast of the range, and carries its load to Balkach Basin (Sary Iiikotrau). In the same region, the Aksu and Karatal rivers collect sediments from the Dzungarskyi-Alatau mountains (Russia) and carry them to Balkach Lake. The northern flank of the Tien Shan is incised by short, parallel rivers rushing down from the high glaciers to discharge their sediments in the Dzungar Basin, sometimes as far as 200 km north of the mountain front, as in the case of the Manas He. Further north, Zaijan Lake (Izayan Basin) collects part of the sediments car- ried by the Kalaeerqisi He, which itself collects the loads of small mountainous rivers flowing down from Mongolia. To the east, the Aerhui He flows down to the arid Turfan Depression, which lies below sea level. To the south, the Tien Shan range is incised and eroded from west to east by the Kashigaer He, the Tuoshishgn He and the Akesu He (joining into the Talimu He), and the Kongqiao He to fill two of the main geological
Yalgalll (Fig 4, N3) Tamuhe Blmungsn (Flg4, N5) West Haahl (Flgl. NB) YMlng 1
(77 ?E, 38.9N) (76.7E, 38N) (75.43; 39.1N) (82.83; 40.3N)
depth (m) Neogene ratios depth (m) Neogene ratio. depth(m) nmgene ratio depth (m) Neogene rstiw
depocentres of the Tarim Basin, the Kucha Depression in the north and the West Hashi (Kashgar) Depression in the west.
0.31 i 300 0 23 0 35 425 0.09 0.23 1150 0.57 0 1 1275 0.09 14W 1675 2775 2825
The Tarim Basin
The Tarim Basin is a rhomb-shaped depression covering an area of about 560 000 km2 with an average elevation of 1200 m above present-day sea level (Fig. 4). It is bounded to the north by the southern piedmont of the Tien Shan, to the southwest by the Pamir and western Kunlun Mountains, and to the south- east by the Altyn Tagh left-lateral strike-slip fault (e.g. Tapponnier & Molnar 1979). The Precambrian basement of the basin is overlain by very thick sequences of marine and con- tinental sediments deposited continuously since the Sinian epoch (= 800 Ma) (e.g. Lee 1985a; Hendrix et al. 1992). The last
truly marine sediments (limestones) were deposited during the Palaeocene and Eocene in remnants of the Tethys Ocean (Dercourt, Ricou & Vrielynck 1993). From the Oligocene to the present, deposits are clearly detrital (Lee 1985a), whether they accumulated in shallow marine or lacustrine waters, as indi- cated by fossils (Jia et al. 1985). Coarser conglomerates appear
in the Miocene in the northern margin of the basin, and in the Pliocene in the southwestern depression.
The quantitative Neogene sedimentary history of the Tarim Basin is derived from six drill holes (Table la) (Jia et al. 1985) in
the major depressions of the basin and from Palaeogene and Neogene isopach maps (Fig. 4) (Lee 1985a). The sediments range from Palaeocene to Pliocene in age. From stratigraphic charts published by Wang, Nishidai & Coward (1992), we have computed the ratio of Quaternary (Pleistocene) to Neogene sediment thicknesses (Table Ib). Using this ratio and the method described above, we have extrapolated the thicknesses of Quaternary deposits to the entire basin. Unfortunately no distinction is made between Upper Oligocene (30-24 Ma) and Lower Miocene (24-17 Ma) in the data available. If we assume a constant deposition rate from 30 to 17 Ma (see above), pro- portions of Upper Oligocene and Lower Miocene sediments are approximately equal (Table la).
Using the average solidity-depth curve of eq.
(3,
we then calculated the volumes of the solid phase of the sediments for the following six time intervals: Palaeogene (66.4-23.7 Ma),1525 0.49 2800 0.61 750 0 43 1825 0.51 27W 0.38 4000 0.2G l l W 0.2 2325 0.1f 2950 0.08 4375 008 1600 0.29 2900 0.11 3075 0.04 4625 0.05 1750 0 08 3150 0.01 3200 4875 19w 1900 5675 3200 i 6225 2775 2600 ( a ) 5.31 625 11.2: 1325 16.6: 1800 24: m 30: 2200 36.6; m . 4 ; 2250 57.8 Stratigraphic data
(b) ~ r e a Kuche Area Norlh Central South Wwt South East
Thickseas of Pleistocene GW 360 0 1wO 1wo
Average thickness of Neogene 4080 3100 1990 3500 2240
Ratio Q/N 0 15 0.11 0 0.29 0.45
Tectonics and topography in Central asia 5 I 0 50 100 150 200 250 300 0 500 CI E Y u)
g
1000 Y 0 I- E _ _ _ _ _ 1500 (b) 1 I 0 50 100 156 200 250 300Boundary zone influenced by the two stratigraphic columns.
0 50 100 150 200 250 300
X-distance (km)
Figure 3 . (a) 2-D reconstruction of two sedimentary layers from one isopach and one drill hole. (b), (c) Same as in (a) for one isopach and two drill
holes, with smoothing of the transition zone. Variables are defined in the text.
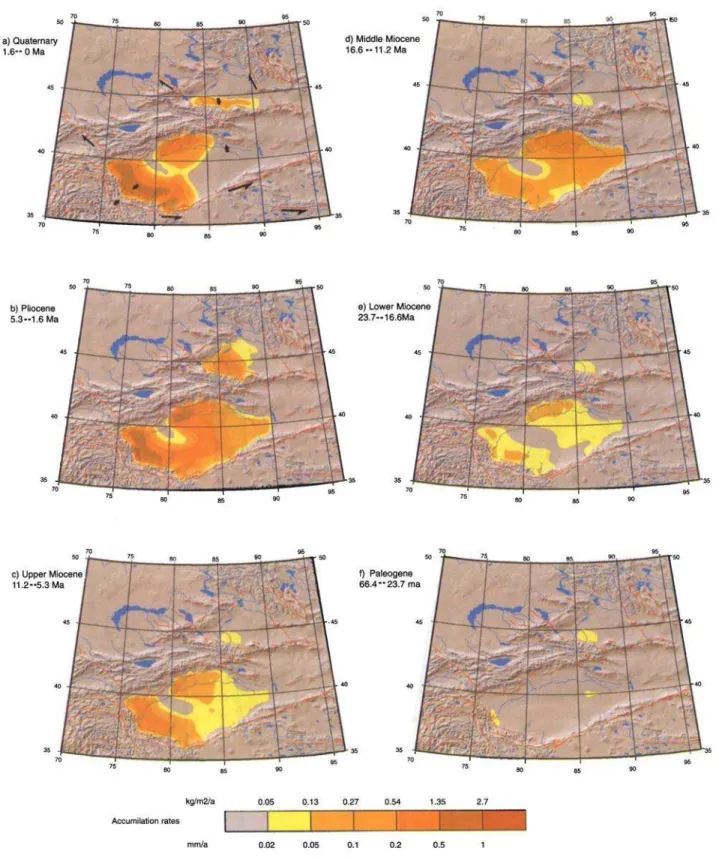
Lower Miocene (23.7-16.6 Ma), Middle Miocene (16.6- 11.2 Ma), Upper Miocene (11.2-5.3 Ma), Pliocene (5.3-1.6 Ma), and Quaternary (1.6-0 Ma) (Fig. 5). From these volumes, we derived corresponding accumulation rates in the Tarim Basin (Fig. 5).
The Dzungar Basin
The Dzungar Basin is a wedge-shaped basin covering an area of about 130 000 km2 (Fig. 1). It extends from latitudes 44"N to 46-30" and longitudes 84"30'E to 91"E. It is bounded to the south by the Tien Shan, to the north and east by the Altai and
to the west by the Dzungarskiy Alatau and the Tarbagatay mountains (Fig. 1). The sedimentary history of the Dzungar Basin apparently began much later than that of the Tarim basin. The basement is lower Palaeozoic in age and the sedi- ment fill dates back to the Carboniferous (Lee 1985b; Peng & Guojun 1989). The Carboniferous and Permian history seems to have involved shallow marine littoral conditions with some volcanic sediment input. The last remnants of marine facies were deposited during Early Permian times (Lee 1985b; Hendrix et al. 1992). The Variscan orogeny, which earlier affected the Tien Shan, led to the formation of a lacustrine
foredeep that became an area of continuous sedimentation
6 F Mdivier and Y. Gaudemer
Figure 4 . Map showing location, type and density of the data used in this study. References in text.
Figure 6 . Simplified cross-section of Dzungar Basin from Peng & Guojun (1989) and Avouac (1991). See Fig. 1 for location of section.
after the deposition of Triassic red beds (Lee 1985b). Palaeogene (Zimquazi, Anjihaihe and Lower Shawan forma- tions) and Neogene (Upper Shawan, Taxihe and Dushanzi formations) strata consist mostly of fine-grained mudstones and sandy mudstones. Pliocene deposits are much coarser, mostly lenticularly bedded conglomerates. Quaternary depos- its consist of alternating glacial moraines and interglacial detrital beds (e.g. Lee 1985b; Avouac et al. 1993).
The available data reduce to two maps and one cross-section (Figs 4 and 6). No drill-hole data are available in the published literature. The first map shows the total thickness of sediments that accumulated above the Palaeozoic basin basement (Sun & Leibo 1984). The second map (Zonghu 1990) gives the Quaternary sediment thicknesses. Both maps were digitized and interpolated to give two regular grids. A cross-section of the Dzungar Basin oriented approximately north-south
Table 2. Grain volumes ( lo3 km3), mass ( l O I 5 kg), and associated uncertainties, of sediments in the Tarim and Dzungar basins Age (first column)
corresponds to base of reconstructed formation.
Tarim Dzungar Entire basin 426 164 1150 222 86 159 42 241 86 320 124 864 01997 RAS, GJI 128,l-17
Tectonics and topography in Central asia 7 Tarim Tarim / (hi Hundnr r t d l Y Y d ) Wtndlu, Y I d 19% ) Wtndlu, Y I d 19% 50 45 40 35 30 25 20
i
5 15 10 Kuche area and North Tarim0
10 20 30 40 50 60 7
South-Westr (-from Kashgar to Hotien)
Figure 7. Mean accumulation rates (black lines) calculated from
reconstituted solid-phase thicknesses deposited in the Tarim and Dzungar basins. Rates are in 10' km3 Ma-' and represent linear grain volume accumulation rates in different depositional areas. Arrows indicate the onset of Cenozoic tectonics in the Tien Shan as inferred by several authors. Uncertainties are drawn as grey-shaded boxes. Rates were derived by surface integrals over the different depositional areas.
(Fig. 6) (Peng & Guojun 1989; Avouac et al. 1993) gives the latitudinal profile of the basin fill.
Rather imprecise estimates are obtained for the Dzungar Basin deposits because of this lack of a precise stratigraphy. From the overall geometry of the isopachs (Fig. 4), it seems reasonable to suggest that the basin has an axis of symmetry parallel to the cross-section (Fig. 6). This cross-section has been sampled every five minutes of arc to obtain local strati- graphic sequences that give the proportions of Palaeocene- Miocene and Pliocene deposits in the basin. In order to obtain the thickness of the solid phase, we used the average porosity- depth curve defined in eq. (5). The solid-phase stratigraphic data were extrapolated and combined with the base grids to derive the compacted volumes and corresponding accumula- tion rates during the Palaeocene-Miocene (66.4-5.3 Ma), the Pliocene (5.3-1.6 Ma), and the Quaternary (1.6-0 Ma) (Fig. 7).
Interpretation
Figs 5 and 7 and Table 2 summarize the sedimentary history of the Dzungar and Tarim basins since the early Cenozoic. South of the Tien Shan, the accumulation accelerated significantly between Palaeogene and Neogene times (Fig. 7), with maximum local accumulation rates increasing from x 0.15 mm a-' to almost 1 mm a-] (Figs 5e-0. The volumes involved also chan- ged markedly. A much greater volume (1084 & 410 x lo3 km3)
was deposited during the Neogene than during the previous 40 Ma (120 f 51 x lo3 km3) (Table 2). In the north, the deposition rate increased sharply during the middle Miocene. It then slowed down during the upper Miocene, before rising again during the Pliocene and Quaternary (Fig. 7). In the southwest, the evolution was steadier, with an exponential rise of accumulation between the lower Miocene and the Pliocene (Figs 5b-e and 7). Finally, accumulation rates experienced a sharp drop in the Quaternary in the depressions adjacent to the Tien Shan while they remained equivalent to the prevailing Pliocene rates in the southwest.
Because of the lack of a detailed stratigraphy, it is impossible to discern variations in accumulation rates during the Palaeogene and Miocene periods in the Dzungar Basin (Figs 5c-f and 7). The volume that accumulated ( I 18 It 34
x103 km3) during these x 61 Ma is less than three times the volume accumulated during the 3.7 Ma long Pliocene. It should be remembered, however, that a significant fraction of the 11 8 k 34 x lo3 km3 could have accumulated in a very short
period, at any time during the Palaeogene and Miocene.
As noted above, other smaller basins collect sediments from
the Tien Shan Mountains, east of 75OE (Fig. 1). The volumes that accumulated in these basins during the entire Cenozoic, are, however, much smaller (19 & 2 x lo3 km3 in the Balkach
Basin, 6.8 k 1.1 x lo3 km3 in the Izayan Basin) than those stored in the Tarim (z 1350 x lo3 km3) and Dzungar
(x 180 x lo3 km3) basins. We will thus neglect these areas in
future calculations. The Turfan Depression has certainly col- lected some of the sediments from the Tien Shan mountains since the beginning of the Cenozoic, but, because of a complete lack of quantitative data, we could not calculate the volume of sediments stored in it.
Middle Miocene pulse and onset of Cenozoic orogeny in the Tien Shan
The fact that the Middle Miocene sharp increase in accumu- lation rate in the Tarim Basin is restricted to the southern 01997 RAS, GJI 128,1-17
8 F. Mgtivierand Y. Gaudemer
piedmont of the Tien Shan (Kucha area) and coincides with the first appearance of conglomerates in the basin strongly sug- gests that it reflects the Cenozoic onset or reactivation of the Tien Shan orogeny. This is consistent with the 16
+
22/-9 Ma age inferred by Avouac et al. (1993) for this event by dividingthe estimated shortening (= 125 km in the East to 200 km in
the West) by the corresponding Holocene shortening rate (6-12 mma-').
From a study of fission-track data from sands collected on the northern front of the mountain, Hendrix et al. (1994) proposed that the onset of orogeny took place at 24
+
4 Ma, at the beginning of the Miocene, somewhat earlier than our estimate, but apparently consistent with the rise in accumu- lation rate at the beginning of the Miocene (Figs 5e and 7). As noted above, our data from the Dzungar Basin are too sparse to confirm this age. Because the middle Miocene pulse affec- ted only the northern part of the Tarim Basin, at the foot of the Tien Shan, it is likely to be related to an event that affected the corresponding drainage area, i.e. the eastern Tien Shan, in contrast to the early Miocene pulse, which affected the entire basin.However, as pointed out by Hendrix et aZ.(1994), dating continental stratigraphic units from endemic species is diffi- cult and the ages could be shifted 1 or 2 Myr either way. This would reduce the 3 to 4 Myr discrepancy between our two estimates. It could therefore be inferred that the onset of active tectonics in the eastern Tien Shan took place between 15 and 25 Ma. An alternative theory is that there were two pulses, reflecting either the onset of Cenozoic tectonics a t about 24 Ma with a rise in activity 7 to 8 Myr later, or a lower Miocene onset of the tectonic history in the northern Tien Shan followed by a Middle Miocene onset of the Cenozoic tectonics in the southern part of the range. We lack knowledge of the depositional timing of the 118 k 34 x lo3 km3 of sedi- ments deposited between 66.4 and 5.3 Ma in the Dzungar Basin (Fig. 7), so we are unable to differentiate between these scenarios.
From the presence of an unconformity at the base of the Oligocene (= 30-36 Ma) in the Turfan Depression (Fig. l), Windley et al. (1990) and Allen et al. (1993) proposed that
the onset of the Tien Shan orogeny was around 36 Ma. This unconformity is also present in the southwest
depression (Jia et al. 1985) 1000 km SW of the Turfan
Depression. Because the sedimentation pattern of that area is driven by erosion of the nearby Kunlun Mountains, this unconformity may reflect an event of broader extent than the formation of the Tien Shan. The facies in the Dzungar are continental, whereas shallow marine deposits occur
south of the range in Tarim. Low average accumulation
rates suggest an erosion event of limited intensity with little incision of the rivers in the surrounding relief. We therefore prefer to link this unconformity to eustatic variations (Haq, Hardenbol & Vail 1987, Fig. 2, p. 1159), which show a long- term decrease in sea level throughout the Oligocene and a major short-term fall at 30 Ma (the time at which the uncon- formity is recorded in the Tarim drill holes). At that time the old core of the Palaeozoic mountain must have been strongly
eroded-continental fluvial deposits accumulated in the
Dzungar from Mesozoic times onwards (Lee 1985b)-prob- ably leaving only subdued relief which could explain the influence of this sea-level drop on continental regions such as Dzungaria.
Pliocene pulse of sedimentation
The strongest sedimentary pulse that we were able to isolate took place during the Pliocene (5.3-1.6 Ma) (Figs 5b and 7). It affected all the main depositional areas of the Tarim and Dzungar basins. It therefore reflects a tectonic or climatic event that affected a region extending at least from the west Kunlun and Pamir mountains to the Tien Shan and Alatau mountains. Rea (1992) showed that a similar pulse is recorded in the sedi- ments of the northern Indian Ocean (between 2 and 4 Ma). This would suggest that this event has affected a huge area of eastern and central Asia.
Rea (1992) has also described a second pulse in accumula- tion rate in the Indian Ocean between 6 and 9 Ma, which we do not observe in our records. Note that Burbank, Derry & France-Lanord ( 1993), from magnetostratigraphic studies in Nepal and northern Pakistan, and analysis of two distal drill- sites in the Bengal fan (DSDP site 218 and ODP leg 116), sug- gested that the accumulation rate decreased after 8 Ma, in contradiction to Rea's (1992) interpretation. This disagree- ment clearly shows the need for a mass-balance calculation over the total depositional area to remove the uncertainty.
If a second pulse did occur, however, it must have affected an area of lesser extent than that of the Pliocene pulse. On the basis of biological data, Quade, Cerling & Bowman (1989) and Prell et al. (1992) proposed that the Asian monsoon developed between 7 and 8 Ma. Thus one of the two pulses observed by Rea (1992) could be due to a corresponding increase in pre- cipitation. However, in a meteorological survey of the Tibetan Plateau in 1979, Luo & Yanai (1983) demonstrated that the summer precipitation north of theTibetan Plateau is more than one order of magnitude less intense than that south of the Plateau. Annual precipitation (Fig. l), including snow, is still fourto five timesless overtheTienShanthansouthoftheTibetan Plateau. If this difference has prevailed since the onset of the monsoon, it should be seen in the sedimentation budget north and south of Tibet, if erosion were primarily driven by climate.
From our study, this does not seem to be the case for the Pliocene pulse, which therefore probably had a tectonic origin. By contrast, this does seem to be the case for the 6-9 Ma pulse in the Indian Ocean, which corresponds to a decrease in accu- mulation rate in the northern Tarim (Fig. 7). However, this decrease in accumulation rates does not appear in the south- west depression, where accumulation rates have risen since the beginning of the Neogene. This may reflect sustained incision of rivers in the nearby Kunlun Mountains, implying tectonic uplift in that region fast enough to counterbalance the effect of reduced precipitation and run-off. In contrast, the tectonic activity in the Tien Shan is not sufficient to mask the decrease in climate-induced erosion. One cannot exclude the possibility that the shortening rate decreased during that period.
Quaternary accumulation rates
Quaternary rates of accumulation appear to have decreased in the Tien Shan foreland. This may reflect an average decrease in shortening rates, which would act against the apparently high regional erosion rates accepted for mountains covered with glaciers (=l mma-'; see Bloom 1978, p. 393) supposing an average increase of the glacial cover of the Tien Shan. In con- trast, in the south of the Tarim the rates of accumulation are not significantly different from the Pliocene rates, suggesting 01997 RAS, GJZ 128,l-17
Figure 5 . Reconstituted accumulation rates of the Tarim and Dzungar basins for six different time intervals. Because of the lack of data a constant accumulation rate in Dzungar basin has been assumed between 66 and 5 Ma. Present-day active faults and perennial hydrography (see Fig.1 1 for references) have been drawn to allow comparisons.
Tectonics and topography in Central asia 9
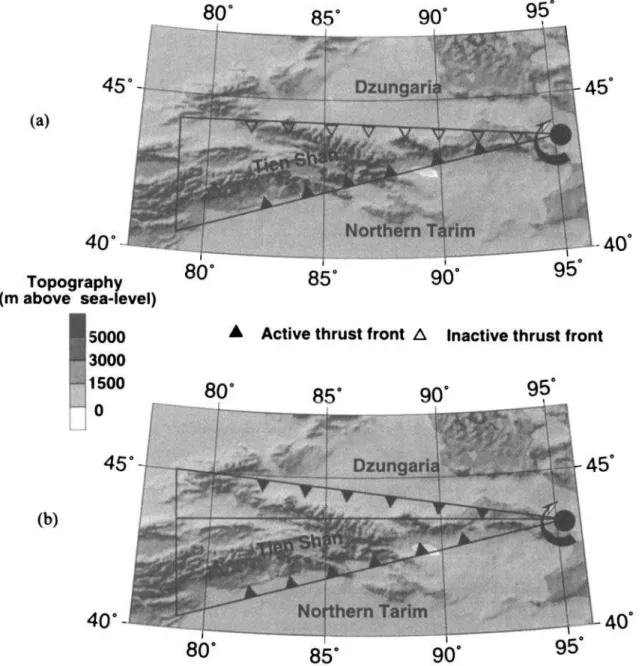
Figure 8 . N-S sketch of Tien Shan showing topography, active frontal thrusts and estimated thickness of the Dzungar and Tarim blocks. Thrust
angles are not conserved. Volume of shortening is derived assuming conservation of mass and local isostatic compensation of theTarim and Dzungar blocks and of the Tien Shan range
either sustained uplift of the nearby Kunlun Mountains or increased erosion linked with an average increase of the glacial cover. However, these results must be viewed with great cau- tion because the mass-estimation technique is an extrapolation and is therefore not balanced.
IMPLICATIONS FOR R E G I O N A L TECTONICS
The process of mountain building can be viewed, in its simplest form, as the balance between mass accumulating in a range by thrusting and crustal shortening, which can be considered an input flux, and mass draining away from the range by erosional processes, which can be considered an output flux. Using the mass deposited in the surrounding basins and the present-day topography of the range, it is possible to reconstruct the history of this topography through time. With several simplifying assumptions, one can then relate this history to the tectonic evolution of the Tien Shan. The first assumption is that there was no significant relief prior to the onset of shortening in the Tien Shan. This is justified by the very low accumulation rates recorded during the Palaeogene. The second assumption is that shortening started at x 16 Ma, as suggested by the sharp rise in
accumulation rate. A third assumption is to consider that all the material eroded from the Tien Shan was deposited in the Tarim and Dzungar basins (we have shown above that the volume of sediments stored in the other basins can indeed be neglected) and that there is no subduction of crustal material at depth.
Shortening in the Tien Shan
Avouac (1991) and Chen et al. (1991) proposed that the Tien Shan orogeny resulted from the clockwise rotation of Tarim relative to stable Siberia at a rate of 0.65 & 0.3" Ma-', around a pole located near 43.5"N and 95.7"E (Avouac & Tapponnier 1993). This rotation can be absorbed by a combination of shortening between the following two end-members (Fig. 8):
(1) shortening of the Tarim block only, in which case only (2) shortening of the Dzungar block, in which case only the the southern thrust zone has any significant activity;
northern thrust front accommodates the rotation process. It seems clear from tectonic studies of the region (e.g. Avouac
et al. 1993) that the real process lies between these two extremes. The deep structure of the range cannot be used to
10 F. Mitivier and Y. Gauderrier
constrain the exact mechanism as it is largely unknown. We will estimate the rotation of Tarim relative to stable Siberia in these two cases, assuming that both blocks and the Tien Shan are permanently in isostatic equilibrium, a good approximation as shown by Avouac et a / . (1993, Fig. 27).
Shortening of the Tarim block
The mean elevation of the range is N 2500 m, 1000 m above the
basin, over an area of 236 000 km2 east of 78 E. The maximum amount of shortening stored in the range and in the adjacent basins is equal to the volume of the topography above base level and its corresponding root, plus the volume of sediments. Taking crustal and mantle densities to be pc = 2700 kg mp3 and pm = 3300 kg m--3 respectively, the volume stored in the range (topography and root) calculated from the DCW data- base (Defense Mapping Agency 1992) is
Vr = 1.6 3~ 0.45 x lo6 km3. (15)
The 0.45 Y 1 O6 km3 uncertainty is calculated assuming 300 m of uncertainty in the DCW data. From Table 2, the amount of sediments being stored in the Dzungar and Kucha depressions is
V, = 0.44 3~ 0.17 x lo6 km3.
Vsh =
rTr
+
V, = 2.04*
0.62 X lo6 km3.(16)
(17) The total volume of shortening is then
Assuming a standard crustal thickness of 35 km, the mean ele- vation of Tarim, 1500 m, is compensated by a root of
1.5 x
leading to a total thickness of the Tarim plate of
= 8.25 km, (18)
3300 3300 - 2700
H , N 35
+
1.5+
8.25 = 44.75 km, (19) compatible with the 44-48 km inferred from gravity measure- ments(Ma 1989). If the E-W length of the range at the latitude of the rotation pole (43.5"N) is L (N 1200 km), the amount of finite rotation 0 necessary to achieve this shortening is related to the thickness of the crust H, byIn degrees, the rotation is B = 3.6
*
1.1 *. Because the Tarim was at sea level in the Palaeogene, the thickness of its crust must therefore have been less than 45 km during a significant part of the Neogene. Therefore, our estimate is a lower bound for the rotation of Tarim relative to Siberia. Furthermore, our computation of the volume of the mountain takes into account the topography created by the Palaeozoic core of the mountain and sediments, up to the folded Jurassic and Cretaceous fore- land strata. This may also account for the small differences between our results and the estimate of Avouac et al. (1993),which does not take these folded sediments into account.
Shorteningof the Dzungar block
The mean elevation of the Tien Shan is 2060 m above the
Dzungar Basin, the present-day elevation (x 500 m) of which
we take as the base level. The corresponding values of Vsh, H,
and 0 are
Vsh = 3.58 dz 0.62 X lo6 km3, (21)
H , = 38.25 km, (22)
0=7.4zt1.3". (23)
In this case we assume that all the volume of the range is the result of shortening of the plate underlying the Dzungar Basin.
Conclusion
Because the real scenario lies between the two end-members, we conclude that given the present-day geometry of eastern Tien Shan and the sedimentary history of the northern Tarim and Dzungar basins, assuming that the orogeny was activated or reactivated at around 16 Ma and assuming that the Tien Shan is in isostatic equilibrium, the volume of Cenozoic shortening stored in the Tien Shan is
1.15 >. lo6 km3
< Vsh
5 4.23 X lo6 km3, (24)and the angle of finite rotation of the Tarim block relative to Siberia since N 16 Ma is
2.50
.=
e
5 8.70.This last result is consistent with the results of Chen et al.
(1991) ( 8 . 6 ~ t 8 . 9 " ) and Avouac et al. (1993) (7*2.5").
However, if some crust has been subducted beneath the range, the amount of rotation necessary to achieve the same short- ening is larger. It is impossible to know at this point whether the rotation rate was constant over this period, as supposed by Avouac et al. (1993). or has experienced variations since the
onset of shortening, as could be inferred from the depositional record in the Kucha Depression during the Cenozoic. However, the onset of shortening in the Tien Shan (16
+
22/-9 Ma) that was calculated by Avouac et al. (1993) by dividing the finite shortening by the Holocene rate along active thrust faults is in agreement with our interpretation of the sedimentary record. This suggests that the extrapolation of Holocene slip rates on frontal thrusts in the Tien Shan to a much longer time span is reasonable. Therefore we will assume a constant rota- tion rate below.( 2 5 )
Estimates of the mean palaeotopography of the range Having calculated the finite shortening that resulted in the present-day topography of the Tien Shan, and the total volume of erosion during different time intervals, we can calculate the volumetric growth of the range. Assuming local isostasy, eqs (17) and (21) give the minimum and maximum volumes of convergence that can be stored in the Tien Shan. From these volumes one can derive a mean value for the convergence in terms of volume incorporated into the topography per unit time. From the volume defined by eq. (17), the mean volumetric rate of convergence absorbed in the range is
where At is the duration of the mountain building. From the volume of rocks that were deposited in the adjacent foreland basins, one can derive for each of the epochs listed in Table 2 a mean rate of erosion dV,/dt, i.e. of rocks being removed from the range by erosion, in the same way that we calcu- lated :he rate of convergence. The mean variation of the
Tectonics and topography in Central asia 11
Figure 9. ( a ) Topography o f Tien Shan overlain by a single pyramid-like volume used to approximate its shape and reconstitute the average palaeoelevation of the range. (b) Sketch showing variables defining a pyramid-like shape. Self-similar growth implies the H / W ratio remains con-
stant, i.e. the slope c i of topography perpendicular to L is conserved. Mathematical relationships are given in the text.
volume of the mountain range per unit time for each time interval is thus
where the term in brackets represents the partitioning between the volume absorbed in the root and the volume absorbed in the range itself ( C = 1 for local isostasy and C = 0 for an infinitely rigid supporting plate). Because we know the erosion rates over six different periods, dVe,,/dt, i = 1 , .
. . ,6, we
can obtain the six constant rates of volumetric growth dP;/dt, i = 1 , . . . , 6 of the Tien Shan:- I dP'i
x=
( y - T ) [ l + C A ] dVc db' , i = 1, . . . , 6. (28)P m - P c
Growth of topography
Model I : similar growth of a single pyramidlike topography From the volumetric growth of the range, it is possible to derive an estimate of the surface and mean height growth of the range. To do this we assume that the geometry of the Tien Shan is pyramidal, as shown in Figs 9 and 10(a). The northern limit of the range is kept fixed and of constant east-west length L. The
growth of the mountain is southward-vergent, i.e. only the southern thrust front is active. Most importantly we assume for simplification that during the growth of the mountain the slope angle a is conserved (Fig. 9). Using this simplification, it is possible to derive an analytical solution for the volume and basal surface of the range. We first consider the surface varia- tion of a small triangular section of a pyramid-like mountain (Fig. 9b). The width of the triangle is
w = Itan0 (29)
(30)
(31) and its height is
h = wtana = 1 tan0 tana.
Differentiating eq. (29) with respect to 6 and w, we get
dw = / ( I
+
tan' e ) d @The cross-sectional surface variation dS (Fig. 9) is then ( 3 3
1
1
1
= 7. [(w
+
du,)2 - w~ tan a = wtan adwto first order in dw. Replacing MI and dw according to eqs (29) and (3 1 ) gives
dS = wdw tan a = 1' tan 0( 1
+
tan2 0) tan ado. (33) By integration of dS over t on the left-hand side and 0 on the 01997 RAS, GJI 128,l-I712 F Mgtivier and Y. Gaudemer
Figure 10. Digital elevation model of Tien Shan regions (NW China) from DCW database (Defense Mapping Agency 1992) showing the two
models used to reconstruct the mean palaeotopography of the Tien Shan since the beginning of the Tertiary. (a) Model 1 assumes all convergence is accommodated by underthrusting of Tarim crust beneath Tien Shan. (b) Model 2 assumes convergence is accommodated by southern and northern thrust zones.
right-hand side, we get
I d s = 12(tan2 0 - tan2 0,) tancc.
By integration over I , we finally ot
of the pyramidal range,
ain the volume
which leads to tan2 00
+
-f
3 g d t . L3tana dt (34) ric variation (35) ( 3 6 )The basal surface of the range can be estimated as
L2 tan 0
2 ’
s b = ~
and from eq. (36)
(37)
Finally the mean elevation of the range is
V ‘ d V ( 3 9 )
( H ) = - =
J‘
- dt ( S ; ,+
-s b 0 dt
Using the calculations in the previous section, the volume
Tectonics and topography in Central asia 13
0.5'
Topography resulting from shortening
-1
- - - - of the Tarirn block(b) - Dzungar reference level
10 20 30 40 50 60 70
-
Mean topography of the Tien ShanTopography resulting from shortening of the Tarim block
Dzuncar block
'\ - T ~ ~re;ititipfg ~ from sliartonin ~ r a ~ ~ ~
1 . 2 - ,
-
Mean topography of the Tien Shan_ _ _ _
Topography resulting from shortening of the0.2
0'4i
't
_ _ _ _ _ - - -a _ - - - --
OO 10 20 30 40 50 60 70
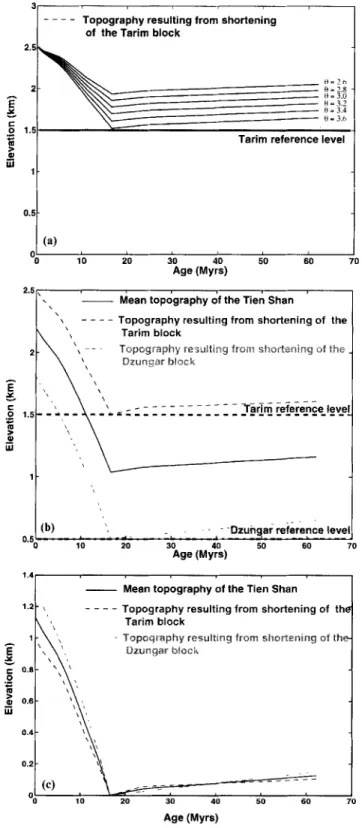
Figure 1 1. Reconstruction of average palaeotopography of Tien Shan since the beginning of the Tertiary. (a) First model, assuming that
the topography of the Tien Shan is made by shortening of the Tarim block corresponding to a clockwise rotation of Tarim relative to Siberia (2.6" I 0 5 3.6"). (b) and (c) Topography of range results from short-
ening of both the Tarim and the Dzungar blocks. Shortening of Tarim corresponds to a 2.46" clockwise rotation of Tarim relative to Siberia while the latter corresponds to a 2.36" clockwise rotation of Tarim relative to Siberia. Total rotation is of 4.82". In cases (a) and (b) the reference level is the present-day sea level; in case (c) calculated eleva-
tions are relative to Tarim (1500 m) and Dzungar (500 m) reference levels.
variation of the range reduces to
d V ,
v
= ( t - to,$)-
,
dtwhere d v / d t is the constant variation over time of the volumes calculated previously for a geological interval starting at time
to,i. Table 3 gives the volume, basal surface area and the angle of rotation that can be accommodated by the pyramid defined. Table 4 gives the rates of volume input (convergence) and output (erosion) for the range. Fig. l l ( a ) shows the resulting curve for different values of the angle of rotation of the Tarim block relative to Siberia since 16 Ma. The highest value of rotation corresponds to the case where all the volume of the mountain is used to accommodate the convergence. Lower rotation angles indicate pre-existing relief at the beginning of the Tertiary orogeny (16.6 Ma). Prior to that time the only process taking place was the peneplanation of the existing low relief.
Modef 2: self-similar growth of two pyramid-like
subtopographies
In this less crude model (Fig. lob), we assume that both of the thrust zones have been active since the beginning of the oro- geny. Furthermore, we assume that they behave in the same way but independently, that is, the growth of the northern part of the Tien Shan is not influenced by the growth of the southern part. The north-south limit between the two subranges is around 43.5"N, as before. In this case, the base levels are dif- ferent, leading to greater volumes arid greater angles of rota- tion. Part of the rotation of the Tarim relative to stable Siberia is accommodated by northward underthrusting of the Tarim plate, the rest being accommodated by southward under- thrusting of the Dzungar plate. The equations involved are basically the same; only the boundary conditions such as actual volumes and surfaces and erosion rates are different. Table 3 gives the volume, basal surface area and the angle of rotation that can be accommodated by the two subpyramids defined. Table 4 gives the rates of volume input and output for the two subranges. Figs ll(b,c) shows the resulting palaeo- topography for the whole range and its two subparts, assuming that all the topography results from shortening of the Tarim and Dzungar blocks.
Reconstitution of palaeoelevation
The three sets of curves in Fig. 11 show the mean elevation of the modelled topographies above different base levels for the two geometries defined above. Although strongly dependent on the rotation and on the partitioning of the shortening between the northern and the southern fronts, the elevation curves have a similar shape. The topography remains subdued from 60 to 16 Ma, and then rises sharply after the onset of shortening (Fig. 11).
The overall curve shapes are similar, depending strongly on the rotation parameters, suggesting the importance of the tec- tonic model used to estimate palaeoelevations in the calcula- tions. The curves may be divided into two subsets, defined by the absence or existence of a tectonic process. The first, extending from the Palaeogene until the end of the Lower Miocene, is that of a peneplained topography. The second, after the onset of convergence of the Tarim and/or Dzungar
Parameters
Base level elevation (m above psl)
Length (km)
B d surface (km2) North south slope
... ... ... ... .. . .. . . .. . . .. . .
Volume of topography (km3)
angle of rotation absorbed (degrees)
Model-l Model-2
Tien Shan N Tien Shan S Tien Shan
1500 500 1500 1200 1200 1200 236 125 158 7.47 163 157 0.01 0.02 0.01 3.6 2.36 2.46 . . . .. ... . . . ... . 1 6-0 5 5 - 1 6 11 2 - 4 3 16.6-11.2 23.7--lG.G M.4--23 7 Northern Pyramid Time period
(W) Convergence rate Eroslon rate Growih of the Convergence reto Erosion rate Growth of the
topography i topography 131 18 18 2 131 35 13.7 131 9 17 4 131 28 14 G 0 5 -0.8 n 1 -n 1 Southern Pyramid
Convergence rate Eroelon rate Growth of the topography
Rales are I" thousands of r h c k m
block, shows rapid uplift of the Tien Shan, barely affected by erosion. Thus tectonics clearly overrides erosion in our model of the Tien Shan palaeotopography.
The decrease in uplift rate of the topography during the Pliocene (Fig. 11) has two possible explanations. The first and more straightforward one is that it resulted from our assump- tion of a constant rotation rate of Tarim relative to Siberia since 16 Ma, although the direct analysis of the sedimentation record led us to propose a rise in tectonic activity at that time. It should then be considered as an artefact of our model. The second explanation is a climate-induced change in erosion, which would imply that the present-day climate system around the Tibetan Plateau described by Luo & Yanai (1983) was not established at that time.
However, the models we used to estimate the palaeoeleva- tion of the Tien Shan since around 16.6 Ma rely on a certain number of simplifying assumptions: (1) our model assumes continuous local isostatic compensation through time; (2) the hypothesis of self-similar growth of a pyramid-like topography implies a constant topographic slope and does not address the deep structure and processes of the range; and (3) the pyramid- like model does not respect the present-day drainage divide. For instance, the northern pyramid of the Tien Shan model in fact includes the area that is drained towards the Dzungar Basin, and also part of the area drained towards the Balkach Lake.
We furthermore suppose that there is no mass loss at depth. The second and more elaborate model assumes the northern and southern parts of the range underwent independent his- tories throughout a 17 Myr period. Bearing this in mind, our results (Fig. 11) suggest a geological history dominated by peneplanation of small mountainous highs (relative to the local base levels) until the onset of the orogeny at 16.6 Ma. Since then the history of the range has been totally controlled by tectonics, particularly by the shortening of the Tarim and Dzungar blocks.
Even though the erosion process has no real impact except for the Pliocene as discussed above, the large difference in volumes accumulated north and south of the range during the Cenozoic (Table 1) may be indicative of diachronous activity between the northern and southern fronts, possibly inducing
4 9 9 13 8.8 2 10 2 2 10 2 2 -a 3 2 -n 3 88 I8 10 1 88 35 7 6 88 9 1 1 3 88 28 8 5 0 5 -n 8 n 1 -0 1
strong variations in the drainage divide during the Cenozoic. In our reconstruction we defined three reference levels (or base levels): one for the Dzungar block and one for the Tarim block, which were used for the reconstruction, and the present-day sea level, which we used in order to represent the results graphically. Because the first two reference levels are moving frames of reference-we know the palaeoelevation curve of neither the
Dzungar nor the Tarim block-we cannot relate these
palaeoelevation curves to the eustatic sea-level variations. Our reconstruction thus leaves out the question of the impact of these variations on topography during the Cenozoic era. C O N C L U S I O N S
By establishing a mass balance between the Tien Shan ( N W China) and two of its adjacent basins since the beginning of the Cenozoic, we have reconstructed the depositional history of the Tarim and Dzungar basins, which collect the material eroded from the eastern part of the range. This balance, toge- ther with the estimate of the present-day mass stored in the range, helped us to show that :
(1) the onset of shortening in the Tien Shan was around 16
(2) the minimum amount of Cenozoic rotation of the Tarim
Ma;
block relative to stable Siberia is between 2.5" and 8.7". These two results agree with those of Avouac et al. (1993)
who used an independent method. In particular, the hypothesis of a constant rate of shortening seems consistent with our conclusions. Therefore, sharp and local variations in accumu- lation rates during an orogeny would find their origin in either sharp climatic variations restricted to the drainage area, for which no precise and quantitative description is available, or a very high sensitivity of erosion to slight changes in uplift rates in the drainage basin.
From a simple geometrical model of mountain building, we suggest that the average elevation of the Tien Shan range has increased since the onset of shortening. This increase does not seem to be affected by erosion except during the Pliocene, when the topographic growth slowed.
Tectonics and topography in Central asia 15
Finally, the comparison of o u r results with those o f Avouac
et al. (1993) suggests t h a t Holocene slip rates estimated on
crustal scale thrusts in the Tien Shan can be extrapolated on
long time spans ( m o r e t h a n 10 Myr). This in t u r n suggests t h a t the establishment o f such crustal-scale ramps was very rapid
relative to the duration of the orogeny and t h a t the slip rate on
such faults has remained constant ever since.
On a larger scale, Tapponnier, Peltzer & Armijo (1986) fol-
lowed by Le Pichon, Fournier & Jolivet (1992) published the
first attempts t o m a k e a complete balance o f mass transfer in
Asia since collision time. Although offirst order, these estimates nevertheless stressed the importance and the need o f mass-bal-
ance analysis to derive boundary conditions and constrain the
mechanics o f mountain building. I t is even more i m p o r t a n t t o d o this in regions such as the Himalayas where conflicting data sets ( R e a 1992; Burbank et al. 1993; S c h u m m & Rea 1995) have been used t o derive general conclusions regarding tectonic a n d /
or climatic pulses affecting the Himalayan orogeny. It is also
important t o perform these estimates in terms of a conservative,
hence comparable f r o m site to site, variable such as mass or
volume o f the solid phase (Gallagher 1989; Rea 1992; C u r r a y 1994).
ACKNOWLEDGMENTS
We acknowledge discussions with B. Meyer a n d P. Tapponnier.
J. P. Avouac, W. W. Hay and D. K. Rea a r e acknowledged for
constructive reviews. This is IPGP contribution 1439 and
INSU DBT Fleuves et Erosion Program contribution 763.
M a s s accumulation rates for the t a r i m a n d D z u n g a r basins are
available a t http: //u~ww. ipgp.jussieu. fr/depts/tecto. html
REFERENCES
Allen, M., Windley, B., Chi, Z. & Jinghui, G., 1993. Evolution of the Turfan basin, Chinese Central Asia, Tectonics., 12, 889-896. Armijo, R., Tapponnier, P., Mercier, J.-L. & Tonglin, H., 1986.
Quaternary extension in southern Tibet: field observations and tectonic implications, J. geophys. Res., 91, 13 803-13 872. Armijo, R., Tapponnier, P. & Tonglin, H., 1989. Late Cenozoic right-
lateral strike-slip faulting in southern Tibet, J. geophys. Res., 94,
2787--2838.
Avouac, J.-P., 1991. Application des methodes de morphologie quan- titative la neotectonique. Modele cinematique des deformations actives en Asie Central, These de Doctorat, Universite de Paris VII, France.
Avouac, J.-P. & Tapponnier, P., 1993. Kinematic model of active deformation in Central Asia, Geophys. Res . Lett., 20, 895-898.
Avouac, J.-P., Tapponnier, P., Bai, M., You, H. & Wang, G., 1993. Active thrusting and folding along the northern Tien Shan and late Cenozoic rotation of the Tarim relative to Dzungaria and Kazakhstan, J. geophys. Rex, 98,6755-6804.
Baldwin, B. & Butler, C.O., 1985. Compaction curves,
Am. Assoc. Pet. Geol. Bull.. 69,622-626.
Bloom, A.L., 1978. Geomorphology, Prentice-Hall, Englewood Cliffs, NJ.
Burbank, D.W., Derry, L A . & France-Lanord, C., 1993. Reduced Himalayan sediment production 8 Myr ago despite an intensified monsoon, Nature., 364,48-50.
Burov, E., Kogan, M., Lyon-Caen, H. & Molnar, P., 1990. Gravity anomalies the deep structure and dynamic processes beneath the Tien Shan, Earth. planet. Sci. Lett., 96, 367-383.
Chen, Y. et al. 1991. Paleomagnetic study of Mesozoic continental
sediments along the northern Tien Shan (China) and heterogeneous strain in Central Asia, J. geophys. Res., 96,40654082.
Cochran, J. et al., 1989. Proc. ODP, Znit. Repts., 116 ; College Station, TX.
Curray, J.R., 1994. Sediment volume and mass beneath the Bay of Bengal, Earth. planet. Sci. Lett., 125, 371-383.
Defense Mapping Agency, 1992. Digital Chart of the World, Fairfax, USA.
Dercourt, J., Ricou, L.-E. & Vrielyiick, B. (eds), 1993. Atlas Tethys
Paleoenvironmental Maps, Gauthier-Villars, Paris.
Gallagher, K., 1989. An examination of some uncertainties associated with estimates of sedimentation rates and tectonic subsidence,
Basin Research, 2, 97-1 14.
Gaudemer, Y., Tapponnier, P., Meyer, B., Peltzer, G., Guo, S.M., Chen, Z.T., Dai, H.G. & Cifuentes, I., 1995. Partitioning of crustal slip between linked active faults in the Eastern Qilian Shan, and evidence for a major seismic gap, the Tianzhu gap, on the Western Haiyuan fault, Gansu (China), Geophys. J. Znt., 120, 599-645.
Geographic maps of China, 1984. Dituchubanshi, Beijing, China. Hanks, T.C., Bucknam, R.C., LaJoie, K.R. & Wallace, R.E., 1984.
Modification of wavecut and faulting-controlled landforms,
J. geophys. Res., 89,5771-5790.
Haq, B.U., Hardenbol, J. & Vail, P.R., 1987. Chronology of fluctuating sea levels since the Triassic, Science, 235, 1156-1 167.
Hay, W., Shaw, C. & Wold, C., 1989. Mass-balanced paleogeographic reconstructions, Geologisrhe Rundschau, 78, 207-242.
Hendrix, M., Graham, S., Carroll, A,, Sobel, E., McKnight, C., Schulein, B. & Wang, Z., 1992. Sedimentary record and climatic implications of recurrent deformation in the Tian Shan: Evidence from Mesozoic strata of the north Tarim, south Dzungar, and Turpan basin, northwest China, 104, 53-79.
Hendrix, M., Damitru, T. & Graham, S., 1994. Late Oligocene-early Miocene unroofing in the Chinese Tian Shan : An early effect of the India-Asia collision, Geology., 22, 487490.
Jia, R., Huang, Y., Ye, D. & Zhong, H., 1985. Talimu Basin, in ESCAP Atlas of Statigraphy IV : People:r Republic of China, 75-81, United Nations, Stratigraphic Correlation Between Sedimentary Basinsof the
ESCAPRegion, Vol. X; Mineral Resources Development Series 52. Kidd, W. & Molnar, P., 1988. Quaternary and active faulting observed
on the 1985 Academia Sinica-Royal Geotraverse of Tibet, Phil.
Trans. R. Soc. London, A, 321,337-363.
Lee, K., 1985a. Geology of the Tarim Basin with special emphasis on petroleum deposits, Xinjiang Uygur Zizhiqu, Northwest China,
USGS 85-616, US Geological Survey.
Lee, K., 1985b. Geology of the Petroleum and coal deposits in the Junggar (Zhungaer) basin, Xinjiang Uygur Zizhiqu, Northwest China, USGS 85-230, US Geological Survey.
Le Pichon, X., Fournier, M. & Jolivet, L., 1992. Kinematics, topo- graphy, shortening and extrusion in the India-Eurasia collision,
Tectonics., 11, 1085-1098.
Luo, H. & Yanai, M., 1983. The large-scale circulation and heat sources over the Tibetan Plateau and surrounding areas during the early summer of 1979. Part I: precipitation and kinematic analysis,
Monthly Weather Review, 111, 922-944.
Ma, X. (ed.), 1989. Lithospheric Dynamics Atlas of China, China Cartographic Publishing House, Beijing.
Meyer, B., 1991. Mecanismes des grands tremblements de terre et du raccourcissement crustal oblique au bord nord-est du Tibet, These
de Doctorat, Universitk de Paris VII, France.
Molnar, P. & Tapponnier, P., 1978. Active tectonics of Tibet,
J. geophys. Res., 83, 5361-5375.
Peng, X. & Guojun, Z., 1989. Tectonic features of the Dzungar basin and their relationship with oil and gas distribution, in Chinese
Sedimentary Basins, Sedimentary Basins of the World I , pp.17-31,
ed. HSU, K., Elsevier, the Netherlands.
Prell, W.L., Murray, D.W., Clemens, S.C. & Anderson, D.M., 1992. Evolution and variability of the lndian Ocean summer monsoon : (01997 RAS, GJI 128.1-17