HAL Id: hal-02870645
https://hal.archives-ouvertes.fr/hal-02870645
Submitted on 16 Jun 2020
HAL is a multi-disciplinary open access
archive for the deposit and dissemination of
sci-entific research documents, whether they are
pub-lished or not. The documents may come from
teaching and research institutions in France or
abroad, or from public or private research centers.
L’archive ouverte pluridisciplinaire HAL, est
destinée au dépôt et à la diffusion de documents
scientifiques de niveau recherche, publiés ou non,
émanant des établissements d’enseignement et de
recherche français ou étrangers, des laboratoires
publics ou privés.
A new data set of soil mineralogy for dust-cycle
modeling
E. Journet, Yves Balkanski, S Harrison
To cite this version:
E. Journet, Yves Balkanski, S Harrison. A new data set of soil mineralogy for dust-cycle
model-ing. Atmospheric Chemistry and Physics, European Geosciences Union, 2014, 14 (8), pp.3801-3816.
�10.5194/acp-14-3801-2014�. �hal-02870645�
www.atmos-chem-phys.net/14/3801/2014/ doi:10.5194/acp-14-3801-2014
© Author(s) 2014. CC Attribution 3.0 License.
Atmospheric
Chemistry
and Physics
A new data set of soil mineralogy for dust-cycle modeling
E. Journet1,2, Y. Balkanski3, and S. P. Harrison1,4,5
1School of Geographical Sciences, University of Bristol, Bristol, BS8 1SS, UK
2LISA, CNRS – UMR7583, Université Paris-Est Créteil, Université Paris Diderot, Créteil, France
3LSCE, CNRS – UMR8212, CEA, Université de Versailles Saint-Quentin, Gif sur Yvette, France
4Department of Biological Sciences, Macquarie University, North Ryde, NSW 2109, Australia
5Geography & Environmental Sciences, School of Human and Environmental Sciences, Reading University,
Whiteknights, Reading, UK
Correspondence to: E. Journet ([email protected])
Received: 7 June 2013 – Published in Atmos. Chem. Phys. Discuss.: 11 September 2013 Revised: 7 February 2014 – Accepted: 5 March 2014 – Published: 16 April 2014
Abstract. The mineralogy of airborne dust affects the impact of dust particles on direct and indirect radiative forcing, on atmospheric chemistry and on biogeochemical cycling. It is determined partly by the mineralogy of the dust-source re-gions and partly by size-dependent fractionation during ero-sion and transport. Here we present a data set that charac-terizes the clay and silt-sized fractions of global soil units in terms of the abundance of 12 minerals that are important for dust–climate interactions: quartz, feldspars, illite, smec-tite, kaolinite, chlorite, vermiculite, mica, calcite, gypsum, hematite and goethite. The basic mineralogical information is derived from the literature, and is then expanded following explicit rules, in order to characterize as many soil units as possible. We present three alternative realizations of the min-eralogical maps, taking the uncertainties in the minmin-eralogical data into account. We examine the implications of the new database for calculations of the single scattering albedo of airborne dust and thus for dust radiative forcing.
1 Introduction
Dust particles, emitted in large quantities by aeolian erosion of arid and semi-arid soils, play an important role on Earth’s climate system. During atmospheric transport, they affect Earth’s radiative budget directly by absorbing or scattering the solar or infrared radiation (Sokolik and Toon, 1996) or indirectly by acting as cloud condensation nuclei (CCN) or ice nuclei (IN) (Rosenfeld et al., 2001; DeMott et al., 2003; Creamean et al., 2013). Dust also plays a role in atmospheric
chemistry (Cwiertny et al., 2008b). Mineral dust deposi-tion to the ocean affects marine biochemistry (Jickells et al., 2005) by increasing the supply of micronutrient iron with implications for the CO2budget (Martin et al., 1991).
Min-eral dust may also fertilize terrestrial ecosystems (Okin et al., 2004), particularly in areas such as the Amazon Basin (Swap et al., 1992).
Dust particles are a complex assemblage of various min-erals with physicochemical properties that vary widely from one mineral to another. All of the interactions between min-eral dust and climate are influenced by the physicochemical properties of the dust particles. Different minerals have dif-ferent optical properties and thus an accurate specification of mineralogy is necessary to calculate the direct radiative effect of mineral dust. Sokolik and Toon (1996), were the first to suggest incorporating the mineralogical composition of dust particles into models and subsequent work has shown the importance of accounting for mineralogy in estimating the direct radiative effect (Claquin et al., 1999; Sokolik and Toon, 1999; Balkanski et al., 2007; Hansell et al., 2008). Mineralogy also affects the hygroscopic properties of atmo-spheric particles and thus the indirect radiative forcing by dust. Feldspar minerals, which are a relatively minor com-ponent of mineral dust, are highly effective in ice nucleation (e.g., Atkinson et al., 2013). CCN are generally soluble ma-terials and mineral dust aerosols are generally assumed to be nonhygroscopic. However, the conversion of insoluble salts to more soluble compounds through heterogeneous and mul-tiphase reactions, which are highly dependent on the mineral-ogy of the particles (Kelly et al., 2007), is thought to increase
3802 E. Journet et al.: A new data set of soil mineralogy for dust-cycle modeling the CCN activity of dust (e.g., Levin et al., 1996). Similarly,
the reactivity of dust to gases is also dependent on mineral-ogy (Usher et al., 2003: Krueger et al., 2004). Mineralmineral-ogy, and in particular the amount and solubility of iron, is key to the impact of dust on marine biogeochemistry (see e.g., Journet et al., 2008; Cwiertny et al., 2008a; Schroth et al., 2009). Iron solubility is highly dependent on its mineralogi-cal form: iron in the structure of clay minerals such as illite or smectite is almost 100 times more soluble than iron oxide minerals such as hematite or goethite (Journet et al., 2008).
The mineralogy of airborne dust is linked to the miner-alogy of the erodible fraction of the soil source, although modified by size fractionation during erosion, suspension and transport. Information on the size-resolved mineralogi-cal composition of potential dust sources would significantly improve our ability to predict the mineralogical composition of dust at a global scale. Previous attempts to characterize source-area mineralogy (e.g., Claquin et al., 1999; Nickovic et al., 2012) have focused on soil mineralogy in arid and semi-arid areas. Given that dust-source regions are likely to change in the future (e.g., Mahowald and Luo, 2003; Tegen et al., 2004; Woodward et al., 2005), as indeed they have in the past (e.g., Mahowald et al., 1999; Werner et al., 2002; Takemura et al., 2009), mineralogical information has to be available globally (i.e., not simply for modern-day source regions). Here, we present a new database, created using a similar approach to Claquin et al. (1999) and Nickovic et al. (2012), which describes the size-resolved mineralogical composition of the erodible fraction of soils for most regions of the globe. We then examine some of the consequences of using this database to specify the properties of airborne dust.
2 Construction of the database
The database contains information of the relative abundance of 12 minerals: quartz, feldspars, illite, smectite, kaolinite, chlorite, vermiculite, mica, calcite, gypsum, hematite and goethite. This is an expanded set of minerals compared to the Claquin et al. (1999) and Nickovic et al. (2012) com-pilations. We first estimate the distribution of these miner-als in different size classes, including characterizing the iron species in the clay fraction. We then determine the average size-resolved mineralogical composition for each soil unit of the FAO (The Food and Agriculture Organization of the United Nations) soil classification (FAO, 1990a).
2.1 Distribution of minerals by size class
The mineralogical composition of airborne dust depends on both the mineralogy of the soil source and size fractionation during emission and transport. Only the smallest soil parti-cles are light enough to stay in suspension in the atmosphere and to be transported long distances. To be able to account for these fractionation effects, we specify the mineralogical
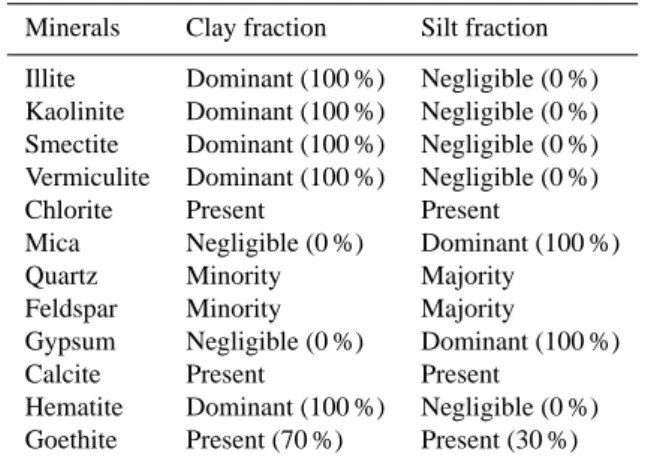
Table 1. Distribution of the selected minerals in the clay and silt fraction of soils.
Minerals Clay fraction Silt fraction Illite Dominant (100 %) Negligible (0 %) Kaolinite Dominant (100 %) Negligible (0 %) Smectite Dominant (100 %) Negligible (0 %) Vermiculite Dominant (100 %) Negligible (0 %) Chlorite Present Present
Mica Negligible (0 %) Dominant (100 %) Quartz Minority Majority
Feldspar Minority Majority
Gypsum Negligible (0 %) Dominant (100 %) Calcite Present Present
Hematite Dominant (100 %) Negligible (0 %) Goethite Present (70 %) Present (30 %)
composition of the finer textural classes of soils: the silt and the clay fraction. There are insufficient measurements to as-sign an explicit size range for each mineral, so we determine an average mineralogy for each size class.
Primary minerals (quartz, feldspars and mica) are mostly found in the silt-sized fraction and secondary minerals (clay minerals, soluble minerals and iron oxide minerals) in the clay-sized fraction. We adopted an allocation, summarized in Table 1, as follows.
1. Clay minerals (illite, smectite, kaolinite and vermi-culite) are important chemical weathering products, are small and mostly belong to the clay-size fraction (Pedro, 1984).
2. The clay mineral, chlorite is an exception since it oc-curs both in the clay-size class and throughout the silt range (Griffin et al., 1968), depending on whether it is formed by hydrothermal alteration or inherited from bedrock.
3. Mica is a primarily a phyllosilicate mineral and con-sequently is silt-sized or coarser (Mitchell and Soga, 2005).
4. Quartz and Feldspars are present in all size fractions of soils. They are present in only minor amounts in the clay fraction, but are abundant in the silt fraction (Rahn, 1976; Chatenet et al., 1996).
5. Gypsum is most often found in the coarser fraction of soils (FAO, 1990b) and is therefore only allocated to the silt fraction.
6. Calcite seems to be present in all size fractions. Abtahi (1980) has shown that calcite occurs mostly in the large-size fractions of arid soils, but can also be found in significant quantity in the fine fractions. Therefore, we assign calcite to both the clay and silt fractions.
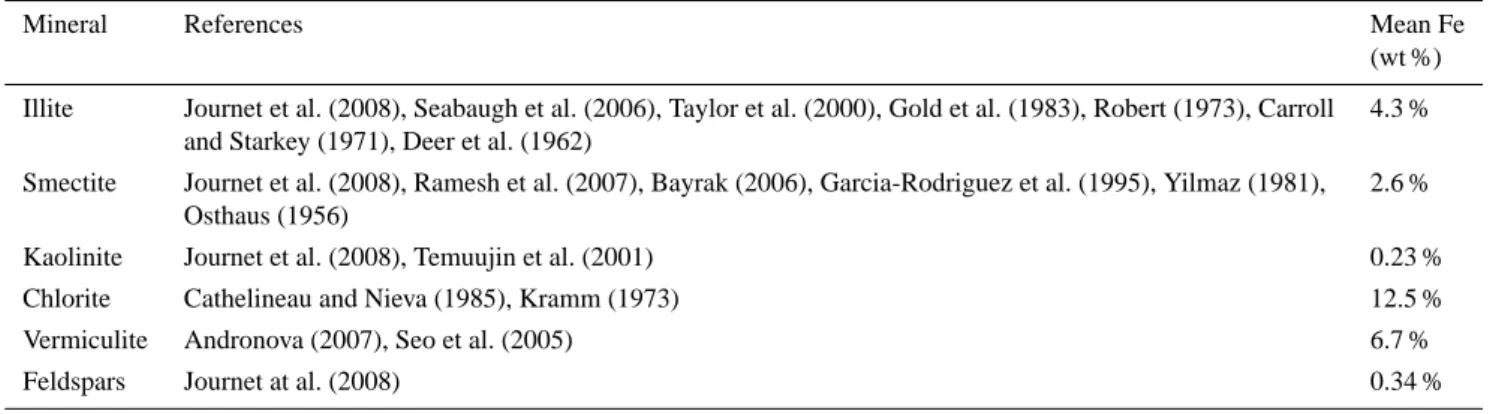
Table 2. Average iron content in selected minerals.
Mineral References Mean Fe
(wt %) Illite Journet et al. (2008), Seabaugh et al. (2006), Taylor et al. (2000), Gold et al. (1983), Robert (1973), Carroll 4.3 %
and Starkey (1971), Deer et al. (1962)
Smectite Journet et al. (2008), Ramesh et al. (2007), Bayrak (2006), Garcia-Rodriguez et al. (1995), Yilmaz (1981), 2.6 % Osthaus (1956)
Kaolinite Journet et al. (2008), Temuujin et al. (2001) 0.23 % Chlorite Cathelineau and Nieva (1985), Kramm (1973) 12.5 % Vermiculite Andronova (2007), Seo et al. (2005) 6.7 % Feldspars Journet at al. (2008) 0.34 %
7. Iron oxide minerals are generally formed through the alteration of the most common rocks. Their min-eralogy and crystallinity reflect the alteration envi-ronment and are strongly linked to climatic condi-tions (Cornell and Schwertzmann, 2003). Iron ox-ide minerals occur as very small individual particles (50–100 Å) (Greenland et al., 1968), often in com-bination with particles of kaolinite or as aggregates (e.g., Schwertmann and Kampf, 1985). Hematite and goethite are the most common iron oxide minerals found in soil. Kandler et al. (2009) showed that 66 % of the total iron oxide minerals are in the clay frac-tion and 33 % in the silt. There is no size-resolved iron species data available and the limited evidence for the size distribution of hematite and goethite is conflicting. Gangas et al. (1973), for example, claim that hematite and goethite are concentrated in the clay fraction, while Lafon et al. (2004), found an even dis-tribution between the clay- and silt-sized fractions of three arid soils. Coudé-Gaussen (personal communi-cation, 1999) suggests that goethite particles are com-mon on large quartz grains of size > 40 µm. We as-sume that only goethite is found in both size fractions, and hematite is confined to the clay fraction.
2.2 Iron content of the clay-size fraction
The mineralogical speciation of iron is distinguished in the database because iron from clay minerals is more soluble than iron from hematite or goethite (Journet et al., 2008). The total elemental iron content in the clay fraction is es-timated from the iron content for each mineral. This method does not account for variations that reflect the conditions in which the minerals were formed. Hematite and goethite are the most iron-rich minerals. According to their stoichiom-etry, hematite (Fe2O3) contains 69.9 % iron and goethite
(FeOOH) 62.8 %. Clay minerals and feldspars also contain a small proportion of iron trapped in their crystal lattice. The estimated iron content of the different minerals present in the clay fraction, collected from the literature, is given in Table 2.
2.3 Associating mineralogy with soil unit
Mineralogy is not a diagnostic criterion used in soil profile descriptions or a property used in soil classi-fication. Following Claquin et al. (1999), we hypothe-size that the mineralogy of the surface depends on the size distribution, the chemistry and the color of the soil, in order to infer an average mineralogical composition for each soil unit. We use the Harmonized World Soil Database (HWSD; FAO/IIASA/ISRIC/ISSCAS/JRC, 2009), a 30 arcsecond raster database, to determine the geographic distribution of soil units. The HWSD uses the FAO-UNESCO soil classification system, which is based on soil-profile descriptions and the presence of diagnostic hori-zon(s). The FAO soil classification has undergone several re-visions since it was first used for The Legend of the Soil Map
of the World (FAO-UNESCO, 1974). The number of major
soil groups has been increased, from 26 major soil groups in the 1974 version, to 28 in the 1990 version (FAO, 1990a). Each major soil group is divided into second-order soil units. The number of soil units also expanded between the 1974 and 1990 versions. For example, the Arenosols were subdi-vided into 4 soil units in the 1974 version (albic, cambic, ferralic and luvic) but 7 units in the 1990 version (albic, cal-caric, cambic, ferralic, gleyic, haplic and luvic). The HWSD combines both versions of the classification, giving a total of 211 individual soil units. The HWSD incorporates a num-ber of regional and national updates of the soil information. Although information on soil properties (e.g.,textural class, calcium carbonate and gypsum content) is available for each soil unit, individual units are grouped together into soil asso-ciations, designated by the dominant soil unit, for mapping purposes.
2.4 Database of topsoil mineralogy
We conducted an extensive literature review to compile the available descriptive data on soil mineralogy. To select repre-sentative measurements for each soil, we used the following criteria.
3804 E. Journet et al.: A new data set of soil mineralogy for dust-cycle modeling 1. The mineralogical analyses were made on
size-resolved fractions: the clay fraction (< 2 µm) and/or on the silt fraction (between 2 and 63 µm).
2. The mineralogical analyses were made on the topsoil (surface horizon) because subsurface layers are not subject to aeolian deflation.
3. The information is compiled for soil samples which can be identified according to the FAO soil classification.
Only data that met all three criteria were retained. The database compiles quantitative information on the miner-alogical composition of the clay and/or the silt fractions of soil samples and associated metadata including the source of the mineralogical information. The geographic coordinates of the original data are collected; either obtained directly from the source publication or inferred from the description of the general location of the soil profile. We also compiled the soil-sample texture (relative proportion of clay, silt and sand fractions); when this information was lacking, we used the mean texture of the corresponding FAO soil units given in the HWSD. The standard method of determining soil texture involves wet sieving, and thus results in the loss of soluble minerals such as calcite or gypsum. When size-resolved es-timates were not available, we therefore included the total calcite and gypsum content of the bulk soil (< 2 mm). Iron oxide minerals (hematite and goethite) occur in very small quantities in most soils and their abundance is rarely quanti-fied. We used the fact that the presence of iron oxide miner-als in the soil results in a distinctive red or yellow coloration (Torrent et al., 1983), together with a compilation of soil sam-ple color (according the Munsell Soil Color Charts; Munsell Color Company, 1975). The hematite and goethite content can be then inferred from the soil color according the rela-tionships established by Torrent et al. (1983) and by Fontes and Carvalho (2005).
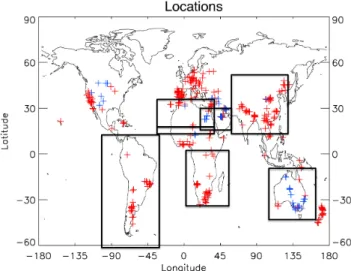
The final database contains data from 700 soil descrip-tions from more than 150 publicadescrip-tions. Most of the records (ca. 600) document the mineralogy of the clay fraction; there are far fewer records for the silt fraction. The spatial dis-tribution of the data is shown in Fig. 1. There is little data from Russia, Alaska, Canada and Greenland, and records are sparse across central Asia as much of the information from this region is in Chinese language publications. The distribution of records from other regions is inhomogeneous: the North American records are mostly from the western part of the continent, the South American records from Ar-gentina and Brazil, while there is little or no data from West and central Africa or from central Australia. Nevertheless, the database represents a substantial improvement on the Claquin et al. (1999) compilation (Fig. 1) and samples 55 % of the FAO soil units.
Fig. 1. Location of the data collected for this work (in red) and from Claquin et al. (1999) (in blue). The rectangles delimit regions studied in Fig. 8.
2.5 Expansion of the database and production of the
mean mineralogical tables
Despite the extensive literature compilation, the database is deficient in information about the calcite, hematite and goethite content of the clay fraction. Information about silt mineralogy is very sparse: quantitative information on the amount of quartz, feldspars, mica and is available for only 25 soil units (see Table S2 in the Supplement), and the amounts of calcite, gypsum and goethite are lacking in many cases. To overcome these problems, we have used a num-ber of empirical approaches (described below) to fill critical gaps in creating the final, mean mineralogical tables used to produce the mineralogical maps.
The HWSD give, for each soil unit of the FAO classifica-tion, the total amount of calcite and gypsum. Analysis of the
available data shows that the amount of CaCO3 in the clay
and silt fractions is linearly related to the clay/silt content of the soil (Fig. 2). Thus, we estimate the amount of calcite in the clay and the silt fraction of each soil unit from the to-tal CaCO3and the amount of clay/silt in that soil as Claquin
et al. (1999) had already done and we assume that the total amount of gypsum is divided equally between the silt and the sand fractions. Using these estimates, we have assigned to each of the 211 soil units the calcite content of the clay frac-tion and the calcite and gypsum content of the silt fracfrac-tion.
To access the hematite and goethite content, we applied the empirical relationships established by Torrent et al. (1983) and Fontes and Carvalho (2005) between soil color and hematite and/or goethite content. Soil color is determined through visual comparison with the Munsell Soil Color
Charts (Munsell Color Company, 1975). Color indices were
developed on the basis of the Munsell notation: (i) the red-ness rating (RR) (Torrent et al., 1983) as a numerical index
40
Figure 2: Empirical relationships (a) between the percentage of calcite in the clay fraction and the
ratio of the calcite in the clay fraction to the clay content of the soil (b) and between the percentage of calcite in the silt fraction and the ratio of the calcite in the silt fraction to the total calcite content
of the soil (right). 710
Fig. 2. Empirical relationships between (a) the calcite content of the clay fraction and the ratio of the calcite in the clay fraction to the one in soil and (b) the calcite content in the silt fraction and the ratio of the calcite in the silt fraction to the one in soil.
that could measure quantitatively the relationship between the redness and the hematite content in soil, (ii) the redness factor (RF) (Fontes and Carvalho, 2005) as a numerical index that allows estimating the hematite to goethite ratio in soil. The inferred hematite content is entirely allocated to the clay fraction of the soil. The inferred goethite content is allocated to both the clay and the silt fractions. Following size-resolved mineralogical data provided by Kandler et al. (2009) for min-eral dust particles sampled close to an African source area, 67 % of the goethite was assigned to the clay fraction and 33 % to the silt fraction. Thanks to these estimates, goethite and hematite content is now available in the clay fraction for 92 soils units and goethite in the silt fraction for 63 of the soils units.
As we have very little information for the silt fraction, we decided to assign the same quartz and feldspars content for all soil units within a major soil group, on the assumption that the content of these minerals in soils is determined by the mineralogy of the original bedrock and the classification of major soil groups is strongly related to the nature of the bedrock. The mica and chlorite contents of soils, however, is determined by soil-forming processes not bedrock miner-alogy. Where quantitative information on mica and chlorite
content is missing, we assign an average value based on the average of all the silt-fraction records.
Finally, the use of such estimates allows us to attribute a mean mineralogical composition of the clay fraction for 92 of the 211 soil units. For 28 of the remaining units, for which soil color information was lacking, we assumed that the hematite and/or goethite content was that of the major soil class to which the units belong. Data on the average clay mineralogical composition of the 120 soil units are presented in Table S1 in the Supplement. Nevertheless, there are still 91 soil units for which there is no information about the min-eralogical composition of the clay fraction in the database but for calcite.
For the silt fraction, using these approximations, we are able to specify the calcite, gypsum, mica and chlorite content for all the 211 units, the goethite content for 181 soil units and the quartz and feldspar contents for 113 soil units.
2.6 Creation of the mineralogical maps
The mean mineralogical tables provide mass percentages for ten minerals (illite, smectite, kaolinite, chlorite, vermiculite, feldspars, quartz, calcite, hematite, goethite) and the total el-emental iron content in the clay-sized fraction and mass per-centages of six minerals (feldspars, quartz, mica, chlorite, calcite and goethite) in the silt-sized fraction for individual FAO soil units. These values are assigned to all the geograph-ical locations with the soil unit corresponding to the HWSD database. The HWSD grid is then aggregated onto a regular grid with a resolution of 0.5◦×0.5◦. The resultant miner-alogical map only shows information for soil units for which there was primary or derived mineralogical data. When min-eralogical information is available for less than 50 % of the grid cell area, these cells are not mapped (white areas in Fig. 3). Two further maps were created for the clay alogy of soils. In the first map (CASE 1), we assign a miner-alogical composition to the 120 soil units for which we have no information in the database, based on the mineralogical composition of the soil units whose profile characteristics are the closest. In the second map (CASE 2) we assign the av-erage mineralogical composition of the major soil group to which the missing units belong to. The CASE 1 and CASE 2 maps have continuous coverage.
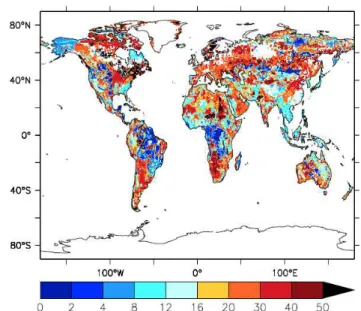
Even for the baseline case (CASE 0), there is good cover-age of the tropics and midlatitude regions, particularly mid-latitude regions of the Southern Hemisphere (Fig. 3). Most of the modern-day arid and semi-arid source areas are well cov-ered: there is mineralogical data for more than 90 % of the Sahara/Sahel and Middle East dust sources, and more than 80 % of the South African and South American dust sources. The coverage of Chinese, Australian and North American dust sources is poor, in large part because of the lack of min-eralogical data for the most widespread soil units (luvic Kas-tanozem, luvic Yermosol) in these regions. The lack of infor-mation about Australian dust sources is due to the fact that
3806 E. Journet et al.: A new data set of soil mineralogy for dust-cycle modeling
Fig. 3. Percent of soil area where clay mineralogy exists in the database.
most of the soil data comes from coastal regions (Fig. 1). The data set provides reasonable coverage of tropical and midlati-tude regions that are not sources today. Because data on gelic soils (i.e., with permafrost) were not included in the database, there is poor coverage for the high latitudes of the Northern Hemisphere (NH) and the Tibetan Plateau.
3 The mineralogical maps
3.1 Minerals in the clay fraction: the example of illite
Illite occurs in almost all soil units and is therefore repre-sented across all regions of the globe (Fig. 4). The amount is highly variable, ranging from 0 to 94 % with a mean value at 20.5 %. The highest amounts are found in the NH high and midlatitudes, under cool and temperate climates. This is consistent with the controls on the clay mineral formation: where water is scarce and temperature is low, physical alter-ation predominates and favors minerals similar to those of the parent rock, predominantly illite. The lowest amounts of illite are found in the wet equatorial zone where soil hydrol-ysis limits its occurrence. Previous studies (Caquineau et al., 2002; Claquin et al., 1999) have suggested that there was a latitudinal gradient in the amount of illite present in North Africa, but this is not so obvious in our dataset. The highest amounts of illite in this region occur east and south of the Sahara, associated with haplic and cambic Arenosols.
3.2 Mineralogy of the silt fraction: the example of mica
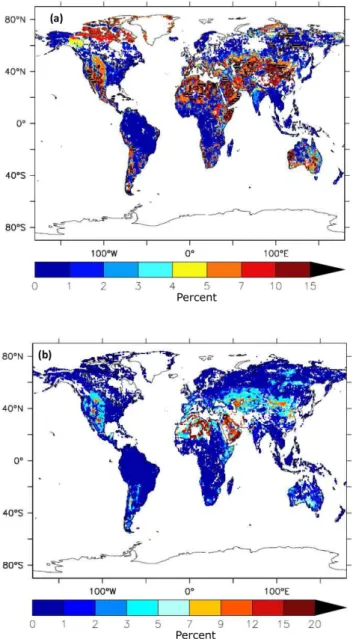
Mica and gypsum only occur in the silt fraction. The gypsum content of soils is always < 2 % and relatively homogeneous; the mica content is more variable. Although mica contents of
Fig. 4. Illite content in the clay fraction of soils (CASE 1).
Fig. 5. Mica content in the silt fraction of soils.
up to 25 % are obtained, most areas have between 6 and 9 % mica (Fig. 5). This homogeneity may reflect the assignment of average values to soil units lacking specific data. However, mica-rich soils occur locally in Alaska, along the Mediter-ranean coast of North Africa, in the Middle East, in northern India and in eastern China.
3.3 Minerals occurring in both silt and clay fractions:
the example of calcite
Calcite occurs in both the silt and clay fractions of soils. The amount of calcite in the silt fraction is generally low, rarely exceeding 5 % in the Southern Hemisphere (SH) and only exceeding 12 % in the NH in the hot deserts of the northern
Fig. 6. Calcite content (a) in the clay fraction of soils (CASE 1) and (b) in the silt fraction of soils.
intertropical zone (Sahara and Middle East) where it reaches 25 % (Fig. 6). A similar pattern is seen in the clay fraction, but the amounts are larger (up to 40 %). The calcite con-tent in the clay fraction is closely related to rainfall: cal-cite content is low in regions where the annual rainfall is
>400 mm (< 1 %), varies between 5 and 15 % in semi-arid regions (200 and 400 mm) and only exceeds 15 % in arid ar-eas where annual rainfall is < 200 mm.
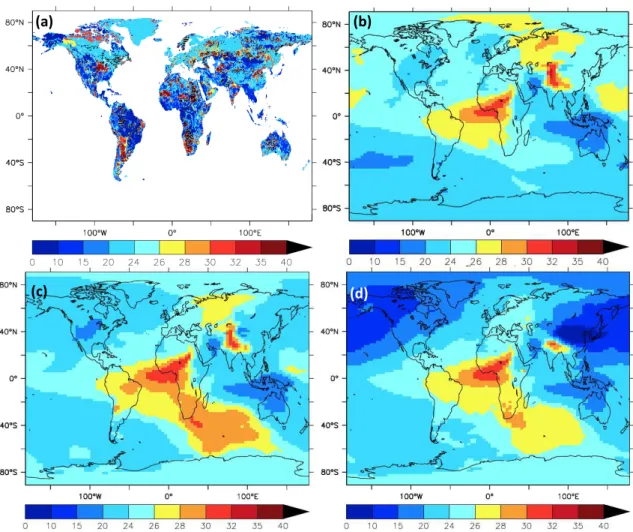
3.4 Distribution of total elemental iron and iron oxide
minerals
The total elemental iron content of the clay fraction ranges between 0 and 15 % (Fig. 7a). The total elemental iron
content reflects not only the presence of hematite and goethite but also the presence of clay minerals such as illite or smectite. These minerals contain substantial quantities of iron (around 3 % according Journet et al., 2008). Due to their high abundance in dust, estimates of total iron in dust have to account for the iron associated with both illite and smectite. The hematite content in the clay fraction is usually < 1.5 % (Fig. 7b) but reaches 5 % in some regions, including the lon-gitudinal band from Montana to Texas in the US, a latitudi-nal band across southern Russia, and arid regions of north-ern Africa, while soils in southnorth-ern Brazil/northnorth-ern Argentina have hematite contents > 5 %. Goethite occurs in both the clay- and silt-sized fractions. The amount of goethite in the clay fraction is generally higher than the amount of hematite, and more variable (from 0 to 15 %). The highest amounts of goethite are found in moist soils in the equatorial zone and over part of the eastern US. The amount of goethite in the silt fraction is more homogeneous and represents < 2 % of the mass except in the equatorial zone where it can reach > 5 %, as in soils in Brazil. Goethite is generally more abundant in humid tropical environments while hematite becomes more abundant in the seasonally dry tropics.
3.5 Mineralogical composition over modern
dust-source regions
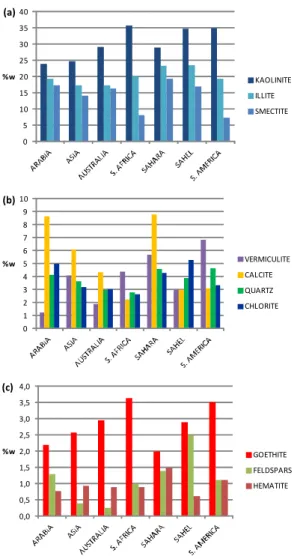
The largest sources of dust emissions to the atmosphere are located in the NH “dust belt” that extends from northern Africa to the Middle East, and from central and southern Asia to China. Dust emissions also occur from arid areas in South America, South Africa and central Australia. The dust from a particular source generally influences a specific region (Griffin et al., 2002). Dust from northern Africa, for example, is transported over the North Atlantic (Delany et al., 1967) and the Mediterranean Basin (Ganor and Mamane, 1982) and into Europe and the Americas, while dust from Asia is transported over the North Pacific to North America (Duce et al., 1980). We defined seven dust-source regions (Arabia: 13–23◦N, 25–65◦E; Asia: 10–50◦N, 65–130◦E; Australia: 110–160◦E, 45–10◦S; South Africa: 35—0◦S, 2– 52◦E; South America: 62◦S–10◦N, 100–30◦W; Sahara: 16– 36◦N, 25◦W–42◦E; and Sahel: 10–16◦N, 25◦W–42◦E) and calculated an average mineralogical composition for each re-gion (Fig. 8) to examine whether the differences in the min-eralogy of airborne dust were large enough to influence re-gional climate. The average composition was calculated by weighting the mineralogical composition of each soil unit within the region by the percentage of surface it covers.
Kaolinite is the dominant mineral in all the source regions, but the abundance varies from 24 (Arabia) to 36 % (South Africa). The next most abundant minerals are illite and tite. The total amount of clay minerals (kaolinite, illite, smec-tite, vermiculite and chlorite) ranges between 56 and 75 %. Quartz and feldspars never exceed 6 % of the clay fraction. In contrast, the amount of calcite varies from region to region:
3808 E. Journet et al.: A new data set of soil mineralogy for dust-cycle modeling
(a)
(b)
(c)
(d)
Fig. 7. Iron and iron oxides in soils: (a) iron in the clay fraction (CASE 1), (b) hematite in the clay fraction (CASE 1), (c) goethite in the clay fraction (CASE 1) and (d) goethite in the silt fraction.
the South African, South American and Sahelian sources have < 4 % whereas the Arabian and Saharan sources have values of around 9 %. The amount of iron oxide minerals in the clay fraction vary from 3.0 (Arabia) to 4.6 % (South America, South Africa). The total elemental iron content of each source ranges between 4 and 5 % of the clay fraction (Fig. 9). More than half is associated with iron oxide min-erals (goethite and hematite), while the rest is Fe associated with the aluminosilicate lattice of clay minerals such as illite and smectite. Vermiculite and chlorite are less abundant in the soil but also contribute to the total elemental iron.
The largest differences between regions are for vermiculite and calcite (relative standard deviations, RSD, ca. 50 %) and to a lesser extent, because of its very low abundance in the clay fraction, feldspars. Regional differences for the other minerals are less marked (RSD ca. 20 %).The amount of
illite (20.1 ± 2.5 %) and elemental iron (4.5 ± 0.4 %) are sim-ilar from region to region. The source areas of South Africa and South America have a similar mineralogical composi-tion (high kaolinite, low calcite and smectite, and high iron from goethite), which is nevertheless distinct from the miner-alogical composition of the Sahara and Arabia sources (low kaolinite, high calcite, and relatively low iron).
3.6 Differences between soil and airborne dust
mineralogy
We use a general circulation model with an aerosol scheme (LMDZ-INCA) to transport the minerals as individual trac-ers. For each mineral, 5 years of simulations were analyzed after a 3-month initialization period used to bring the aerosol distribution to a steady state. These simulations allowed us
0 5 10 15 20 25 30 35 40 %w KAOLINITE ILLITE SMECTITE 0 1 2 3 4 5 6 7 8 9 10 %w VERMICULITE CALCITE QUARTZ CHLORITE 0,0 0,5 1,0 1,5 2,0 2,5 3,0 3,5 4,0 %w GOETHITE FELDSPARS HEMATITE (a) (b) (c)
Fig. 8. Average mineralogical composition of the major dust-source regions (clay fraction, CASE 0). Top panel: the three major clay minerals with content higher than 5 %; middle panel: calcite and quartz with contents ca. 5 %; and bottom panel: minerals which con-tribute less than 4 % of the mass: iron oxides and feldspars.
to determine the volume fraction of the different minerals relative to the volume of total dust. Each mineral is trans-ported in the atmosphere using a modal scheme to repre-sent the size distribution with a mass median diameter of 2.5 µm and a σ of 2.0 (Schulz et al., 1998). Figure 10 illus-trates the global averaged differences in mineralogy between the clay fractions of soil and airborne dust. The mineralogi-cal composition of airborne dust is broadly similar to that of the clay fraction of the soil. The most abundant minerals in both soil and airborne dust are kaolinite, illite and smectite, which represent 68.6 % (by mass) of the soil and 64.5 % of the airborne dust. Kaolinite is less abundant in airborne dust than soil (23.6 versus 35.3 %), whereas the amount of illite and smectite is slightly higher in airborne dust. The largest differences between soil and airborne dust are in terms of the abundance of feldspars and of minerals outside the group
0 1 2 3 4 5 6 %w Iron feldspars Iron chlorite Iron vermiculite Iron smectite Iron illite Iron kaolinite Iron oxide minerals
Fig. 9. Average iron content and speciation of the major dust-source regions (clay fraction, CASE 0).
(a)
(b)
Fig. 10. Global yearly average composition (in mass percentage) of (a) clay fraction of soil and (b) airborne minerals.
considered here (other). Feldspars are not abundant in the soil (0.7 %) but are a significant component of airborne dust (3.7 %); other minerals form 8.9 % of the soil and only 5.2 % of airborne dust. These differences reflect the fact that the values for the soil are the average composition of all the world’s soils whereas the airborne dust is related only to the dust-producing regions.
The distribution of illite in the clay fraction of soils and yearly-averaged airborne dust from our CASE 0, CASE 1 and CASE 2 maps is shown in Fig. 11. Illite comprises be-tween 20 and 30 % of the total mass of airborne dust over most of the Northern Hemisphere in CASE 0 and CASE 1. Emissions from the Lake Chad region and the Taklamakan Desert contribute to the elevated illite content that creates a north–south gradient. In contrast, CASE 2 shows a relatively low illite fraction over the Gobi Desert.
Feely et al. (2009) assume that transported calcite has a mass content of 3 %, and use this fraction to limit the heterogeneous uptake of acids such as nitric acid by mineral dust. This is not consistent with our results, where the calcite
3810 E. Journet et al.: A new data set of soil mineralogy for dust-cycle modeling fraction in the three different cases ranges from 7.9 to 8.9 %
of the mass of the airborne clay fraction. Airborne calcite exceeds 12 % in the clay fraction over Mauritania, Morocco and the western US (Fig. 12).
4 Discussion
4.1 Comparison with Claquin et al. (1999) and Nickovic
et al. (2012) results
The Claquin et al. (1999) and Nickovic et al. (2012) data sets provides mineralogical information for arid dust-source regions. The only difference between these two existing databases is the extension of the mineralogical table for three new soil units (Yermosols, haplic Yermosols and Xe-rosols) by Nickovic at al. (2012) in comparison with Claquin et al. (1999). In the present paper, we recreated the whole database. We have extended this approach to cover soils over most of the world (with the exception of cold areas with per-mafrost), on the assumption that this will be useful for spec-ifying dust mineralogy as dust sources change in response to climate changes. We have been able to capitalize on the much-expanded literature now available to provide miner-alogical information of the clay fraction for 120 soil units described in the FAO classification. The number of miner-als considered was miner-also increased, compared to Claquin et al. (1999) and Nickovic et al. (2012), by adding information on chlorite, vermiculite, feldspars, goethite and hematite in the clay fraction. Although relatively unimportant by mass individually, together these minerals can be ca. 45 % of the mass in some soil units (e.g., Humic Ferralsols). We have added mica and chlorite in the silt fraction, and attribute the iron oxide in this fraction to goethite (rather than hematite as in Claquin et al., 1999 and Nickovic et al., 2012). We have chosen not to normalize the distribution of individual miner-als to 100 % of the mass, in order to avoid artificially inflating the amount of an individual mineral recorded; up to 17 % of the mass remains unidentified for some soils.
A comparison of databases has been established for 20 soil units that are listed Table 3. The average composition of the clay fractions obtained from the database of Nickovic et al. (2012) and from this work for the 20 soil units are shown in Fig. 13. Whatever the database, the major compo-nent of the clay fraction are clay minerals (kaolinite, illite and smectite), and the estimates of their cumulative abun-dance is almost always higher in the work of Nickovic et al. (2012) than in this work even if we add two additional clay minerals (chlorite and vermiculite). This can be partly explained by the fact that Nickovic et al. (2012) normalize the distribution of individual minerals to 100 % of the mass unlike us. In both databases, the range in calcite content is the same, between 0 and 30 % but in average the calcite con-tent is higher in this work compared to the one obtained by Nickovic et al. (2012). We observe significant differences for
Table 3. Soil units used for comparison of databases (see Fig. 13).
1 Arenosols cambic 2 Arenosols luvic 3 Fluvisols calcic 4 Fluvisols eutric 5 Lithosol – 6 Regosols calcaric 7 Regosols eutric 8 Salt flats – 9 Sand dunes – 10 Solonetz orthic 11 Solontchaks gleyic 12 Solontchaks orthic 13 Vertisols chromic 14 Xerosols calcic 15 Xerosols haplic 16 Xerosols luvic 17 Xerosols – 18 Yermosols calcic 19 Yermosols haplic 20 Yermosols –
calcite especially for Yermosols (3), haplic Yermosols (5), eutric Regosols (9), luvic Xerosols (11) and sand dunes (4) where the difference can exceed 150 %. We now discuss the evolution of the database between the two versions. The sig-nificant differences on calcite content result largely of the empirical relationship between the calcite content in the clay fraction and the total calcite content and the amount of clay in soil (Fig. 2) which is different between Claquin et al. (1999) and this work. The new relationship established in the present work leads to higher calcite content in the clay fraction for the same total calcite content and the amount of clay in soil. In any database, quartz is a minor component of the clay frac-tion ranging from 0 to 15 % with an average content of about 5 %. In both databases, hematite represents a minor fraction of the clay fraction, lower than 4.4 %. Hematite abundance is lower in our work compared to Nickovic et al. (2012) but as we have added goethite, the comparison can be made on the total iron oxide minerals. When we take the total iron oxide fraction, the cumulative abundance of hematite and goethite from our database amounts to a larger mass frac-tion (about 33 % higher in average) than the hematite content from Nickovic et al. (2012).
4.2 Implications for dust optical properties: single
scattering albedo
Most of the minerals in airborne dust, with the exception of iron oxide minerals, have similar optical properties in the shortwave part of the spectrum (from 0.2 to 4.0 µm). Here we use the refractive index of illite for everything ex-cept hematite and goethite. Hematite and goethite are more absorbing than the other minerals (Balkanski et al., 2007),
(a)
(b)
(d)
(c)
Fig. 11. Comparison of illite (mass %) (a) in soil; (b) airbone, CASE 0; (c) airborne CASE 1; (d) airborne CASE 2.
hematite being even more absorbing than goethite. The same relative volume of hematite compared to goethite will absorb substantially more radiation in the shortwave spectrum and its density is 25 % greater than goethite. The absorption of dust, and hence its single scattering albedo, depends not only on the total amount of optically active iron oxide minerals that are present but also on the relative proportion of hematite and goethite.
We used a core-shell optical model from Toon and Ackerman (1981) to calculate the albedo of dust over the whole range of relative abundances of illite, goethite and hematite shown in the database. The refractive index of this shell was determined using a dielectric model as described in Balkanski et al. (2007). These different core-shell assem-blages are fully determined by two variables: the percentage of the total volume occupied by the shell made of iron oxide minerals (i.e., volume goethite + volume hematite (%)) and the ratio, R, of the volume of hematite to the total volume of iron oxide minerals:
R =Vol. Hematite/(Vol. Hematite + Vol. Goethite).
Illite, goethite and hematite were transported as inert trac-ers in the general circulation model with an aerosol scheme (LMDZ-INCA). For each mineral, 5 years of simulations were analyzed to determine the volume fraction of illite, goethite and hematite relative to the volume of total dust. In these simulations, the yearly average volume fraction of iron oxide minerals relative to the total dust volume remains be-tween 1.5 and 5 % over most regions except over India where the values can fall below 1.5 % (Fig. 14a). The plot of the
Rratio (Fig. 14b) shows that goethite is more abundant than hematite over both hemispheres (R < 0.5) except for a region centered over central Europe.
4.3 Single scattering albedo of dust computed from iron
oxide minerals
We created a table with 286 values of the total iron oxide minerals mass and the R ratio to determine the single scat-tering albedo of the airborne dust. The values obtained for single scattering albedo, ω0, represent a yearly averaged
3812 E. Journet et al.: A new data set of soil mineralogy for dust-cycle modeling
(a)
(b)
Fig. 12. Comparison of (a) soil and (b) airbone dust calcite content (mass %).
gradients shown here cannot be obtained from any method based upon optical measurements.
5 Conclusions
There is a clear need for detailed information on mineralogy to improve assessments of the environmental and climatic impacts of dust. Although the size fractionation that occurs during emission leads to an aerosol composition that is dif-ferent from the parent soil (Gomes, 1990; Grini et al., 2002; Kok, 2011), there is still much work required to quantify these differences. Given the lack of data on the mineralog-ical composition of airborne dust, an indirect approach using the size-resolved mineralogical composition of parent soils is still the best way of specifying dust mineralogy globally. Claquin et al. (1999) were the first to produce mineralogical
0 20 40 60 80 100 1 2 3 4 5 6 7 8 9 10 11 12 13 14 15 16 17 18 19 20 % w Nickovic et al. (2012) hematite quartz calcite smectite illite kaolinite 0 20 40 60 80 100 1 2 3 4 5 6 7 8 9 10 11 12 13 14 15 16 17 18 19 20 % w This work goethite hematite quartz calcite smectite illite kaolinite (a) (b)
Fig. 13. Mean mineralogical composition of 20 FAO soils types: (a) Claquin et al. (1999) and Nickovic et al. (2012) and (b) this work.
maps of arid and semi-arid soils for this purpose, provid-ing information on eight minerals (quartz, feldspars, calcite, gypsum, illite, kaolinite, smectite and hematite) in both the clay- and silt-sized soil fractions. More recently, Nickovic et al. (2012) revised these maps to include three new soil units and soil phosphorus contents. The present work is a major improvement on these earlier compilations, because it is not confined to arid and semi-arid soil units and provides infor-mation on a wider range of minerals.
Despite having the benefit of a more extensive literature, data is still lacking for a number of soil units and it was there-fore necessary to make a number of assumptions to extrap-olate mineralogical information to cover all soil subtypes. There is comparatively little information on the calcite and iron oxide mineral (hematite and goethite) contents of both the clay- and silt-sized fractions because they are almost al-ways measured on the bulk soil. The same is true for gypsum. There is less information available about the mineralogy of silt compared to the clay fraction. This may be less impor-tant than the lack of information about the mineralogy of the clay-fraction because, although the silt fraction is impor-tant in dust total deposition, it is a less imporimpor-tant component of the radiatively active fraction of dust that is transported long distances from the source regions. The data coverage for Australia, South America and Asia is not satisfactory. In-formation may be available for Asia, although we were un-able to access this literature. Information on the mineralogi-cal composition of ferralic Arenosols, luvic Yermosols, sodic
(b)
(a) (a)
Fig. 14. (a) Mass in percent of hematite plus goethite and (b) elative mass ratio of hematite to hematite plus goethite.
Planosols and luvic Calcisols would considerably improve the database for Australia and South America. We have pro-duced a dynamic database, designed to evolve through in-clusion of new data. Data on the FAO soil units for which we were unable to obtain mineralogical information (see Ta-ble B1 in the Supplement), would greatly enhance the utility of the database. More information of the particle-size dis-tribution of calcite, gypsum and iron oxide minerals would improve the level of confidence in the mineralogical maps.
The current database and associated mineralogical maps provides a tool for specifying dust mineralogy in dust-cycle simulations. It can be used to deduce the mineralogy of both modern dust sources and dust sources created by changed conditions. This opens the way to examine the impact of changing dust sources in response to past or future climate and land-use scenarios.
Fig. 15. Single scattering albedo of airborne dust.
Supplementary material related to this article is available online at http://www.atmos-chem-phys.net/14/ 3801/2014/acp-14-3801-2014-supplement.pdf.
Acknowledgements. The compilation of the mineralogical data
was initially funded by the UK program QUEST (Quantifying Uncertainties in the Earth System), as part of the project Dynamics of the Earth System and the Ice-core Record (DESIRE).
Edited by: B. Vogel
The publication of this article is financed by CNRS-INSU.
References
Abtahi, A.: Soil genesis as affected by topography and time in highly calcareous parent materials under semiarid con-ditions in Iran, Soil Sci. Soc. Am. J., 44, 329–336, doi:10.2136/sssaj1980.03615995004400020025x, 1980. Andronova, V.: A study of the crystalline structure of vermiculite
from the Tebinbulak deposit, Refract. Indust. Ceram., 48, 91–95, doi:10.1007/s11148-007-0035-3, 2007.
Atkinson, J. D., Murray, B. J., Woodhouse, M. T., Whale, T. F., Baustian, K. J., Carslaw, K. S., Dobbie, S., O’Sullivan, D., and Malkin, T. L.: The importance of feldspar for ice nucleation by mineral dust in mixed-phase clouds, Nature, 498, 355–358, doi:10.1038/nature12278, 2013.
Balkanski, Y., Schulz, M., Claquin, T., and Guibert, S.: Reevalua-tion of Mineral aerosol radiative forcings suggests a better agree-ment with satellite and AERONET data, Atmos. Chem. Phys., 7, 81–95, doi:10.5194/acp-7-81-2007, 2007.
3814 E. Journet et al.: A new data set of soil mineralogy for dust-cycle modeling
Bayrak, Y.: Application of Langmuir isotherm to saturated fatty acid adsorption, Micropor. Mesopor. Mater., 87, 203–206, doi:10.1016/j.micromeso.2005.08.009, 2006.
Caquineau, S., Gaudichet, A., Gomes, L., and Legrand, M.: Min-eralogy of Saharan dust transported over northwestern tropical Atlantic Ocean in relation to source regions, J. Geophys. Res., 107, doi:10.1029/2000JD000247, 2002.
Carroll, D. and Starkey, H. C.: Reactivity of clay minerals with acids and alkalies, Clays Clay Miner., 19, 321–333, 1971.
Cathelineau, M. and Nieva, D.: A chlorite solid solution geother-mometer the Los Azufres (Mexico) geothermal system, Contrib. Mineral. Petrol., 91, 235–244, doi:10.1007/BF00413350, 1985. Chatenet, B., Marticorena, B., Gomes, L., and Bergametti, G.:
As-sessing the microped size distributions of desert soils erodi-ble by wind, Sedimentology, 43, 901–911, doi:10.1111/j.1365-3091.1996.tb01509.x, 1996.
Claquin, T., Schulz, M., and Balkanski, Y.: Modeling the mineral-ogy of atmospheric dust sources, J. Geophys. Res., 104, 22243– 22256, doi:10.1029/1999JD900416, 1999.
Cornell, R. M. and Schwertmann, U.: The iron oxides: structure, properties, reactions, occurrences and uses, 2nd Edn., Wiley-VCH Pub., Weinheim, Germany, 2003.
Creamean, J. M., Suski, K. J., Rosenfeld, D., Cazorla, A., De-Mott, P. J., Sullivan, R. C., White, A. B., Ralph, F. M., Min-nis, P., Comstock, A. M., Tomlinson, J. M., and Prather, K. A.: Dust and biological aerosols from the Sahara and Asia influ-ence precipitation in the western U.S., Sciinflu-ence, 339, 1572–1578, doi:10.1126/science.1227279, 2013.
Cwiertny, D. M., Baltrusaitis, J., Hunter, G. J., Laskin, A., Scherer, M. M., and Grassian, V. H.: Characteriza-tion and acid-mobilizaCharacteriza-tion study of iron-containing min-eral dust source materials, J. Geophys. Res., 113, D05202, doi:10.1029/2007JD009332, 2008a.
Cwiertny, D. M., Young, M. A., and Grassian, V. H.: Chemistry and photochemistry of mineral dust aerosol, Annu. Rev. Phys. Chem., 59, 27–51, doi:10.1146/annurev.physchem.59.032607.093630, 2008b.
Deer, W., Howie, R., and Zussman, J.: Rock-forming minerals, in: Sheet Silicates: Clay Minerals, vol. 3, 2nd Edn., Longmans, Lon-don, 1962.
Delany, A., Parkin, D. W., Griffin, J. J., Goldberg, E. D., and Reimann, B. E. F.: Airborne dust collected at Barbados, Geochim. Cosmochim. Acta, 31, 885–909, doi:10.1016/S0016-7037(67)80037-1, 1967.
DeMott, P. J., Sassen, K., Poellot, M. R., Baumgardner, D., Rogers, D. C., Brooks, S. D., Prenni, A. J., and Kreidenweis, S. M.: African dust aerosols as atmospheric ice nuclei, Geophys. Res. Lett., 30, 1732, doi:10.1029/2003GL017410, 2003.
Duce, R., Unni, C. K., Ray, B. J., Prospero, J. M., and Merrill, J. T.: Long-range atmospheric transport of soil dust from Asia to the tropical North Pacific – Temporal variability, Science, 209, 1522–1524, 1980.
FAO: Guidelines for Soil Profile Description, 3d Edn. (revised), Food and Agriculture Organization of the United Nations, In-ternational Soil Reference Information Centre, Land and Water Development Division, FAO, Rome, 1990a.
FAO: Caractéristique minéralogiques des sols, in: Études et prospections pédologiques en vue de l’irrigation, no. 42, Bulletin pédologique de la FAO, Rome, 26–29, 1990b.
FAO/IIASA/ISRIC/ISSCAS/JRC (Ed.): Harmonized World Soil Database (version 1.1), FAO, Rome, Italy and IIASA, Laxen-burg, Austria, 2009.
FAO-UNESCO (Ed.): The legend of the Soil Map of the World, UNESCO, Paris, 1974.
Feely, R. A., Doney, S. C., and Cooley, S. R.: Ocean acidifica-tion: present conditions and future changes in a high-CO2world,
Oceanography, 22, 36–47, doi:10.5670/oceanog.2009.106, 2009. Fontes, M. P. F. and Carvalho, I. A.: Color attributes and mineralog-ical characteristics, evaluated by radiometry of highly weathered tropical soils, Soil Sci. Soc. Am. J., 69, 1162–1172, 2005. Gangas, N. H., Simopoulos, A., Kostikas, A., Yassoglou, N. J., and
Filippakis, S.: Mössbauer studies of small particles of iron oxides in soil, Clays Clay Miner., 21, 151–160, 1973.
Ganor, E. and Mamane, Y.: Transport of Saharan dust across the eastern Mediterranean, Atmos. Environ., 16, 581–587, doi:10.1016/0004-6981(82)90167-6, 1982.
Garcia-Rodriguez, A., del Rey-Bueno, F., del Rey-Perez-Caballero, F. J., Ureña-Amate, M. D., and Mata-Arjona, A.: Synthe-sis and characterization of montmorillonite-(Ce or Zr) phos-phate crosslinked compounds, Mater. Chem. Phys., 39, 269–277, doi:10.1016/0254-0584(94)01439-N, 1995.
Gold, C., Cavell, P., and Smith, D.: Clay minerals in mixtures-sample preparation, analysis and statistical interpretation, Clays Clay Miner., 31, 191–199, 1983.
Gomes, L.: Approche géochimique du soulèvement des aérosols à l’interface sol-atmosphère en zone désertique, Ph.D. thesis, Uni-versité Paris 7, Paris, 1990.
Greenland, D. J., Oades, J., and Sherwin, T.: Electron-microscope observation of iron oxides in some red soils, J. Soil Sci., 19, 123– 126, doi:10.1111/j.1365-2389.1968.tb01526.x, 1968.
Griffin, D. W., Kellogg, C. A., Garrison, V. H., and Shinn, E. A.: The global transport of dust. An intercontinental river of dust, microorganisms and toxic chemicals flows through the Earth’s atmosphere, Am. Sci., 90, 228–235, 2002.
Griffin, J. J., Windom, H., and Goldberg, E. D.: The distribution of clay minerals in the world ocean, Deep-Sea Res., 15, 433–459, doi:10.1016/0011-7471(68)90051-X, 1968.
Grini, A., Zender, C. S., and Colarco, P. R.: Saltation sandblasting behavior during mineral dust aerosol production, Geophys. Res. Lett., 29, 1868, doi:10.1029/2002GL015248, 2002.
Hansell, R., Liou, K. N., Ou, S. C., Tsay, S. C., Ji, Q., and Reid, J. S.: Remote sensing of mineral dust aerosol using AERI during the UAE2: A modeling and sensitivity study, J. Geophys. Res, 113, D18202, doi:10.1029/2008JD010246, 2008.
Jickells, T. D., An, Z. S., Andersen, K. K., Baker, A. R., Bergametti, G., Brooks, N., Cao, J. J., Boyd, P. W., Duce, R. A, Hunter K. A., Kawahata, H., Kubilay, N., laRoche, J., Liss, P. S., Mahowald, N., Prospero, J. M., Ridgwell, A. J., Tegen, I., and Torres, R.: Global iron connections between desert dust, ocean biogeochemistry and climate, Science, 308, 67–71, doi:10.1126/science.1105959, 2005.
Journet, E., Desboeufs, K. V., Caquineau, S., and Colin, J.-L.: Min-eralogy as a critical factor of dust iron solubility, Geophys. Res. Lett., 35, L07805, doi:10.1029/2007GL031589, 2008.
Kandler, K., Schütz, L., Deutscher, C., Eber, M., Hofmann, H., Jäckel, S., Jaenicke, R., Knippertz, P., Lieke K., Massling, A., Petzold, A., Schladitz, A., Weinzierl, B., Wiedensohler, A., Zorn, S., and Weinbruch, S.: Size distribution, mass concentration, chemical and mineralogical composition and derived optical pa-rameters of the boundary layer aerosol at Tinfou, Morocco, dur-ing SAMUM 2006, Tellus B, 61, 32–50, doi:10.1111/j.1600-0889.2008.00385.x, 2009.
Kelly, J. T., Chuang, C. C., and Wexler, A. S.: Influence of dust composition on cloud droplet formation, Atmos. Environ., 41, 2904–2916, doi:10.1016/j.atmosenv.2006.12.008, 2007. Kok, J. F.: Does the size distribution of mineral dust aerosols depend
on the wind speed at emission?, Atmos. Chem. Phys., 11, 10149– 10156, doi:10.5194/acp-11-10149-2011, 2011.
Kramm, U.: Chloritoid stability in manganese rich low-grade meta-morphic rocks, Venn-Stavelot Massif, Ardennes, Contrib. Min-eral. Petrol., 41, 179–196, 1973.
Krueger, B. J., Grassian, V. H., Cowin, J. P., and Laskin, A.: Heterogeneous chemistry of individual mineral dust par-ticles from different dust source regions: the importance of particle mineralogy, Atmos. Environ., 38, 6253–6261, doi:10.1016/j.atmosenv.2004.07.010, 2004.
Lafon, S., Rajot, J. L., Alfaro, S., and Gaudichet, A.: Quantification of iron oxides in desert aerosol, Atmos. Environ., 36, 1211–1216, doi:10.1016/j.atmosenv.2003.11.006, 2004.
Levin, Z., Ganor, E., and Gladstein, V.: The effects of desert parti-cles coated with sulfate on rain formation in the eastern Mediter-ranean, J. Appl. Meteorol., 35, 1511–1523, 1996.
Mahowald, N. and Luo, C.: A less dusty future?, Geophys. Res. Lett., 30, 1903, doi:10.1029/2003GL017880, 2003.
Mahowald, N., Kohfeld, K., Hansson, M., Balkanski, Y., Harri-son, S. P., Prentice, J. C., Schultz, M., and Rodhe, H.: Dust sources and deposition during the last glacial maximum and cur-rent climate: A comparison of model results with paleodata from ice cores and marine sediments, J. Geophys. Res., 104, 15895– 15916, doi:10.1029/1999JD900084, 1999.
Martin, J. H., Gordon, R. M., and Fitzwater, S. E.: The case for iron, Limnol. Oceanogr., 36, 1793–1802, 1991.
Mitchell, J. K. and Soga, K.: Fundamentals of soil behavior, 3rd Edn., John Wiley & Son, New York, 2005.
Munsell Color Company: Munsell Soil Color Charts, Division of Kollmorgen Corp., Baltimore, 1975.
Nickovic, S., Vukovic, A., Vujadinovic, M., Djurdjevic, V., and Pejanovic, G.: Technical Note: High-resolution mineralogical database of dust-productive soils for atmospheric dust model-ing, Atmos. Chem. Phys., 12, 845–855, doi:10.5194/acp-12-845-2012, 2012.
Okin, G. S., Mahowald, N., Chadwick, O. A., and Artaxo, P.: Im-pact of desert dust on the biogeochemistry of phosphorus in terrestrial ecosystems, Global Biogeochem. Cy., 18, GB2005, doi:10.1029/2003GB002145, 2004.
Osthaus, B.: Kinetic studies on montmorillonites and nontronite by the acid-dissolution technique, Clays Clay Miner., 4, 301–321, 1956.
Pedro, G.: La genèse des argiles pédologiques, Ses implica-tions minéralogiques, physico-chimiques et hydriques, Sci. Geol. Bull., 37, 333–347, 1984.
Rahn, K. A.: Silicon and aluminum in atmospheric aerosols: crust-air fractionation?, Atmos. Environ., 10, 597–601, 1976.
Ramesh, A., Hasegawa, H., Maki, T., and Ueda, K.: Adsorption of inorganic and organic arsenic from aqueous solutions by poly-meric Al/Fe modified montmorillonite, Sep. Purif. Technol., 56, 90–100, doi:10.1016/j.seppur.2007.01.025, 2007.
Robert, M.: The experimental transformation of mica toward smec-tite; relative importance of total charge and tetrahedral substitu-tion, Clays Clay Miner., 21, 167–174, 1973.
Rosenfeld, D., Rudich, Y., and Lahav, R.: Desert dust suppressing precipitation: A possible desertification feedback loop, P. Natl. Acad. Sci. USA, 98, 5975–5980, 2001.
Schroth, A., Crusius, J., Sholkovitz, E. R., and Bostick, B. C.: Iron solubility driven by speciation in dust sources to the ocean, Nat. Geosci., 2, 337–340, doi:10.1038/ngeo501, 2009.
Schulz, M., Balkanski, Y., Guelle, W., and Dulac, F.: Role of aerosol size distribution and source location in a three-dimensional simulation of a Saharan dust episode tested against satellite-derived optical thickness, J. Geophys. Res., 103, 10579–10592, doi:10.1029/97JD02779, 1998.
Schwertmann, U. and Kampf, N.: Properties of goethite and hematite in kaolinitic soils of Southern and Central Brazil, Soil Sci., 139, 344–350, 1985.
Seabaugh, J. L., Dong, H., Kukkadapu, R. K., Eberl, D. D., Morton, J. P., and Kim, J.: Microbial reduction of Fe (III) in the Fithian and Muloorina illites: contrasting extents and rates of bioreduction, Clays Clay Miner., 54, 67–79, doi:10.1346/CCMN.2006.0540109, 2006.
Seo, D. C., Cho, J. S., Lee, H. J., and Heo, J. S.: Phos-phorus retention capacity of filter media for estimating the longevity of constructed wetland, Water Res., 39, 2445–2457, doi:10.1016/j.watres.2005.04.032, 2005.
Sokolik, I. N. and Toon, O. B.: Direct radiative forcing by an-thropogenic airborne mineral aerosols, Nature, 381, 681–683, doi:10.1038/381681a0, 1996.
Sokolik, I. N. and Toon, O. B.: Incorporation of mineralogical com-position into models of the radiative properties of mineral aerosol from UV to IR wavelengths, J. Geophys. Res., 104, 9423–9444, doi:10.1029/1998JD200048, 1999.
Swap, R., Garstan, M., Greco, S., Talbot, R., and Kallberg, P.: Saharan dust in the Amazon Basin, Tellus B, 44, 133–149, doi:10.1034/j.1600-0889.1992.t01-1-00005.x, 1992.
Takemura, T., Egashira, M., Matsuzawa, K., Ichijo, H., O’ishi, R., and Abe-Ouchi, A.: A simulation of the global distribution and radiative forcing of soil dust aerosols at the Last Glacial Max-imum, Atmos. Chem. Phys., 9, 3061–3073, doi:10.5194/acp-9-3061-2009, 2009.
Taylor, R. W., Shen, S., Bleam, W. F., and Tu, S. I.: Chromate re-moval by dithionite-reduced clays: evidence from direct X-ray adsorption near edge spectroscopy (XANES) of chromate reduc-tion at clay surfaces, Clays Clay Miner., 48, 648–654, 2000. Tegen, I., Werner, M., Harrison, S. P., and Kohfeld, K. E.:
Rela-tive importance of climate and land use in determining present and future global soil dust emission, Geophys. Res. Lett., 31, L05105, doi:10.1029/2003GL019216, 2004.
Temuujin, J., Burmaa, G., Amgalan, J., Okada, K., Jadambaa, T., and MacKenzie, K. J. D.: Preparation of porous silica from mechanically activated kaolinite, J. Porous Mater., 8, 233-238, doi:10.1023/A:1012244924490, 2001.
3816 E. Journet et al.: A new data set of soil mineralogy for dust-cycle modeling
Toon, O. B. and Ackerman, T.: Algorithms for the calculation of scattering by stratified spheres, Appl. Optics, 20, 3657–3660, doi:10.1364/AO.20.003657, 1981.
Torrent, J., Schwertmann, U., Fechter, H., and Alferez, F.: Quanti-tative relationships between soil color and hematite content, Soil Sci, 136, 354–358, 1983.
Usher, C. R., Michel, A. E., and Grassian, V. H.: Reactions on min-eral dust, Chem. Rev., 103, 4883–4940, doi:10.1021/cr020657y, 2003.
Werner, M., Tegen, I., Harrison, S. P., Kohfeld, K. E., Prentice, I. C., Balkanski, Y., Rodhe, H., and Roelandt, C.: Seasonal and in-terannual variability of the mineral dust cycle under present and glacial climate conditions, J. Geophys. Res.-Atmos., 107, 4744, doi:10.1029/2002JD002365, 2002.
Woodward, S., Roberts, D. L., and Betts, R. A.: A simula-tion of the effect of climate change-induced desertificasimula-tion on mineral dust aerosol, Geophys. Res. Lett., 32, L18810, doi:10.1029/2005GL023482, 2005.
Yilmaz, H.: Genesis of uranium deposits in Neogene sedimen-tary rocks overlying the Menderes metamorphic massif, Turkey, Chem. Geol., 31, 185–210, doi:10.1016/0009-2541(80)90086-8, 1981.