Modeling Uncertainties in Lichenometry Studies
Texte intégral
Figure
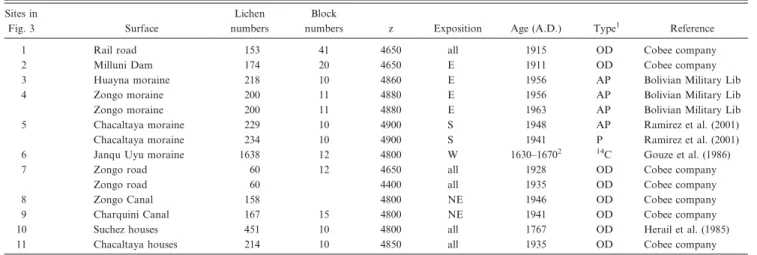
![FIGURE 4. A new type of growth curve plot. The horizontal lines correspond to the estimated location parameters m of the GEV distribution [see Equations (1) and (2)] for each of the 10 moraines.](https://thumb-eu.123doks.com/thumbv2/123doknet/14773127.592352/10.918.137.567.62.435/horizontal-correspond-estimated-location-parameters-distribution-equations-moraines.webp)
Documents relatifs
Using some ideas of Mazur, Kitagawa associated to any Hida family satisfying cer- tain algebraic conditions (cf. [16, p.105]) a p-adic L-function whose specialization in any weight
For practical reason, this system is written using the vector potential A C of the incident laser field, the vector potential A R of the Raman component, the electric field
These criteria assume that an organization which meets this profile will continue to grow and that assigning a Class B network number to them will permit network growth
The IR or the registry to whom the IR has delegated the registration function will determine the number of Class C network numbers to assign to a network subscriber based on
When rendering such text, the display engine must either find the glyph in the font that represents the base character and all of the combining characters, or it
A resource pool associates input ports or links on the node with output ports or links and is used to indicate how signals may be passed from an input port or link to an
Succeeding MRCPs are then treated as if they were MAIL commands, except that none of the text transfer manipulations are done; the stored message text is sent to
Your government will also introduce changes to laws that stand in the way of families, police and social workers, to ensure people posing a danger to themselves or others get the
