HAL Id: hal-00305085
https://hal.archives-ouvertes.fr/hal-00305085
Submitted on 26 Jul 2007
HAL is a multi-disciplinary open access
archive for the deposit and dissemination of
sci-entific research documents, whether they are
pub-lished or not. The documents may come from
teaching and research institutions in France or
abroad, or from public or private research centers.
L’archive ouverte pluridisciplinaire HAL, est
destinée au dépôt et à la diffusion de documents
scientifiques de niveau recherche, publiés ou non,
émanant des établissements d’enseignement et de
recherche français ou étrangers, des laboratoires
publics ou privés.
patterns in a mountainous catchment in south-eastern
Germany
Th. Petrow, B. Merz, K.-E. Lindenschmidt, A. H. Thieken
To cite this version:
Th. Petrow, B. Merz, K.-E. Lindenschmidt, A. H. Thieken. Aspects of seasonality and flood generating
circulation patterns in a mountainous catchment in south-eastern Germany. Hydrology and Earth
System Sciences Discussions, European Geosciences Union, 2007, 11 (4), pp.1455-1468. �hal-00305085�
www.hydrol-earth-syst-sci.net/11/1455/2007/ © Author(s) 2007. This work is licensed under a Creative Commons License.
Earth System
Sciences
Aspects of seasonality and flood generating circulation patterns in a
mountainous catchment in south-eastern Germany
Th. Petrow, B. Merz, K.-E. Lindenschmidt, and A. H. Thieken
GeoForschungsZentrum Potsdam, Section Engineering Hydrology, Telegrafenberg, 14473 Potsdam, Germany Received: 9 March 2007 – Published in Hydrol. Earth Syst. Sci. Discuss.: 21 March 2007
Revised: 10 July 2007 – Accepted: 18 July 2007 – Published: 26 July 2007
Abstract. Analyses of discharge series, precipitation fields
and flood producing atmospheric circulation patterns reveal that two governing flood regimes exist in the Mulde catch-ment in south-eastern Germany: frequent floods during the winter and less frequent but sometimes extreme floods dur-ing the summer. Differences in the statistical parameters of the discharge data can be found within the catchment from west to east. The discharges are compared to a number of landscape parameters that influence the discharge in the sub-catchments. Triggering circulation patterns were assigned to all events of the annual maximum discharge series in order to evaluate which circulation patterns are likely to produce large floods. It can be shown that the cyclone Vb-weather regime (TM, TRM) generates the most extreme flood events in the Mulde catchment, whereas westerly winds produce frequently small floods. The Vb-weather pattern is a very slowly moving low pressure field over the Gulf of Genoa, which can bring large amounts of rainfall to the study area. It could also be shown that even with the two flood regimes estimates with the annual maximum series provide a safer flood protection with a larger safety margin than using sum-mer maximum discharge series for extreme sumsum-mer floods only. In view of climate change it is necessary to integrate knowledge about catchment characteristics, the prevailing flood regime or the trends of weather patterns in the estima-tion of extreme events.
1 Introduction
Limited data on extreme and thus rare flood events com-plicate the accurate estimation of design discharges (e.g. Franc´es, 2001; Benito et al., 2004; Merz and Thieken, 2005). Numerous approaches have been developed for flood
estima-Correspondence to: Th. Petrow
tion, which include statistical approaches such as flood fre-quency analysis (FFA), the use of envelope curves as well as rainfall-runoff modelling with hydrological models. The focus in this study is set on the FFA.
The most common methods for FFA use annual maximum series (AMS) and peak over threshold series (POT) (Insti-tute of Hydrology, 1999). The AMS and POT series can also be extracted for summer or winter seasons, when, for in-stance, one flood process type (e.g. floods triggered by snow melting) is of special interest. Several distribution functions such as the Gumbel, Weibull, Generalized Extreme Value, or the Pearson type III can be fitted to the data (Hosking and Wallis, 1997; Institute of Hydrology, 1999). Although these functions and possibilities exist as to which data to in-tegrate, large uncertainties still remain when estimating ex-treme events. There is much debate about the length of the data series. Short series may not capture the entire flood vari-ability and very long series may not reflect stationary condi-tions (e.g. B´ardossy and Pakosch, 2005; Khaliq et al., 2006). Moreover, it is questionable whether or not an AMS is sta-tionary when the discharges reflect different flood producing processes. Independence, homogeneity and stationarity are required characteristics of the data to legitimate flood fre-quency analysis (Stedinger, 2000; Kundzewicz and Robson, 2004). However, often these criteria are not satisfied due to climatic change and/or anthropogenic influence (Webb and Betancourt, 1992; Klemˇes, 1993; Jain and Lall, 2000; Siva-palan et al., 2005; Svenson et al., 2005; Khaliq et al., 2006). Independence is almost always given, when analyzing an-nual maximum series, whereas partial series have to be care-fully examined in order to avoid miscounting one flood event as two. Usually, a threshold of several days is included in the extraction of the data, which defines the minimal time between two floods to ensure independence of the events. This threshold can comprise up to 30 days depending on the catchment area and discharge conditions. Stationary condi-tions seldom exist due to changes in climate, land-use or in
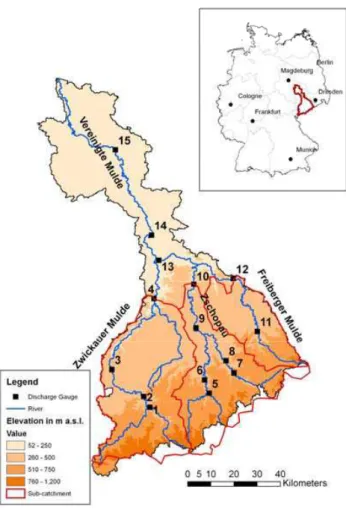
Fig. 1. Study area Mulde catchment: left: discharge gauge locations
(numbered according to Table 1) and the digital elevation model; right: geographical location in Germany.
the vulnerability of the study area, although these are often assumed (Merz, 2006). Moreover, the dynamics of atmo-spheric processes and flood generation have to be taken into account in the study of stationarity and independence and further in the FFA (Merz and Bl¨oschl, 2003; Sivapalan et al., 2005).
The relationship between climate and flood generation has been of growing interest and study (Webb and Betancourt, 1992; K¨astner, 1997; Jain and Lall, 2000; B´ardossy and Filiz, 2005; Steinbrich et al., 2005; St. George, 2007). Stein-brich et al. (2005) analyze the correlation between circula-tion patterns (CP) and heavy rain for the south-western part of Germany (Baden-Wuerttemberg). K¨astner (1997) found that only five out of thirty different weather patterns are sus-ceptible to produce flood events in Bavaria. Three catch-ments in southern Germany (Bavaria), which have differ-ent discharge characteristics and are differdiffer-ently influenced by snow melting, were studied. K¨astner (1997) found the Vb-weather regime to be most susceptible for the generation of large floods. This weather system is a low pressure system that moves very slowly from the Gulf of Genoa northwards.
It can accumulate large amounts of moist and warm air over the Mediterranean Sea, which is transformed into large pre-cipitation amounts that fall along the northern slopes of the Alps and mountain ranges in Central and Eastern Europe. It is therefore interesting to analyze the relationship of circula-tion patterns and flood generacircula-tion in the study area.
More information about flood generating processes can be gained when extending the study from one gauge station to the hydrological behaviour of sub-catchments and neigh-bouring regions (Harlin and Kung, 1992; Merz et al., 2006; Ouarda et al., 2006). Harlin and Kung (1992) extract for each sub-catchment the most extreme measured events and simu-late the simultaneous occurrence of the floods which has not been observed yet. Of special interest for the flood hazard estimation of ungauged areas is also the regional FFA which incorporates flood process information from neighbouring catchments (e.g. Stedinger, 1983; Hosking and Wallis, 1997; Institute of Hydrology, 1999). Regionally valid distribution functions are fitted to data of preferably independent gauges within a region, which exhibit, in general, better fits (Merz, 2006).
In this paper the flood discharge characteristics of the Mulde catchment in south-eastern Germany are analyzed ac-cording to stationarity, their spatial distribution of the statis-tical moments and the relationship between landscape char-acteristics and flood peaks. Additionally, the relationship between the dominating weather pattern in Europe and the flood generation in this catchment is discussed. The fol-lowing questions will be answered based on this analysis: Which landscape components (geology, soil, groundwater flow, land-use, precipitation) contribute to the flood dis-charge regime? Can seasonal or spatial differences be distin-guished? Do specific circulation patterns exist which trigger large events? And finally, are the requirements for the flood frequency analysis with AMS for this catchment fulfilled?
2 Study area and data
2.1 Study area
The Mulde catchment is a sub-catchment of the Elbe River basin in south-eastern Germany. The southern boundary is marked by the mountain ranges of the Erzgebirge, which co-incides with the Czech – German border. The catchment has a total area of 6171 km2(at the gauge Bad D¨uben) and has three large sub-catchments (Zwickauer Mulde, Zschopau, Freiberger Mulde), which drain the upper, mountainous part of the catchment (Fig. 1). Within only 20 km, the tributaries Zschopau and Freiberger Mulde disembogue near the gauge Erlln (gauge 13, Fig. 1) into the Zwickauer Mulde and form the Vereinigte Mulde (“Joined Mulde”), which disembogues near the city of Dessau into the Elbe River.
The elevation ranges from 52 m to 1213 m a.s.l. with ap-prox. 2/3 of the area being lowlands and 1/3 mountains
(500–1213 m a.s.l.) (Fig. 1). The mountain ranges in the south cause fast runoff responses to rainfall events in the trib-utaries, whereas in the major part of the catchment slower runoff responses dominate. The annual precipitation ranges from 500 mm in the lowlands to 1100 mm in the mountain ranges.
The landscape characteristics of the catchment such as geology, soil, hydro-geology and land-use parameters were evaluated to gain information about the variability of the discharge behaviour. Therefore, the catchment was split into three zones, which correspond to the three large sub-catchments (Fig. 1).
The region has a long history of large flood events. First written documents about floods, the corresponding water lev-els and damage can be found from the 9th century onward and more detailed documents starting from the 14th century (Pohl, 2004). It is noteworthy that large winter floods with ice blockage as well as summer floods from torrential storms or long lasting frontal rains caused high damages on infras-tructure and agriculture, often with fatalities.
During the last 100 years, three extreme flood events oc-curred in the study area, namely in July 1954, July 1958 and August 2002. These events will be analyzed in more de-tail in this paper. All of them were caused by large torren-tial storms. The floods in 1954 and 2002 were triggered by Vb-weather systems. Both flood events in the fifties caused high damage in different parts of the catchment, whereas in 2002 the entire catchment was affected. This flood caused a damage of 11.6 Billion C in Germany alone (DKKV, 2004; Thieken et al., 2006). As a consequence of the flood his-tory, flood defence measures play an important role and have been extended until the present day (DKKV, 2004). Numer-ous flood retention basins and dams were constructed, which are mainly located in the upper part of the catchment, and significantly influence the discharge downstream.
2.2 Data
2.2.1 Discharge data
Over 60 discharge and water level gauges exist in the Mulde catchment. The earliest measurements at regular intervals began in 1910 at two gauges. In order to evaluate the influ-ence of a dam before including data from the downstream discharge gauge into the dataset, daily differences of inflow versus outflow of five large dams for the period 1991–2002 were compared. More information from the dam authorities was not available. Inflow and outflow flood peaks were com-pared and the downstream stations were excluded from the dataset if the flood peak differences were greater than 10%, and if there were at least five affected flood events during this 10 year period. Additionally, daily time series of dis-charge gauges that are in the immediate vicinity of a dam were compared to daily discharge data from neighbouring gauges at other tributaries. Time series of discharge gauges
that did not reflect the hydrograph at the compared gauge station were excluded from the dataset. AMS (hydrological year from November to October) were extracted from daily maximum discharges.
A subset of discharge gauges was selected for this analysis which met the following criteria:
– the time series must have a length of at least 40 years, – the sub-catchment area is larger than 100 km2,
– the flood AMS exhibits no trend,
– the discharge gauges are distributed across the
catch-ment and have a distance of at least 3 km between each other.
15 discharge gauges meet these criteria; they are listed in Fig. 1 and Table 1. For better readability, the gauge stations are listed in all tables in the same order beginning with those located in the south-west (Zwickauer Mulde), then progress-ing north and east (Zschopau, Freiberg Mulde) and endprogress-ing with gauges located in the Vereinigte Mulde (cf. Fig. 1). 2.2.2 Precipitation Data
Precipitation data were available from the German Weather Service (DWD) at 49 stations in and around the Mulde catch-ment (see Fig. 2). The data cover the time period between 1952 and 2002 on a daily basis. Daily areal precipitation was calculated based on cubic interpolation for each of the 15 sub-catchments (corresponding to the discharge stations) for the comparison of precipitation and discharge.
2.2.3 Atmospheric circulation patterns
Information about the predominant European circulation pat-tern for each day was available from the “Catalogue of Großwetterlagen in Europe 1881–2004” (Gerstengarbe and Werner, 2005). The catalogue distinguishes three large cir-culations, which are divided into 30 different circulation pat-terns (one is classified to be a “transition class”) (Table 2). The Vb-weather system is represented by the patterns TM (low Middle Europe) and TRM (Trough Middle Europe).
The circulation patterns comprise the zonal circulation form, the mixed circulation form as well as the meridional circulation form. For every day a circulation pattern is as-signed to be the dominant one for Europe. Through the spe-cific distribution of lows and highs over Europe, it may there-fore be possible that the dominant circulation pattern of a particular day is not necessarily representative for the Mulde catchment. This is for instance the case, if the Mulde catch-ment is still under the influence of a weakened low, which is however already situated above Eastern Europe, whereas the dominating European circulation pattern is above Western Europe. However, other than this catalogue, more detailed meteorological data for the study area were not available.
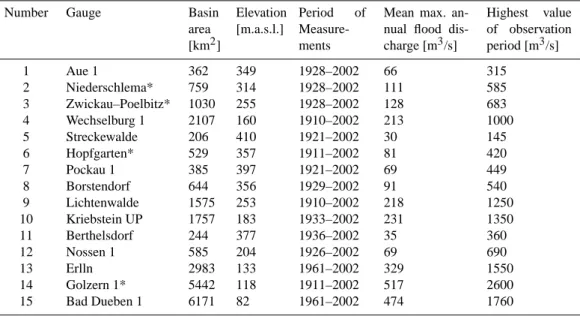
Table 1. Analyzed discharge gauges in the study area (* stations with one year of missing values).
Number Gauge Basin area [km2] Elevation [m.a.s.l.] Period of Measure-ments
Mean max. an-nual flood dis-charge [m3/s] Highest value of observation period [m3/s] 1 Aue 1 362 349 1928–2002 66 315 2 Niederschlema* 759 314 1928–2002 111 585 3 Zwickau–Poelbitz* 1030 255 1928–2002 128 683 4 Wechselburg 1 2107 160 1910–2002 213 1000 5 Streckewalde 206 410 1921–2002 30 145 6 Hopfgarten* 529 357 1911–2002 81 420 7 Pockau 1 385 397 1921–2002 69 449 8 Borstendorf 644 356 1929–2002 91 540 9 Lichtenwalde 1575 253 1910–2002 218 1250 10 Kriebstein UP 1757 183 1933–2002 231 1350 11 Berthelsdorf 244 377 1936–2002 35 360 12 Nossen 1 585 204 1926–2002 69 690 13 Erlln 2983 133 1961–2002 329 1550 14 Golzern 1* 5442 118 1911–2002 517 2600 15 Bad Dueben 1 6171 82 1961–2002 474 1760 3 Methodology
3.1 Flood frequency analysis
The distribution-free and non-parametric Mann-Kendall test for Trend (one-sided test; significance level: α=0.05) was used for the detection of trends in the data. Since small trends in the data may not be detectable, for instance by the Mann-Kendall test (B´ardossy and Pakosch, 2005), a regional test of stationarity was conducted with all 15 data sets (Lindstr¨om and Bergstr¨om, 2004). To this end, several data series from the same region, that cover the same period of measurements, are tested jointly (also with the Mann-Kendall test). For com-parison, the discharge data were divided by the MAF (mean maximum annual flood discharge) of the respective series. AMS of 13 gauge stations with data from 1936 to 2002 and of two gauges with data from 1961 to 2002 were included.
Independence of the data was ensured by using AMS data, which were also checked for possible dependent values around the turn of a hydrological year. For this, a threshold time of 7 days between two AMS floods was included, which guarantees the independence of two close-by flood events, since the time of concentration for this basin is smaller than 7 days.
Flood frequency analyses were performed with seven dif-ferent distribution functions (Gumbel, Weibull, 2-parametric LogNormal, Generalized Extreme Value (GEV), General Lo-gistics (GL), 3-parametric LogNormal, and Pearson type III) with both the Method of Moments and with the L-Moments (Hosking and Wallis, 1997; Institute of Hydrology, 1999). The GEV and GL distribution functions (both with L-Moments) revealed the best fits based on the Kolmogorov-Smirnov-Test and visual examination relative to the
empiri-cal probabilities (Test hypothesis: F(x)=CDF for all x with
α=0.05). Emerging consensus can be found in many stud-ies worldwide that the GEV distribution reveals the best fits (Pearson, 1991; Onoz and Bayazit, 1995; Vogel and Wil-son, 1996; Douglas and Vogel, 2006). The Institute of Hy-drology (1999) also describes the “theoretical and historical importance” of the GEV. Hence, subsequent analyses were performed using the GEV.
3.2 Spatial distribution of flood characteristics
The spatial distributions of the statistical moments of the AMS, such as skewness and coefficient of variation, were an-alyzed to detect possible differences among sub-catchments. The spatial extent and distribution of the three most extreme flood events (July 1954, July 1958, August 2002) were an-alyzed in more detail. For every event and gauge station, return periods (GEV, L-Moments) were calculated. These estimates were then assigned to each river segment upstream of the 15 gauge stations in order to analyze the flood charac-teristics in a spatially explicit manner.
Moreover, the AMS of 11 gauge stations with data from 1929 to 2002 (74 years) were studied with respect to the spa-tial distribution and magnitude of flood events. To this end, the number of different flood events per year in the catchment was analyzed. If all 11 gauges have their highest discharge of a certain year on the same day (+/− 1 day), the number of flood events for that year will be one. The other extreme is that all gauges have their highest peak at another time of the year. In that case, the number of flood events for that year is 11.
Table 2. Classification of the form of circulation and its specific pattern (* indicates circulation patterns which are relevant for AMS
discharges in the Mulde catchment).
Circulation pattern
Form of Circulation No. Name Abbr.
Zonal Circulation 1 West wind, anti-cyclone WA*
2 West wind, cyclone WZ*
3 Southern west wind WS*
4 Angular west wind WW*
Mixed circulation 5 South-west wind, anti-cyclone SWA* 6 South-west wind, cyclone SWZ* 7 North-west wind, anti-cyclone NWA* 8 North-west wind, cyclone NWZ* 9 High pressure system, middle Europe HM* 10 High pressure circuit over middle Europe BM* 11 Low pressure system, middle Europe TM* Meridional circulation 12 North wind, anti-cyclone NA
13 North wind, cyclone NZ
14 High pressure Iceland, anti-cyclone HNA 15 High pressure Iceland, cyclone HNZ* 16 High pressure, British Isles HB* 17 Trough Middle Europe TRM* 18 North-east wind, anti-cyclone NEA 19 North-east wind, cyclone NEZ* 20 High pressure Fennoscandia, anti-cyclone HFA* 21 High pressure Fennoscandia, cyclone HFZ 22 High pressure Norwegian Sea-Fennoscandia, anti-cyclone HNFA 23 High pressure Norwegian Sea-Fennoscandia, cyclone HNFZ 24 South-east wind, anti-cyclone SEA 25 South-east wind, cyclone SEZ* 26 South wind, anti-cyclone SA
27 South wind, cyclone SZ
28 Low Pressure, British Isles TB* 29 Trough, Western Europe TRW* 30 Transition, no classification U
3.3 Relationship between precipitation maxima and dis-charge maxima
The relationship between precipitation maxima and dis-charge maxima was studied in more detail. Areal precip-itation was calculated for the three large sub-catchments (Zwickauer Mulde: gauge Wechselburg; Zschopau: gauge Lichtenwalde; Freiberger Mulde: gauge Nossen) and the Vereinigte Mulde at the gauge Golzern. Precipitation sums of 24 h, 48 h and 72 h of the flood events were compared to discharge maxima. The four discharge stations are dis-tributed over the entire catchment and represent the large sub-catchments. Rainfall AMS were extracted from the pre-cipitation data and then compared on a seasonal basis to the discharge AMS to determine, how many large precipitation events are reflected in the discharge AMS.
3.4 Circulation pattern and flood generation
Daily data of circulation patterns between 1911 and 2002 were analyzed in order to obtain an overview about the sea-sonal distribution and frequency of the circulation patterns in Europe. Additionally, the circulation patterns, which are triggering the AMS discharges, were assigned to the AMS flood data of the gauge Golzern. The gauge at Golzern is representative for the entire catchment, because it comprises 88% of the catchment area. As the first gauge at the Verei-nigte Mulde it represents the influence of the two large sub-catchments. Moreover it has a long time series (1911–2002) compared to nearby gauges such as Bad D¨uben or Erlln (both 43 years).
From the AMS data, empirical probabilities were assigned to the flood events and then combined with the circulation pattern data. With this information, it is possible to estimate the potential of a circulation pattern to generate a flood of a certain return period.
Fig. 2. Locations of the 49 precipitation stations in and around the
study area.
4 Results
4.1 Testing for trends in the flood AMS
The one-sided Mann-Kendall test for increasing trend (sig-nificance level α=0.05) revealed no trends for all 15 gauge stations. The trend test for regional stationarity was per-formed with the normalized AMS of the 15 gauge stations. As Fig. 3 shows, the data exhibit a very small positive trend in the regional trend analysis. When the flood event from August 2002 was excluded from the data, the slightly posi-tive trend became slightly negaposi-tive. The Mann-Kendall test showed no trend (significance level α=0.05). Therefore the data were used for flood frequency analysis.
4.2 Seasonal occurrence and magnitude of floods
Two dominant flood process types in the Mulde catchment can be extracted from the data. During March and April, a first peak in the discharge AMS occurs during snow melt and “rain on snow” flood events. The second peak occurs in
July and August, when large torrential storms traverse the area (Table 3). At all 15 discharge stations winter floods (November–April) comprise a larger part of the AMS than summer floods. In the upper western part of the Erzge-birge (corresponding to the gauges at Aue, Niederschlema, Zwickau), the percentage of summer and winter floods in the AMS is almost equal (e.g. Aue: 46% summer floods; 54% winter floods), whereas in the eastern part of the catchment winter floods have larger percentage (59%–69%).
The winter floods are usually small events with a low re-turn period. They constitute at all 15 gauges only 8–21% of the 20% of the largest floods. Summer flood events, on the other hand, are less frequent, but cover a larger proportion of extreme events (26–39%). In Fig. 4 the data of Table 3 are summed up for all 15 gauges. Additionally, the monthly dis-tribution of the 20% largest flood events is shown. Again, it is visible that winter floods have a large percentage of the AMS, but the most extreme events occur during the summer. From these analyses we could conclude that summer flood events play a more important role for the flood hazard estimation of extreme events, which would necessitate the usage of Sum-mer Maximum Series (SMS) instead of AMS. A comparison of return periods estimated with AMS and SMS for the three extreme flood events showed however that estimated return periods up to 270 years are at all 15 gauges much lower with AMS. As an example return periods (GEV) for the gauge Aue are shown for the three floods 1954: 48 (AMS), 65 (SMS); 1958: 7 (AMS), 10 (SMS); 2002: 115 (AMS), 143 (SMS). Thus, a larger discharge would be needed to estimate the same return period, e.g. a design discharge of 100 years when using AMS compared to SMS. Estimates for return pe-riods larger than 270 years show, however lower values with SMS. Therefore, flood protection measures designed on the basis of AMS estimated return periods provide safety mar-gins, even for extreme summer events up to 250 years. 4.3 Spatial distribution of flood characteristics
The AMS of 11 gauge stations with data from 1929 to 2002 (74 years) were studied with respect to the spatial distribu-tion and magnitude of flood events. To this end, the number of different flood events per year in the catchment was ana-lyzed. In 13 years of the 74-year period, one flood event oc-curred that affected all 11 sub-basins, whereas in 18 years no dominant flood event (i.e. four to seven flood events per year) could be identified. These are summer and winter events. In most years (27) three different flood events are related to AMS discharges.
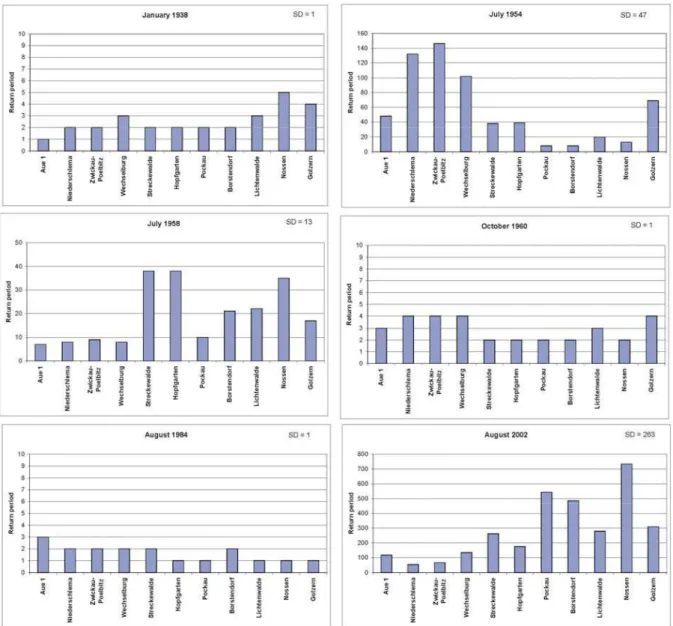
In Fig. 5 six different flood events at the 11 analyzed gauges and their respective return periods are shown. The return periods were estimated with the GEV (L-Moments). The six flood events comprise the three largest events in the catchment (1954, 1958, 2002) and three small catchment-wide events. Events with discharges that correspond up to a 10-year peak discharge are mostly homogenously distributed
Table 3. Monthly relative frequency of discharge AMS (in percent).
Gauge Jan Feb March April May June July Aug Sept Oct Nov Dec
Aue 8 4 9 24 8 5 15 8 7 4 3 5 Niederschlema 5 5 12 23 8 8 15 7 4 4 1 7 Zwickau 4 5 11 20 8 9 16 7 4 4 3 8 Wechselburg 12 8 13 9 5 8 17 9 1 2 5 12 Streckewalde 11 9 16 17 5 7 17 9 0 4 1 5 Hopfgarten 13 10 14 11 7 8 12 7 1 5 1 11 Pockau 11 11 17 10 10 6 12 7 2 4 2 7 Borstendorf 8 9 20 14 9 5 11 7 1 4 3 8 Lichtenwalde 13 14 19 10 6 5 9 9 1 2 1 11 Kriebstein 9 11 19 14 7 7 10 7 1 3 1 10 Berthelsdorf 7 13 24 7 9 3 10 7 1 1 1 13 Nossen 10 16 23 5 6 4 9 6 3 3 3 12 Erlln 10 12 26 10 7 2 7 12 2 2 0 10 Golzern 14 12 16 9 5 7 11 9 2 3 3 8 Bad D¨uben 10 10 26 12 7 2 10 10 2 2 0 10
Normalized AMS from 15 stations (1936-2002)
y = 0.005x - 8.8063 0 1 2 3 4 5 6 7 8 9 10 11 1933 1938 1943 1948 1953 1958 1963 1968 1973 1978 1983 1988 1993 1998 2003 H Q / M A F
Fig. 3. Regional trend test based on discharge data of 15 stations.
across the catchment. They have similar return periods at all gauges and exhibit a standard deviation of 1. This is shown for the floods in January 1938, October 1960 and Au-gust 1984. Events with discharges larger than a 10-year peak exhibit increasing spatial distinctions as well as increasing standard deviations. This is illustrated by the floods in 1954, 1958 and 2002. Depending on the location of the precipi-tation field, one or the other sub-catchment is more affected
during a large flood event. Figure 6 shows the spatial dis-tribution of the return periods that were calculated for the observed discharges of the three most extreme flood events (1954, 1958, 2002) in the Mulde catchment (upper part) and the corresponding areal precipitation events (lower part). The return period calculated for a certain gauge was assigned to the river segment upstream of the gauge. A marked spatial distribution can be seen. For the flood event in 1954, high
0 25 50 75 100 125 150 175 200 225
January February March April May June July August September October November December
H is to g ra m o f d is c h a rg e A M S p e r m o n th
Number of discharge AMS (sum over 15 gauges)
Number of 20% largest AMS floods per gauge (sum over 15 gauges)
Fig. 4. Monthly distribution of the number of discharge AMS, summed up over the 15 gauges for all AMS floods and for the 20% largest
events.
return periods were calculated for the western part of the catchment. This is explained by the rainfall event that had its centre in the western part. The floods in 1958 and 2002 were caused by precipitation events with their centres east of, or in the eastern part of the study area. Figure 6 illustrates the direct relationship between the location of the precipitation field and the flood return period for the three events.
More similar statistical moments were found along the tributary rivers rather than according to the elevation of the gauge locations. In the beginning the assumption was made that the gauges in the mountains of the Erzgebirge can be grouped together to exhibit similar statistical moments as well as the gauges in the lowlands. However, increasing values of the statistical moments occur from west to east that corresponds to the division of the sub-catchments. Fig-ure 7 shows the spatial distribution of the skewness (A) and the coefficient of variation (B) for the 15 gauges. The sub-catchment of the Zwickauer Mulde and the western part of the Zschopau (gauges 1–6 in Table 1) are more homogeneous and differ significantly (CI 95%) in its statistical moments from the eastern part of the catchment. These results sug-gest a different distribution of the precipitation in the sub-catchments which in turn leads to differences in the discharge behaviour. Another possibility is that the landscape charac-teristics are largely responsible for these differences, which is discussed in the following section.
4.4 Landscape characteristics
The land-use is dominated forest covered mountains and intensively used agricultural lowland. The proportion of agriculturally-used areas increases from west to east and south to north, whereas the percentage of forest decreases. Urban areas only play a role in the sub-catchment Zwickauer Mulde with two larger cities (Zwickau, Chemnitz). Mead-ows and pastures are homogenously distributed across the area with a slightly larger area in the upper middle Erzge-birge.
Table 4 shows the main percentages of the analyzed land-scape characteristics. It can be seen that no major differences in soil (type of soil with information on soil depth, texture, conductivity, etc.), bedrock, groundwater flow and land-use can be distinguished among the three large sub-catchments.
As we can see landscape characteristics, such as soil and hydro-geology, do not vary much between the sub-catchments. Although there are slight differences in the land-use, there is much evidence in the literature that dur-ing extreme events the land-use only plays a minor role (e.g. DKKV, 2004). Thus, the dominant influence seems to be ex-erted by precipitation and weather characteristics, which is discussed in the following two sections.
Figure 5: Variation of return periods for six different floods (SD = standard deviation)
Fig. 5. Variation of return periods for six different floods (SD = standard deviation).
4.5 Relationship between precipitation AMS and discharge AMS
AMS of precipitation and discharge were therefore compared to determine how well precipitation and discharge AMS co-incide. Different precipitation AMS were extracted from sums of one, two and three days. A time lag of two days between the precipitation event and the discharge peak was allowed. Table 5 shows exemplarily for four discharge sta-tions the percentages of agreement for summer and winter separately.
During the winter, the precipitation events are not so clearly and directly reflected in the discharge data (agreement 7–26%). One reason for this can be found in the topogra-phy of the catchment. During the winter time, large amounts
of the precipitation can fall as snow in the Erzgebirge and the water is stored in the snowpack. The discharge genera-tion is delayed until melting starts. Therefore, the triggering circulation pattern,which may have brought a major snow cover, cannot be directly related to the corresponding dis-charge peak. On the contrary, a direct connection between a large summer rain event and a large discharge can be found in the summer throughout the catchment (agreement 59–89%). Based on these findings the question was posed if large sum-mer flood events can also be related to a specific circulation pattern. This question will be answered in the following sec-tion.
Table 4. Percentages of the dominating landscape characteristics.
Zwickauer Mulde Zschopau Freiberger Mulde
Landuse Urban Areas 12% 7% 7%
Agricultural Land 52% 60% 70%
Forest 32% 33% 18%
Soil Cambisols and Planosols 88% 94% 90% Hydrogeology no or small local groundwater reservoirs 94% 99% 99% Geology Metamorphic or plutonic rocks 66% 91% 85%
Fig. 6. Estimated return periods (GEV, L-Moments) for the floods in 1954, 1958, 2002 (period 1929–2002 (above)) and the corresponding
precipitation fields (below). Note that for a better illustration of the spatial distribution the classes of discharge return periods and precipitation amounts differ.
4.6 Circulation pattern and flood generation
First of all, daily information about the dominating Euro-pean circulation pattern between 1911 and 2002 were an-alyzed. For the entire period, westerly winds (WA–WW) cover about 25% of the total circulation patterns; high pres-sure weather regimes (all circulation patterns beginning with the letter “H”) cover about 27%. The proportion of the Vb-weather regime (TM and TRM) is relatively low with 6.5%.
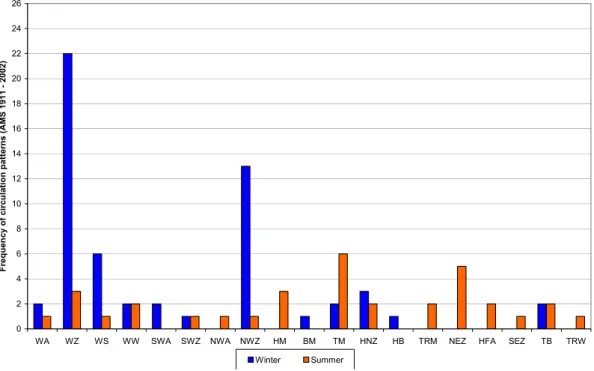
The analysis of the discharge AMS at the gauge Golzern shows that approx. 60% occur during the winter time and 40% during the summer time. Only 19 out of the 30 circu-lation patterns (cf. Table 2) play a role in creating AMS dis-charges in the Mulde catchment. Thus, 11 out of 30 CPs have not created an AMS discharge within the 92 years. In the winter (November–April), the cyclonal western and north-western patterns (WA–WW; NWZ) play the dominant role in flood generation, because they account for 84% of the AMS winter discharges and 100% for the floods from November until February (see Fig. 8). The summer AMS discharges are
Fig. 7. Skewness (A) and coefficient of variation (B) of the discharge AMS for the 15 gauges.
Monthly distribution of AMS discharges at Golzern and the assigned circulation pattern
0 500 1000 1500 2000 2500 3000 0 1 2 3 4 5 6 7 8 9 10 11 12 13 Month D is c h a rg e i n m ³/ s
Low British Isles (TB) North-west winds (NWZ) other CP Vb (TM, TRM) Westerly winds (WA-WW)
0 2 4 6 8 10 12 14 16 18 20 22 24 26
WA WZ WS WW SWA SWZ NWA NWZ HM BM TM HNZ HB TRM NEZ HFA SEZ TB TRW
F re q u e n c y o f c ir c u la ti o n p a tt e rn s ( A MS 1 9 1 1 2 0 0 2 ) Winter Summer
Fig. 9. Histogram of the circulation patterns at the gauge Golzern that generated AMS discharges between 1911 and 2002 (abbr. see Table 2).
0.00 0.02 0.04 0.06 0.08 0.10 0.12
2-year flood 5-year flood 10-year flood 25-year flood 50-year flood 90-year flood 100-year flood
n u m b e r o f A MS d is c h a rg e tr ig g e re d b y th e C P / n u m b e r o f d a y s w ith th e C P
Westerly winds (WA - WW) North-west winds (NWZ) Vb-weather system (TM; TRM) Low British Isles (TB) other CP
Fig. 10. Flood potential of different circulation patterns to cause a flood of a certain return period
generated by several different CPs, though mainly by west-erly cyclones (WA–WW), north-east cyclones (NEZ) and the troughs over central Europe (TM, TRM). Figure 9 illustrates the distribution separately for summer and winter.
To answer the question, which circulation pattern is likely to generate large floods in the Mulde catchment, the flood potential was calculated as the probability for a flood quantile
H QT, given a certain CP:
P (H QT|CPX) =
nH QT
nCPX
(1) where nH QT is the number of flood events larger than
H QT(e.g. the 10-year flood) that have been triggered by a
certain circulation pattern CPX, whereas nCPX is the num-ber of days with the corresponding circulation pattern. It is important to note that already for small return periods (5 years) the Vb-weather regime (TM, TRM) has the highest
flood potential (Fig. 10). These circulation patterns occur sel-dom, however they are associated with high discharge peaks. Their flood potential is even more pronounced for floods of larger return periods. Weather patterns, such as the westerly and north-western cyclones, which are responsible for most of the winter AMS discharges, play only an important role for return periods of max. 10 years.
There exist also Vb-weather regimes that generated floods with low return periods at the gauge Golzern. However, they often caused high damage in other catchments in Europe and had their precipitation centre outside the Mulde catchment. This is for example the case for the flood in April 1930 in Bavaria, the August 1984 flood in Switzerland, and the flood in July 1997 in the Odra catchment, when the Czech Repub-lic and Poland were heavily affected (Gr¨unewald et al., 1998; Wasserwirtschaftsamt Bayreuth, 2006).
Analyses of the other gauge stations as well as historical records of large floods in the Mulde catchment show sim-ilar results with the highest floods being generated by Vb-weather regimes. From this analysis we can conclude that although Vb-weather pattern do not occur often in the Eu-ropean weather regime they carry a large flood risk in the Mulde catchment.
5 Conclusions
Analyses of discharge series, precipitation fields and flood producing atmospheric circulation patterns revealed two gov-erning flood regimes in the Mulde catchment in south-eastern Germany: (1) frequent floods during the winter with gener-ally low return periods and (2) less frequent floods during the summer, which can reach remarkable flood peaks. Dif-ferences in the statistical parameters of the discharge data are found in the catchment from west to east, which are however not reflected in the landscape characteristics such as soil, el-evation or land-use. It is suspected that the location and the duration of the precipitation field are the most influencing factors for the discharge.
The usage of SMS could seem appropriate for extreme events in this catchment. However, return periods based on SMS revealed underestimations of extreme discharges up to a return period of 270 years. Estimates for even larger events showed underestimations with the AMS. Thus, flood protec-tion measures for design floods up to 250 years based on estimations from AMS are still recommended. From these analyses we can conclude that for catchments with two or more flood regimes it is not always necessary to separate these from the AMS given that the extreme events are well represented by the AMS and thus flood protection measures are designed with safety margins. However, a thorough anal-ysis of the flood characteristics of a catchment as well as flood producing weather regimes is of great importance for reliable flood estimates. In view of the climate change it is necessary to gain information about weather regimes that
Table 5. Percentages of agreement between precipitation AMS
(precipitation sums of 24 h, 48 h and 72 h) and discharge AMS.
24 h 48 h 72 h
Gauge Summer Winter Summer Winter Summer Winter
Wechselburg 65% 7% 61% 7% 70% 10%
Lichtenwalde 88% 20% 88% 7% 71% 14%
Nossen 78% 15% 89% 26% 83% 26%
Golzern 59% 20% 68% 17% 68% 20%
trigger large flood events in the region of interest and possible trends of these. With the combined information of catchment characteristics, flood behaviour and weather patterns, the un-certainty in the estimation of extreme events can be reduced.
Acknowledgements. We thank the GeoForschungsZentrum Pots-dam (GFZ) and the Helmholtz Association of National Research Centres for their financial support. The study was part of the Helmholtz Young Scientists Group “Information and modelling systems for large scale flood situations” at GFZ. We dedicate our special thanks to the authorities that provided data.
Edited by: A. Gelfan
References
B´ardossy, A. and Filiz, F.: Identification of flood producing atmo-spheric circulation patterns, J. Hydrol., 313, 48–57, 2005. B´ardossy, A. and Pakosch, P.: Wahrscheinlichkeiten extremer
Hochwasser unter sich ¨andernden Klimaverh¨altnissen, Wasser-wirtschaft, 7–8, 58–62, 2005.
Benito, G., Lang, M., Barriendos, M., Llasat, M. C., Franc´es, F., Ouarda, T., Thorndycraft, V. R., Enzel, Y., Bardossy, A., Coeur, D., and Bob´ee, B.: Use of systematic, palaeoflood and histori-cal data for the improvement of flood risk estimation Review of Scientific methods, Nat. Hazards, 31, 623–643, 2004.
DKKV (German Committee for Disaster Reduction): Flood Risk Reduction in Germany – Lessons Learned from the 2002 Dis-aster in the Elbe Region, DKKV Publication 29e LESSONS LEARNED, Bonn, 2004.
Douglas, E. M. and Vogel, R. M.: Probabilistic behavior of floods of record in the United States, J. Hydrol. Eng., 11(5), 482–488, 2006.
Franc´es, F.: Incorporating non-systematic information to flood frequency analysis using the maximum likelihood estimation method, in: The Use of Historical Data in Natural Hazards As-sessments, edited by: Glade, T., Albini P., and Frances, F., 89–99, Kluwer Academic Publishers, Dordrecht, 2001.
Gerstengarbe, F. W. and Werner, P. C.: Katalog der Großwetterlagen Europas (1881–2004) nach Paul Hess und Helmut Brezowsky (6th revised edition), PIK-Report No. 100, Potsdam Institute for Climate Impact Research, 2005.
Gr¨unewald, U., Kaltofen, M., Rolland, W., Sch¨umberg, S., Chmielewski, R., Ahlheim, M., Sauer, T., Wagner, R., Schluchter, W., Birkner, H., Petzold, R., Radczuk, L., Eliasiewicz, R., Paus, L., and Zahn, G.: Ursachen, Verlauf
und Folgen des Sommer-Hochwassers 1997 an der Oder sowie Aussagen zu bestehenden Risikopotentialen, Deutsches IDNDR-Komitee f¨ur Katastrophenvorbeugung e.V. 10b, Bonn, 1998. Harlin, J. and Kung, C.-S.: Parameter uncertainty and simulation of
design floods in Sweden, J. Hydrol., 137, 209–230, 1992. Hosking, J. R. M. and Wallis, J. R.: Regional frequency analysis,
Cambridge University Press, New York, 1997.
Institute of Hydrology: Flood estimation handbook, Institute of Hy-drology, Crowmarsh Gifford, Wallingford, UK, Vol. 1–5, 1999. Jain, S. and Lall, U.: Magnitude and timing of annual
maxi-mum floods: Trends and large-scale climatic associations for the Blacksmith Fork River, Utah, Water Resour. Res., 36(12), 3641– 3651, 2000.
K¨astner, W.: How do Großwetterlagen become flood-producing weather situations in Bavaria?, DGM (in German), 41(3), 107– 112, 1997.
Khaliq, M. N., Ouarda, T. B. M. J., Ondo, J.-C., Gachon, P., and Bob´ee, B.: Frequency analysis of a sequence of dependent and/or non-stationary hydro-meteorological observations: A review, J. Hydrol., 329, 534–552, 2006.
Klemˇes, V.: Probability of extreme hydrometeorological events–a different approach, in: Extreme hydrological events: precipita-tion, floods and droughts, edited by: Kundzewicz, Z. W., Rosb-jerg, D., Simonovic, S. P., and Takeuchi, K., IAHS Publ., 213, 167–176, 1993.
Kundzewicz, Z. W. and Robson, A. J.: Change detection in hy-drological records – a review of the methodology, Hydrol. Sci., 49(1), 7–19, 2004.
Lindstr¨om, G. and Bergstr¨om, S.: Runoff trends in Sweden 1807– 2002, Hydrol. Sci., 49(1), 69–83, 2004.
Merz, B.: Hochwasserrisiken: Grenzen und M¨oglichkeiten der Risikoabsch¨atzung, Schweizerbart’sche Verlagsbuchhandlung, Stuttgart, 2006.
Merz, B. and Thieken, A. H.: Separating natural and epistemic un-certainty in flood frequency analysis, J. Hydrol., 309, 114–132, 2005.
Merz, R. and Bl¨oschl, G.: A process typology of regional floods, Water Resour. Res., 39(12), 1340, doi:10.1029/2002WR001952, 2003.
Merz, R., Bl¨oschl, G., and Parajka, J.: Raum-zeitliche Vari-abilit¨at von Ereignisabflussbeiwerten in ¨Osterreich, Hydrologie und Wasserbewirtschaftung, 50(1), 2–11, 2006.
Ouarda, T. B. M. J., Cunderlik, J. M., St-Hilaire, A., Barbet, M., Bruneau, P., and Bob´ee, B.: Data-based comparison of seasonality-based regional flood frequency methods, J. Hydrol., 330, 329–339, 2006.
Onoz, B. and Bayazit, M.: Best-fit distributions of largest available flood samples, J. Hydrol., 167, 195–208, 1995.
Pearson, C. P.: New Zealand Regional flood frequency analysis us-ing L-Moments, J. Hydrol., 30(2), 53–64, 1991.
Pohl, R.: Historische Hochwasser aus dem Erzgebirge, Wasser-bauliche Mitteilungen Vol. 28, Institut f¨ur Wasserbau und Tech-nische Hydromechanik TU Dresden, 2004.
Sivapalan, M., Bl¨oschl, G., Merz, R., and Gutknecht, D.: Link-ing flood frequency to long-term water balance: Incorporat-ing effects of seasonality, Water Resour. Res., 41, W06012, doi:10.1029/2004WR003439, 2005.
Stedinger, J. R.: Estimating a regional flood frequency distribution, Water Resour. Res., 19(2), 503–510, 1983.
Stedinger, J. R.: Flood frequency analysis and statistical estima-tion of flood risk, in: Inland Flood Hazards – Human, Riparian and aquatic communities, edited by: Wohl, E. E., 12, Cambridge University Press, Cambridge, 2000.
St. George, S.: Streamflow in the Winnipeg River basin, Canada: Trends, extremes and climate linkages, J. Hydrol., 332, 396–411, 2007.
Steinbrich, A., Uhlenbrook, S., Reich, Th., and Kolokotronis, V.: Raum-zeitliche Zusammenh¨ange zwischen Großwetterlagen und Starkniederschl¨agen in Baden-W¨urttemberg, Wasserwirtschaft, 11, 14–19, 2005.
Svenson, C., Kundzewicz, Z. W., and Maurer, Th.: Trend detection in river flow series: 2. Flood and low-flow index series, Hydrol. Sci., 50(5), 811–824, 2005.
Thieken, A. H., Petrow, Th., Kreibich, H., and Merz, B.: Flood losses, insurance cover and precautionary behaviour of private households affected by the August 2002 flood in Germany, Risk Analysis, 26(2), 383–395, 2006.
Vogel, R. M. and Wilson, I.: Probability distribution of annual max-imum, mean, and minimum streamflows in the United States, J. Hydrol. Eng., 1(2), 69–76, 1996.
Wasserwirtschaftsamt Bayreuth: http://www.wwa-bt.bayern.de/ gewaesser/wasserbau/hochwasserschutz/hwku.htm (access on 29 June 2007), 2006.
Webb, R. H. and Betancourt, J. K.: Climate variability and flood frequency of the Santa Cruz River, Pima County, Arizona, U.S. Geological Survey Water Supply Paper, 2379, 1992.