HAL Id: hal-00297566
https://hal.archives-ouvertes.fr/hal-00297566
Submitted on 21 Jul 2006
HAL is a multi-disciplinary open access
archive for the deposit and dissemination of
sci-entific research documents, whether they are
pub-lished or not. The documents may come from
teaching and research institutions in France or
abroad, or from public or private research centers.
L’archive ouverte pluridisciplinaire HAL, est
destinée au dépôt et à la diffusion de documents
scientifiques de niveau recherche, publiés ou non,
émanant des établissements d’enseignement et de
recherche français ou étrangers, des laboratoires
publics ou privés.
of sulphur and nitrogen to ICP-forest sites in Europe
D. Simpson, H. Fagerli, S. Hellsten, J. C. Knulst, O. Westling
To cite this version:
D. Simpson, H. Fagerli, S. Hellsten, J. C. Knulst, O. Westling. Comparison of modelled and monitored
deposition fluxes of sulphur and nitrogen to ICP-forest sites in Europe. Biogeosciences, European
Geosciences Union, 2006, 3 (3), pp.337-355. �hal-00297566�
www.biogeosciences.net/3/337/2006/ © Author(s) 2006. This work is licensed under a Creative Commons License.
Biogeosciences
Comparison of modelled and monitored deposition fluxes of sulphur
and nitrogen to ICP-forest sites in Europe
D. Simpson1,3, H. Fagerli1, S. Hellsten2, J. C. Knulst2, and O. Westling2 1EMEP MSC-W, Norwegian Meteorological Institute, Oslo, Norway
2IVL Swedish Environmental Research Institute, P.O. Box 5302, 400 14 Gothenburg, Sweden 3Dept. Radio & Space Science, Chalmers University of Technology, Gothenburg, Sweden
Received: 9 May 2005 – Published in Biogeosciences Discuss.: 9 August 2005 Revised: 1 June 2006 – Accepted: 13 July 2006 – Published: 21 July 2006
Abstract. The EMEP MSC-W Eulerian chemical transport
model, and its predictions of deposition of acidifying and eutrophying pollutants over Europe, play a key role in the development of emission control strategies for Europe. It is important that this model is tested against observational data. Here we compare the results of the EMEP model with mea-sured data from 160 sites of the European Union/ICP For-est (Level II) monitoring network, for the years 1997 and 2000. This comparison comprises: (a) Precipitation amount, (b) Total deposition of SO2−4 to coniferous and deciduous forests, (c) Wet deposition of SO2−4 , NO−3 and NH+4 in open field sites, and (d) Concentrations of SO2−4 , NO−3 and NH+4 in precipitation.
Concerning precipitation, the EMEP model and ICP net-work showed very similar overall levels (within 4% for 1997 and 11% for 2000). The correlation was, however, poor (r2=0.15–0.23). This can be attributed largely to the influ-ence of a few outliers, combined with a small range of rain-fall amounts for most points. Correlations between mod-elled and observed deposition values in this study were rather high (r2 values between 0.4–0.8 for most components and years), with mean values across all sites being within 30%. The EMEP model tends to give somewhat lower values for SO2−4 , NO−3 and NH+4 wet deposition to ICP, but differences in mean values were within 20% in 1997 and 30% in 2000. Modelled and observed concentrations of SO2−4 , NO−3 and NH+4 in precipitation are very similar on average (differences of 0–14%), with good correlation between modelled and ob-served data (r2=0.50–0.78). Differences between the EMEP model and ICP measurements are thought to arise from a mixture of problems with both the observations and model. However, the overall conclusion is that the EMEP model per-forms rather well in reproducing patterns of S and N deposi-tion to European forests.
Correspondence to: D. Simpson
(david.simpson@met.no)
1 Introduction
A major aim of EMEP (Cooperative Programme on the Long Range Transmission of Air Pollutants in Europe, http://www. emep.int) is to support governments with scientific guidance on the causes of air pollution concentrations and depositions within Europe. EMEP model results are an essential input to integrated assessment models (Sch¨opp et al., 1999; Amann et al., 1999), and have been crucial to a number of emission control agreements, including the recent European Union National Emissions Ceilings Directive. The modelling tool currently in use at the Meteorological Synthesizing Centre-West (MSC-W) of EMEP is a Eulerian model which calcu-lates concentration and depositions associated with acidifi-cation and eutrophiacidifi-cation, as well as ozone (Simpson et al., 2003a). An essential part of the use of such a model has always been thorough evaluation against measurements, in order to give confidence in its basic scientific formulation, and its use for policy research. Typically, these evaluations have consisted of comparisons of modelled concentrations and deposition against measurements available through the EMEP Chemical Coordinating Centre (EMEP/CCC), whose network includes 70 sites reporting wet deposition through-out Europe (Hjellbrekke, 2004).
Although the new EMEP model can estimate deposition to many different types of ecosystems, the present study con-centrates on forested areas. The incentive for this study and the focus on forests was the European Union NOFRETETE (Nitrogen Oxide Emissions from European Forest Ecosys-tems) project, whose purpose was to provide new tools for looking at the emissions of nitrogen from European forest ar-eas. The EMEP model’s predictions of N-deposition formed one of the major inputs to the soil-N model used by Kesik et al. (2005, 2006), and so it is important to evaluate the EMEP model’s predictions for forests in particular.
Further, deposition of sulphur, and of both oxidised and reduced nitrogen to forests is associated with numerous
environmental problems, including acidification and eu-trophication, and changes in species composition and bio-diversity (e.g. Bobbink et al., 1998; Kreutzer and Weiss, 1998; Nilsson and Grennfelt, 1988; Pitcairn et al., 1998; Schulze, 1989). As a result of these concerns, an exten-sive measurement network, dedicated to forests, has been in operation for over two decades – that of the Interna-tional Co-operative Programme on Assessment and Moni-toring of Air Pollution Effects on Forests (ICP Forests, http: //www.icp-forests.org). ICP forests was started in 1985, un-der the Convention on Long-Range Transboundary Air Pol-lution. ICP Forests is responsible for the level I and the more detailed level II monitoring system of forest sites, which have been in operation since 1986 (level I) and 1994 (level II). Level I includes ∼6000 monitoring sites in Europe, and eval-uates crown condition (defoliation, crown transparency and discolouration), soil condition, and the foliar nutrient sta-tus. Level II includes more than 860 monitoring sites and also evaluates e.g. forest growth, meteorology, phenology, ground vegetation and the deposition of air pollutants in ad-dition to the level I parameters.
The ICP data forms the only coordinated pan-European dataset of measurements for forests, and has importance for both the European Union and UNECE policy assessments. The EMEP model’s predictions of S and N-deposition to forests form the basis for EU and UNECE assessments of ecosystem damage to forests and ultimately for emissions control strategy development. It is important that these two datasets of forest deposition be compared, in order to estab-lish their points of both consistency and disagreement.
The present work has several aims: (1) to document the performance of the EMEP model’s deposition predictions for forest areas, for the purposes of the NOFRETETE project; (2) to compare the two forest-deposition data-sets which are important in UNECE and EU for policy purposes, the mea-surement data of ICP-forests and the modelled data of EMEP MSC-W; (3) to extend and complement previous model eval-uations by using an extensive data-set which had not previ-ously been used, and which includes data on total deposition (for sulphur) which the EMEP networks lack.
The need for extensive model evaluation for forest areas in particular is strengthened by the complex nature of atmo-spheric deposition. Air masses within a forest canopy are subject to a large number of complex interactions, involv-ing e.g. emissions of NO from the forest floor, turbulent ex-change with the air above, chemical reactions between NO, NO2and O3, and with VOC associated with aloft air masses
or emitted by vegetation (Lenschow and Delany, 1987; Lud-wig et al., 2001; Meyers and Baldocchi, 1988; Duyzer et al., 1995; Ganzeveld et al., 2002; Dorsey et al., 2004; Raupach, 1979). Further, experimental evidence for processes such as possible compensation-points for NO or NH3 (Duyzer
and Fowler, 1994; Dorsey et al., 2004; Sutton et al., 1994), and co-deposition effects between SO2and NH3 exist (e.g.
Fowler et al., 2001), but data are limited. Further, the large
aerodynamic roughness of forests causes dry deposition of gases to be greater than to other ecosystems. Deposition of particles is also greatly enhanced over forests, although the reasons for this are not fully understood (e.g. Garland, 2001; Rannik et al., 2003; Ruijgrok et al., 1997). Indeed, many de-position processes to forests remain poorly-understood (see also Fowler and Erisman, 2003; Erisman et al., 2005; We-sely and Hicks, 2000), so measurements of deposition load to forests are very valuable for model evaluation, in order to ensure that models capture at least the magnitude of the load with reasonable accuracy.
Although the EMEP network itself has ca. 70 stations, these stations are spread over a large geographical area, with for example only 5 stations in Sweden and 8 stations in Ger-many in the year 2000. Given that we are attempting to eval-uate a model with grid-size of ca. 50×50 km2, there will al-ways be problems of knowing how representative individual stations are of such a large grid-size. The fewer stations to compare with, the more difficult it is to interpret such com-parisons.
The ICP-forest dataset has a quite dense spatial coverage, allowing us to use for example 41 sites in Sweden and 29 sites in Germany for this study. This number of stations should give a much better statistical basis for model evalu-ation than is possible with just the EMEP stevalu-ations, and gives more information about how the model deals with the gra-dients in the deposition. Further, although the ICP datasets have some important limitations (e.g. Erisman et al., 2003), with potential problems concerning the representativity of in-dividual sites (which introduces scatter in plots of model ver-sus measurement), an examination of the model results for a large number of sites should give a good idea of overall model biases.
Finally, the ICP measurements allow us to evaluate total deposition for sulphur, whereas the EMEP network only al-lows evaluation of sulphur wet-deposition. Given the fact that dry-deposition provides an important contribution to to-tal sulphur deposition, these measurements add a valuable extra check on overall model performance.
2 Measurements
The level II monitoring data used in the present study were collected from ICP-forests via the Forest Intensive Monitor-ing Co-ordinatMonitor-ing Institute, FIMCI (De Vries et al., 2001; ICP-Forests). FIMCI was set up as a contractor of the European Commission, to evaluate and validate ICP-forest data (UNECE/EC). The delivered data consisted of quality-assured monitoring data for the period 1997 through 2000.
For this study we have made use of the data from two of these years, chosen because of their very different patterns of precipitation, 1997 and 2000. Data comprised bulk precipi-tation in open fields, throughfall in coniferous and deciduous forest plots, and stemflow in some deciduous plots. As part
of the FIMCI quality control, obviously contaminated or un-realistic values had been removed from the data set. Sites with more than 50 days of missing data during a year were excluded from the study during that year.
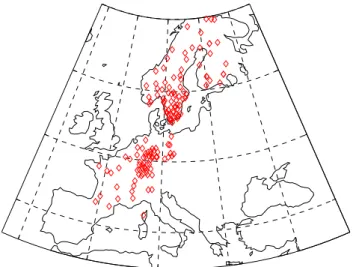
Missing values (ca. 3% of the data ) were filled-in by in-serting the monthly mean value for that parameter, site and year to enable calculations of annual deposition. Following the above procedures, data from many sites and countries were excluded from this comparison. Data from only seven European countries (Sweden, France, Norway, Finland, Ger-many, Ireland, and just 2 sites from Italy) fulfilled the strict quality-assurance criteria, giving 160 ICP sites in these seven countries distributed over 140 EMEP grid elements (Fig. 1). Although we use only a subset of the full ICP forests data, these sites cover a wide range of deposition levels.
Total deposition (wet, dry, and “occult” – due to fog/cloud water) to forests can be estimated by measuring throughfall, including stemflow (Draaijers et al., 1996). Such total de-position can only be quantified for ions which do not take part in the uptake and leaching processes in the canopy, e.g. sulphate, sodium and possibly also chloride (Hultberg and Grennfelt, 1992; Erisman and Draaijers, 1995). SO2 which
is taken up through the stomata is subsequently released (dis-solved in rainwater), so is included in the throughfall data. Thus, although S may be taken up temporarily in the crown, there is no retention, and throughfall is a good way of esti-mating total deposition. In this study, total deposition is only compared for sulphur.
Nitrogen in the form of both ammonium and nitrate, to-gether with most other plant nutrients, is strongly affected by canopy exchange (mainly uptake on the surface of the foliage), which affects throughfall composition. Unlike for S-species, N-species can be retained by the forest canopy, and throughfall is not a reliable indicator of total deposi-tion. Studies have shown that the level of N taken up by the canopy foliage is likely to be smaller in areas with a high N-deposition compared with nitrogen deficient regions (van Ek and Draaijers, 1991; De Vries et al., 2001; Hallgren Larsson et al., 1995). Different canopy exchange models have been proposed to separate between internal circulation and atmo-spheric deposition (Draaijers et al., 1996), but the uncertain-ties are relatively large (Erisman et al., 2005). For these rea-sons modelled total deposition from throughfall data is not used in this study for comparison with EMEP modelled de-position of N to forests. Only measured bulk dede-position of N in open field is compared with calculated wet deposition from the EMEP model.
The ICP deposition to deciduous forests is uncertain due to the limited data on stemflow. Based on the stemflow data which were available (four sites in Germany and two sites in Sweden), factors to derive total deposition, including stem-flow deposition, from throughfall deposition were derived. These factors were found to be 1.25 in Germany, and 1.1 in Sweden. The higher factor in Germany is due to a higher dry deposition, as sources are located closer to the forest sites in
Fig. 1. Location of ICP sites used in this study.
Germany than in Sweden. The German correction factor was applied to Germany, Denmark and France, since these coun-tries are likely more similar to Germany in terms of climate and sources than to Sweden, while the Swedish factor was applied only to Swedish data.
Inconsistent sampling periods complicate this comparison to some extent. ICP Forest data was collected at monthly intervals in Sweden and Finland, weekly in Ireland and parts of Germany, and on an irregular basis in Italy, Norway and some German counties. France collected data at 27 or 28 day intervals throughout the year (13 periods). Weekly or bi-weekly collections were transformed into monthly data if the break between resulting records fell within 4 days from the calendar months end.
It should be noted that although the ICP-Forest network forms an extensive and very useful data-set, there are limi-tations to the accuracy with which different components can be estimated. The variability of the data quality from the ICP Forest sites is large. There are several different sampling de-signs in use and the sites are not always representative for a larger area. Moreover, the sampling frequency can be very long (up to one month). An important uncertainty in this comparison is associated with the precipitation sampling. A field inter-comparison of different bulk collectors used in the ICP network has found it difficult to estimate precipitation volumes accurately (Draaijers et al., 2001). The deviation for precipitation volumes compared to the best estimate ranged from +103% to −27%. Deviations are caused by several fac-tors, such as aerodynamic properties and collecting area of the collector. A large field intercomparison of the precipita-tion measurements was conducted in Schagerbrug near the west coast of Netherlands in 2000 (Erisman et al., 2003). Precipitation collectors from 20 different countries partici-pated. Only 10–20% of the samples reached an accuracy of better than 10%. The conclusion from this comparison was clear; a better harmonisation of the sampling system in
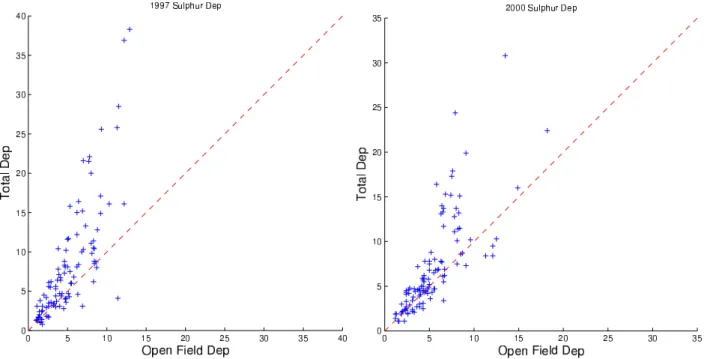
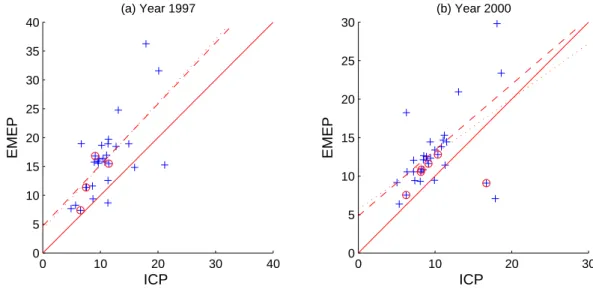
Fig. 2. Comparison of total deposition and open field deposition of S for ICP sites, 1997 and 2000. Units: kg(S) ha−1. Dashed line indicates 1:1 line.
ICP Forest is urgently needed. Erisman et al. (2003) also found that 65%, 50% and 45% of estimates for bulk pre-cipitation of SO2−4 , NO−3 and NH+4 respectively, were more than 20% different from the best estimates. Further examples from the ICP study are discussed in Erisman et al. (2005). It should be noted that even when monitored by high-quality rain-gauges by official Meteorological Institutes, rainfall es-timation is difficult. Smith and Fowler (2001) suggested that rainfall amounts for 5×5 km2areas in the UK could be un-certain by between 30%–50% on an annual time-scale.
Although we have tried to minimise the above problems, by making use of a severely restricted sub-set of the ICP data, an illustration of the difficulties that are still associ-ated with these data can be seen in Fig. 2, which compares TDEP (total deposition from throughfall in the forest) with WDEP (wet-deposition from the open field sites) for sulphur, for coniferous forests. Ideally, TDEP should be larger than WDEP, with the difference representing the dry deposition contribution to TDEP. This would always be true if contri-butions from occult deposition to TDEP, or of dry deposition to WDEP were small, and if the collection efficiencies of the samplers within and outside the forest were similar. How-ever, Fig. 2 shows that for deposition loads of less than ca. 15 kg(N) ha−1, WDEP frequently exceeds TDEP, sometimes by a factor of two. Studies within the Swedish network (Ug-gla et al., 2003) have suggested that the main reasons for such discrepancies are that the contributions of dry-deposition to the open-field collectors are sometimes significant (4–15% annually in Sweden), and that precipitation sampling is very difficult in wintertime. Partly this is because snowflakes are
much more sensitive to wind effects than rain, and partly as the use of snow-sacks in wintertime rather than funnels in-troduces additional uncertainty. Such sacks have strong aero-dynamic effects on the sampling, and were found to gener-ally give significantly higher amounts of precipitation (and poorer correlations) than those recorded at nearby Swedish Hydro-meteorological Institute (SMHI) sites. Similar prob-lems may affect other ICP-forest sites, depending on climate and air pollution levels. For example, Draaijers et al. (1996) showed that the open field bulk precipitation samples have a contribution from dry deposition of typically 5–30% for a site in the Netherlands, with this estimate derived from par-allel measurements with bulk and wet-only samplers.
Throughfall measurements are generally subject to differ-ent artefacts or processes (e.g. occult deposition). For exam-ple, a large number of samplers are needed within the mea-surement area (Draaijers et al., 1996). In Sweden for exam-ple, 10 samplers are used, which likely gives uncertainties of around 10–20% for sulphur and nitrogen deposition (Draai-jers et al., 1996; Uggla et al., 2003). In general though, ICP observations of total deposition via throughfall are likely to be more accurate than those of the open-field sites, since the latter are more subject to the artefacts caused by dry depo-sition, and aerodynamic problems with the precipitation col-lection.
2.1 Comparisons with EMEP sites
In order to put the comparison with ICP Forests data in con-text, we will also present briefly relevant comparisons against
wet deposition data from the standard EMEP network (Hjell-brekke, 2004). More detailed comparisons, albeit with ear-lier versions of the EMEP model have been presented in e.g. Fagerli et al. (2003) and Fagerli (2004). The objective is to see whether the same conclusions on model performance could be drawn using the EMEP data as when using the ICP data.
It can be noted that within EMEP similar compar-isons have been performed to the Schagerbrug study men-tioned above for the ICP network. Weekly precipitation measurements done by EMEP/CCC using wet only sam-plers (as recommended in the EMEP manual for sampling and analysis, http://www.nilu.no/projects/ccc/manual/index. html) were compared to local daily precipitation measure-ments using bulk collectors at three different sites in Norway, Poland and Czech Republic (Aas and Hjellbrekke, 2005). The difference in deposition was less than 7%, 13% and 19% for sulphate, nitrate and ammonium, respectively. Several EMEP sites measure the precipitation amount using an offi-cial meteorological rain gauge in addition to the bulk collec-tors or wet only sampler. The difference in volume is usually less than 10% (Hjellbrekke, 2005). These results are gen-erally better than seen in Schagerbrug comparison for the ICP sites. Unfortunately, the EMEP network has far fewer sites than ICP-forests, and no forest-specific measurements are available.
3 The Eulerian EMEP model
For this study, regional concentrations of sulphur and ni-trogen compounds have been calculated with the so-called OZONE version of the EMEP Unified Eulerian model, re-vision rv2 0. This model is a development from previous EMEP modelling activities (Berge and Jakobsen, 1998; Jon-son et al., 1999; SimpJon-son, 1995) and is fully documented in Simpson et al. (2003a) and Fagerli et al. (2004).
Briefly, the Eulerian EMEP model is a multi-layer atmo-spheric dispersion model for simulating the long-range trans-port of air pollution over several years. The model has 20 vertical layers in σ -coordinates and is primarily intended for use with a horizontal resolution of ca. 50×50 km2(at 60◦N) in the EMEP polar stereographic grid. The chemical scheme uses about 140 reactions between 70 species (Simpson et al., 1993; Andersson-Sk¨old and Simpson, 1999), and makes use of the EQSAM module of Metzger et al. (2002a,b) to de-scribe equilibria between the inorganic aerosol components. All versions of the model use meteorological data from PARLAM (Benedictow, 2002), a dedicated version of the operational HIRLAM model (High Resolution Limited Area Model) maintained and verified at the Norwegian Meteoro-logical Institute. The anthropogenic emission input data used by all model versions are generally based as far as possi-ble upon emissions reported per sector and grid officially reported to the Convention on Long-Range Transboundary
Air Pollution (e.g. Vestreng et al., 2004). The meteorologi-cal fields, including 3-dimensional cloud cover and precipi-tation, are available at 3 h intervals and are linearly interpo-lated to the intermediate timesteps. In PARLAM, different schemes are use for convective and stratiform condensation for cloud cover (Sundqvist et al., 1989; Sundqvist, 1993). Pa-rameterisation of the wet deposition processes in the Unified EMEP model includes both in-cloud and sub-cloud scaveng-ing of gases and particles, with scavengscaveng-ing ratios used to re-flect the solubilities of different gases, different collection efficiencies for fine and coarse particles. Details are given in Simpson et al. (2003a).
The dry deposition module makes use of a so-called “big-leaf” approach, with resistances for the stomatal and non-stomatal (external leaf-surface and ground surface) deposi-tion pathways. The stomatal conductance algorithm was originally developed for the calculation of ozone fluxes, and has been extensively documented (Emberson et al., 2000a,b,c; Simpson et al., 2001, 2003b; Tuovinen et al., 2001, 2004). The non-stomatal deposition of O3 is treated
with a resistance formulation for the external leaf-surface and the ground surface, along with an in-canopy resistance be-tween the leaf-level and ground-surface. The non-stomatal deposition of SO2 and NH3 (to leaf and ground surfaces)
builds upon relationships presented in Smith et al. (2000) and Nemitz et al. (2001) involving temperature, humidity and the ratio SO2/NH3, in an attempt to allow for so-called
co-deposition and surface acidity (Fowler and Erisman, 2003). Parameterisation of the non-stomatal component of dry de-position for other gases is done by interpolating between the values obtained for SO2and O3, depending on the solubility
and chemical reactivity of the gas in question, loosely based upon ideas presented in Wesely (1989). For NO2 a simple
compensation point approach is used, such that below 4 ppb no deposition occurs (consistent with observations presented in Walton et al., 1997; Fowler and Erisman, 2003; Duyzer and Fowler, 1994). Corrections for low temperature, snow cover and wetness are also applied for the different gases. Dry deposition of aerosol particles depends on their size, with the model version used here distinguishing between fine and coarse aerosols. Details of the parameterisations for both gases and particles are given in Simpson et al. (2003a).
The model also allows for calculations to different types of land-cover within each grid element. Dry deposition fluxes are calculated to a number of land-cover classes within each grid square, including temperate/boreal coniferous, Mediter-ranean coniferous forests, temperate/boreal deciduous, and Mediterranean broadleaf forests. For the purposes of this study we have used the deposition estimates from the two temperate/boreal forest classes, as these fit well with the dominant species from ICP-forests, namely Norway spruce (Picea abies) for coniferous, and beech (Fagus sylvatica) for deciduous. The resistance terms and deposition velocities are calculated independently over each land-cover, based upon vegetation characteristics such as height, leaf-area index, and
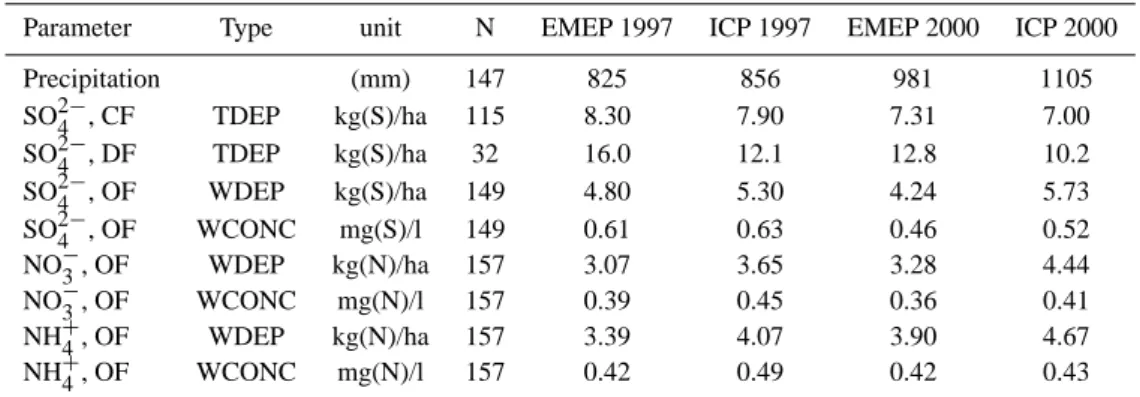
Table 1. Comparison of ICP Forest vs. EMEP model for 1997 and 2000. Table shows mean annual values of precipitation, total deposition
(TDEP) and volume weighted concentrations in precipitation (Conc.).
Parameter Type unit N EMEP 1997 ICP 1997 EMEP 2000 ICP 2000 Precipitation (mm) 147 825 856 981 1105 SO2−4 , CF TDEP kg(S)/ha 115 8.30 7.90 7.31 7.00 SO2−4 , DF TDEP kg(S)/ha 32 16.0 12.1 12.8 10.2 SO2−4 , OF WDEP kg(S)/ha 149 4.80 5.30 4.24 5.73 SO2−4 , OF WCONC mg(S)/l 149 0.61 0.63 0.46 0.52 NO−3, OF WDEP kg(N)/ha 157 3.07 3.65 3.28 4.44 NO−3, OF WCONC mg(N)/l 157 0.39 0.45 0.36 0.41 NH+4, OF WDEP kg(N)/ha 157 3.39 4.07 3.90 4.67 NH+4, OF WCONC mg(N)/l 157 0.42 0.49 0.42 0.43
Notes: DF for deciduous forest, CF for coniferous forest, and OF for open field. TDEP, WDEP, WCONC as described in Sect. 4.
phenology (Emberson et al., 2000b; Simpson et al., 2001). The greater height and associated roughness of forests leads to substantially greater deposition rates than are modelled over say grasslands or water surfaces.
4 Results and discussion
The monitored plots with coniferous and deciduous forests were matched with the corresponding EMEP grid element (ca. 50×50 km2). Deposition data for SO2−4 were com-pared for wet and total deposition separately. For NH+4 and NO−3 only observations of wet deposition data could be used in the comparison for reasons discussed above. Units used are given as kg (S or N) per hectare and year (1 kg ha−1yr−1=0.1 g m−2yr−1).
This study compares two completely different methods used to estimate deposition to forest locations: (a) measured data from a spot, normally a forest plot of around 30×30 m2, with varying exposure, tree species, leaf area index, etc.; and (b) model calculated average deposition to the same forest type in a corresponding grid square of size ∼50×50 km2. It should be kept in mind that both methods have uncertainties and no true values are available. Of course, scatter is to be expected when paring single sites with grid data, but system-atic differences between measurements at several monitored sites and model calculated values give valuable information on the causes and dimension of uncertainty. The comparison of modelled and observed data from 1997 and 2000 com-prises:
1. Precipitation amount,
2. Total deposition (here denoted TDEP) of SO2−4 to conif-erous and deciduous forests,
3. Wet deposition (here denoted WDEP) of SO2−4 , NO−3 and NH+4 in open field,
4. Concentrations (here denoted WCONC) of SO2−4 , NO−3 and NH+4 in precipitation
Total deposition from the ICP sites is represented by through-fall monitoring, representing both wet and dry deposition to forests, and wet deposition by bulk precipitation in open field sites. The results are compared to calculated total and wet deposition from the EMEP model. Results will be shown for each parameter as scatter plots. Additionally Tables 1–2 compare the annual means and summarise the statistical pa-rameters (intercept, slope and r2values) obtained with linear regression.
Examination of the precipitation amounts reported for the ICP network shows some large differences between data for 1997 and 2000. The most extreme case involved precip-itation of just 419 mm in 1997 but over 1200 mm in the year 2000. Although high inter-annual variability is a fre-quent and natural occurrence in precipitation patterns, it may also arise when sampling problems occur in one or both years. Such sampling problems are discussed further be-low (Sect. 4.1), but we can state that in general it is hard to judge how far high inter-annual variability can be ascribed to natural meteorological variability or to measurement arte-facts (e.g. loss of precipitation in windy conditions, Nespor and Sevruk, 1999; Smith and Fowler, 2001). In order to at least flag such sites, a precipitation variability index, PVI, has been defined, as a percentage:
PVI = 100 × 2 ×(P1997−P2000) (P1997+P2000) (1)
where P represents the annual precipitation. Where precipi-tation was missing for one year, we have assigned PVI=999 to indicate that PVI is unknown for this site. Almost half the sites have a PVI of less than 10%, whereas 18% show PVI values of greater than 20%. Although all data-points have been used in all statistics in this paper, points with PVI values greater than 20% (including those set at 999) are indi-cated (circled) in scatter plots.
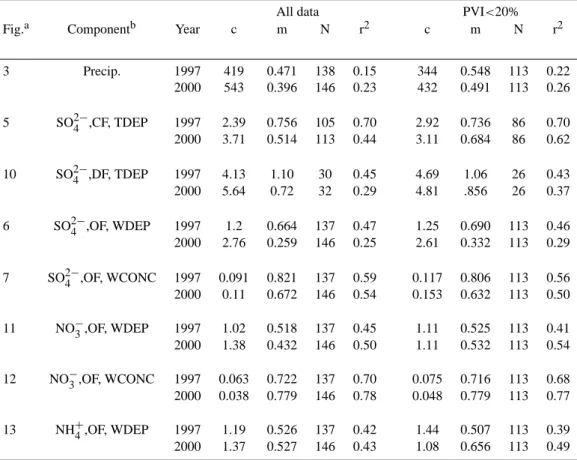
Table 2. Summary of statistical comparisons for 1997 and 2000. Tables give intercept (c), slope (m), number of points (N) and correlation
coefficients (r2) derived from linear regression of the scatter plots indicated.
All data PVI<20% Fig.a Componentb Year c m N r2 c m N r2
3 Precip. 1997 419 0.471 138 0.15 344 0.548 113 0.22 2000 543 0.396 146 0.23 432 0.491 113 0.26 5 SO2−4 ,CF, TDEP 1997 2.39 0.756 105 0.70 2.92 0.736 86 0.70 2000 3.71 0.514 113 0.44 3.11 0.684 86 0.62 10 SO2−4 ,DF, TDEP 1997 4.13 1.10 30 0.45 4.69 1.06 26 0.43 2000 5.64 0.72 32 0.29 4.81 .856 26 0.37 6 SO2−4 ,OF, WDEP 1997 1.2 0.664 137 0.47 1.25 0.690 113 0.46 2000 2.76 0.259 146 0.25 2.61 0.332 113 0.29 7 SO2−4 ,OF, WCONC 1997 0.091 0.821 137 0.59 0.117 0.806 113 0.56 2000 0.11 0.672 146 0.54 0.153 0.632 113 0.50 11 NO−3,OF, WDEP 1997 1.02 0.518 137 0.45 1.11 0.525 113 0.41 2000 1.38 0.432 146 0.50 1.11 0.532 113 0.54 12 NO−3,OF, WCONC 1997 0.063 0.722 137 0.70 0.075 0.716 113 0.68 2000 0.038 0.779 146 0.78 0.048 0.779 113 0.77 13 NH+4,OF, WDEP 1997 1.19 0.526 137 0.42 1.44 0.507 113 0.39 2000 1.37 0.527 146 0.43 1.08 0.656 113 0.49
Notes:aFig. refers to Figure number in this paper;bprefix “W” stands for concentration in precipitation. DF for deciduous forest, CF for coniferous forest, and OF for open field. See relevant figure for more details.
4.1 Precipitation
Table 1 compares the annual precipitation amounts of the EMEP model and ICP-forest networks, averaged across all stations. These grand-average results show very good agreement, within 4% for the year 1997 and 11% for 2000. The comparison for individual sites shows a very large scatter though (Fig. 3, Table 2), with low correlations (r2∼0.15−0.26). However, a close look at Fig. 3 shows that the low correlation is heavily influenced by the outliers. The vast majority of the points on this figure lie in a cluster, with precipitation values of between ca. 700–1300 mm. This clus-ter is centred near the 1:1 line. Excluding the few worst out-liers improves the correlation substantially.
Some of the scatter seen in Fig. 3 can be explained by the coarse resolution of the EMEP model. In reality, precipi-tation fields are very patchy (e.g. influenced by local topo-graphic effects), and the regional scale model is unable to resolve this sub-grid scale distribution. A typical problem arises with small-scale showers. In reality, precipitation is
high in a small area of a given grid, but a large fraction of the grid should remain dry. Within the model, however, this pre-cipitation is averaged out to cover the whole grid at a lower intensity. Thus, even though average precipitation amounts may be simulated well, the model predicts precipitation more often, but in lower amounts, than occur in reality.
However, some of the scatter is also likely due to problems in measuring precipitation. Although ICP have set up meth-ods for harmonising the sampling procedure within the ICP network (L¨ovblad et al., 2004), uncertainties associated with the collection of precipitation may still vary as the countries are free to select their own collectors. Indeed, the precipi-tation amount at the ICP sites is normally measured in the same collectors that sample precipitation for chemical analy-sis. However, precipitation is notoriously difficult to measure accurately, and as noted in Sect. 2, significant problems are known to affect ICP precipitation samples (Erisman et al., 2003; Draaijers et al., 2001; Uggla et al., 2003).
Figure 4 compares the spatial variation in the EMEP model’s precipitation field against the observed precipitation
0 1000 2000 3000 0 500 1000 1500 2000 2500 3000 3500
(a) Precipitation (mm), year 1997
ICP
EMEP
0 1000 2000 3000 0 500 1000 1500 2000 2500 3000ICP
EMEP
(b) Precipitation (mm), Year 2000Fig. 3. Precipitation in mm during 1997 and 2000, EMEP modelled vs. ICP bulk (open field). Circled points indicate sites with PVI>20%,
see Sect. 2. Solid line represents 1:1 fit, dotted and dashed lines represent regression lines for all data, and for data where PVI<20%, respectively (see Table 2).
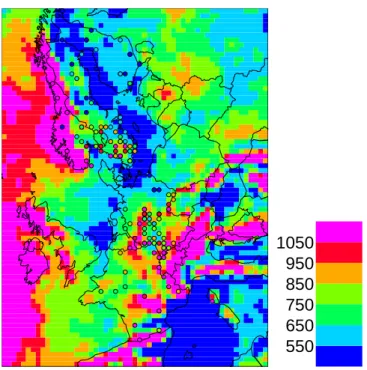
550
650
750
850
950
1050
Fig. 4. Yearly accumulated precipitation, mm yr−1. EMEP mod-elled precipitation vs. ICP (bullets) during 1997.
recorded at the ICP sites, for 1997. This plot shows that over much of Europe the ICP precipitation amounts are very simi-lar to the EMEP model data, for example in much of France, parts of Germany, and for most Norwegian and Finnish sites. The biggest discrepancies are seen in south-west Sweden, where the ICP data show annual precipitation levels of more than 1000 mm, whereas the EMEP model data shows lev-els of ca. 700–800 mm. According to the Swedish
Meteoro-logical Institute (SMHI), precipitation levels for this part of Sweden were around 500–1000 mm in 1997, suggesting that in this case the ICP levels are too high. SMHI have in fact compared measured rainfall volumes at ICP sites with their own measurement methods, and found that ICP samplers col-lected more (10–20%) in wintertime than SMHI samplers (see also Uggla et al., 2003). We will return to a discus-sion of these differences in connection with the deposition measurements, in Sects. 4.2–4.3.
Finally, it can be noted that the correlations between EMEP-model precipitation and precipitation measured in the EMEP/CCC measurement network were r2=0.29 and r2=0.42 for 1997 and 2000, respectively, better than those we obtain in comparison to the ICP data. Although we have restricted this comparison to the ICP sites showing the best performance in terms of sampling quality, the big differences between the correlations with the ICP and CCC networks are hard to explain. Site location or other factors may play a role, as will the problems already discussed for ICP sites (Sect. 2), but this finding suggests the need for continued investigation of these differences between the EMEP model and ments, ICP network, and national meteorological measure-ment networks.
4.2 Sulphur
Table 1 quantifies the mean values of modelled (EMEP) and observed (ICP) total deposition (TDEP) of SO2−4 in conif-erous forests, and wet depositions (WDEP) and concentra-tions (WCONC) at the open field sites. The modelled and observed data for 1997 are very similar, with differences of around 5% for TDEP, 9% for WDEP, and 3% for WCONC. The results for 2000 were somewhat worse, with differences
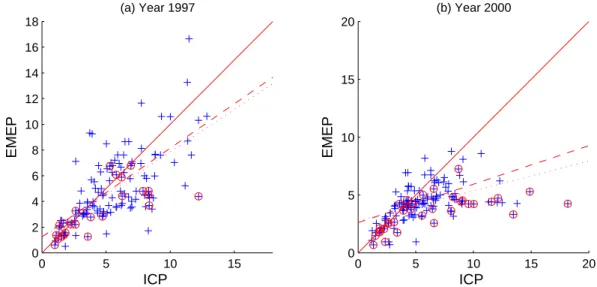
0 10 20 30 40 0 5 10 15 20 25 30 35 40 (a) Year 1997 ICP EMEP 0 10 20 30 40 0 5 10 15 20 25 30 35 40 ICP EMEP (b) Year 2000
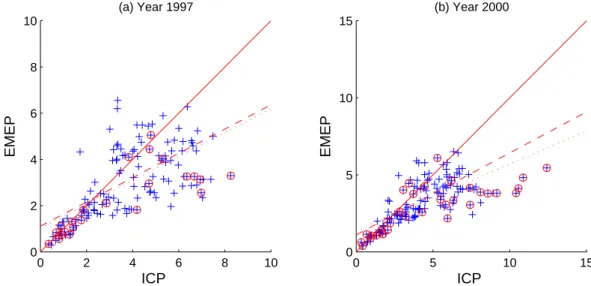
Fig. 5. Total deposition of SO2−4 in coniferous forests, kg(S) ha−1yr−1. EMEP modelled wet + dry vs. ICP throughfall during 1997 and 2000. Lines and symbols as per Fig. 3.
0 5 10 15 0 2 4 6 8 10 12 14 16 18 (a) Year 1997 ICP EMEP 0 5 10 15 20 0 5 10 15 20 ICP EMEP (b) Year 2000
Fig. 6. Wet Deposition of SO2−4 -S in open field, kg(S) ha−1yr−1. EMEP modelled wet vs. ICP bulk precipitation during 1997 and 2000. Lines and symbols as per Fig. 3.
of around 4% for TDEP, 26% for WDEP, and 12% for WCONC.
Figure 5 compares the modelled (EMEP) and observed (ICP) values of TDEP for SO2−4 in coniferous forests for 1997 and 2000. Figures 6–7 present corresponding results for WDEP and WCONC at the open field sites. The cor-relations (Table 2, Figs. 5, 7) for TDEP and WCONC are rather good during 1997 and 2000, especially if a few ICP sites with extremely high reported deposition values, or with PVI>20%, are excluded (figures include all points). Results for WDEP (Fig. 6) were significantly worse, however, espe-cially for the year 2000, with a significant number of ICP sites showing high depositions (>10 kg(S) ha−1) where the EMEP model shows around 5 kg(S) ha−1.
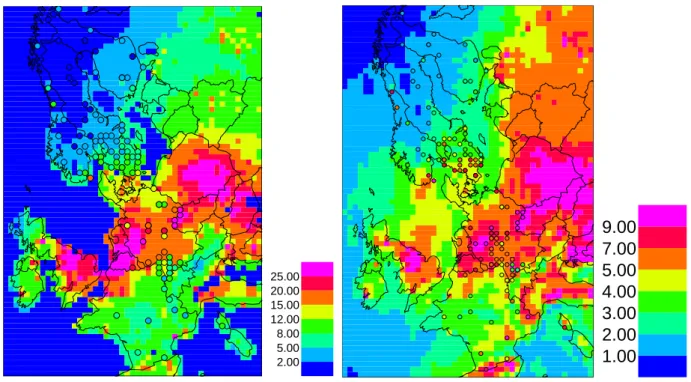
This can also be seen from Fig. 8 where the modelled fields of TDEP and WDEP for 1997 have been plotted together with ICP data. This figure for TDEP clearly shows a high degree of correlation between the EMEP and ICP estimates, with spatial gradients captured very well and no systematic errors across the sites. The corresponding results for WDEP show significantly higher ICP depositions in southern Swe-den and southern Norway than given by the EMEP model, and this discrepancy matches well that seen for precipitation in Fig. 4 (see Sect. 4.1). In other parts of Europe, the EMEP model and ICP network give rather similar results for both TDEP and WDEP. The discrepancies seen for southern Swe-den and Norway may well be associated with the problems of wintertime collection mentioned in Sect. 4.1.
0 0.5 1 1.5 2 2.5 0 0.5 1 1.5 2 2.5 (a) Year 1997 ICP EMEP 0 0.5 1 1.5 0 0.2 0.4 0.6 0.8 1 1.2 1.4 ICP EMEP (b) Year 2000
Fig. 7. Volume weighted concentrations of SO2−4 in precipitation, mg(S) l−1, EMEP modelled wet vs. ICP bulk precipitation during 1997 and 2000. Lines and symbols as per Fig. 3.
2.00 5.00 8.00 12.00 15.00 20.00 25.00
1.00
2.00
3.00
4.00
5.00
7.00
9.00
Fig. 8. Yearly average total deposition in coniferous forests (left) and open-field wet deposition (right) of SO2−4 , kg(S) ha−1yr−1. EMEP modelled (deposition field) vs. ICP (bullets) observed during 1997.
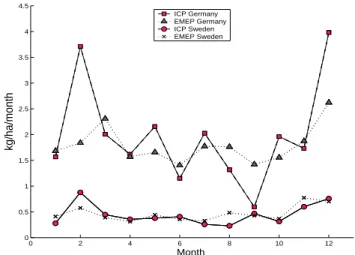
The monthly resolution of modelled and observed SO2−4 total deposition (to coniferous forests) was studied for 1997 with ICP sites in Germany (a high deposition area) and Swe-den (moderate deposition), for which monthly deposition data was available (Fig. 9). The results for the Swedish sites are reasonable throughout the year. However, for Germany the EMEP results are significantly lower than ICP in Febru-ary and December but significantly higher in September. It is unclear why the seasonal patterns should be so different
for Germany As one example, we have traced the big dif-ference in February to the influence of three sites in south-east Germany (near the Czech border). At these sites the measured TDEP is more than three times larger compared to the EMEP model. However the ICP TDEP is also much larger (factor 9) than the ICP open-field data. It is unclear why such extreme differences should occur, but, assuming that the measurements are correct, this suggests a very large contribution to the throughfall data from some source which
is not captured with the EMEP model. Such sources could include local emissions sources whose dispersion is not cap-tured by the model for this area and period, or some missing processes such as occult deposition. Detailed studies for this location would be needed to resolve this discrepancy in co-operation with the measurement experts responsible for the sites in question.
The modelled and observed total deposition of SO2−4 in deciduous forests, shown in Fig. 10, show lower correlations than seen for coniferous forests. As noted in Sect. 2 above, the ICP deposition to deciduous forests is uncertain (because of the limited number of stemflow data) and correction fac-tors were applied. With these corrections of the throughfall data, the EMEP model overestimates the total SO2−4 depo-sition in most cases. It is unclear why this should be so. Measurement artefacts may play a role, but it can be noted that the EMEP model tends to show quite similar annual de-positions to deciduous and coniferous forests, whereas some observations often show that coniferous forests are subject to greater deposition loads than deciduous, for both sulphur and nitrogen compounds (e.g. Rothe et al., 2002). Differences can be expected also due to the different bio-geophysical and chemical properties of deciduous and coniferous forests (e.g., biomass, roughness, rainfall interception, stomatal and non-stomatal conductances, ground foliage, and of course leaf area). However, up to this point it is still uncertain which of these parameters is most responsible for the differences. This discrepancy is puzzling, and can probably only be resolved using data from more heavily instrumented sites. This should be one of the priorities for future investigation.
Finally, we can mention that in comparison to measured wet deposition from the EMEP/CCC network, the EMEP model slightly overestimates the measured data. In 1997 and 2000 the average bias for the wet deposition of sulphur was just 10 and 8%, respectively (not shown). Given the uncertainties in the measured total depositions (e.g. 30%, see Draaijers et al., 1996), we can conclude that as far as total de-position to coniferous forests is concerned, the EMEP model seems to be consistent with both ICP and EMEP measure-ment data. The main unexplained discrepancy concerns the deposition to deciduous forests as discussed above.
4.3 Nitrogen deposition
As noted in Sect. 2 it is only possible to compare modelled and observed nitrogen deposition in precipitation, because canopy exchange (uptake) of nitrogen affects the chemical composition of throughfall. Open-field sites are used for this comparison, and Fig. 11 compares modelled and observed wet depositions of NO−3. The results show that many points lie along the 1:1 line, but the scatter is large. However, many of the points lying far from the 1:1 line are also those asso-ciated with PVI values of more than 20%, which may indi-cate data-problems rather than model problems. The mean values indicate an underestimation by EMEP, compared to
0 2 4 6 8 10 12 0 0.5 1 1.5 2 2.5 3 3.5 4 4.5 Month kg/ha/month ICP Germany EMEP Germany ICP Sweden EMEP Sweden
Fig. 9. Monthly average total deposition of SO2−4 in coniferous forests, kg(S) ha−1month−1, 41 ICP sites in Sweden and 10 ICP sites in Germany. EMEP modelled wet + dry vs. ICP throughfall during 1997.
ICP WDEP observations, of 16% in 1997 and 26% in 2000 (Table 1). For WCONC, the EMEP model values are lower than ICP by 13% in 1997 and 16% in 2000. The correla-tion between modelled and observed concentracorrela-tions of NO−3 is much higher (Fig. 12) compared to deposition. The com-parison between modelled and observed deposition of NH+4 (Fig. 13) in open field is similar to that for deposition of NO−3, but the pattern is somewhat more scattered for NH+4. In the same way as for nitrate and sulphate, the correlations between the ICP and the model data are higher for concen-trations in precipitation than for the depositions.
The spatial patterns of calculated and observed wet depo-sitions are illustrated in Figs. 14 and 15 for oxidised and re-duced nitrogen respectively. These plots show mixed results, with values for oxidised nitrogen coinciding very well over most of France and northern Germany, but with the ICP sites showing significantly higher depositions in southern Norway and Sweden. For NH+4 similar findings are found in southern Scandinavia (ICP deposition values are greater than EMEP modelled), but in south-west Germany EMEP model deposi-tions are also clearly lower than ICP values.
These differences can to some extent be explained by the different precipitation amounts in the EMEP model and ICP open-field network, similar to that discussed for sulphur (Sect. 4.2). Comparing Figs. 14 and 15 with Fig. 4, the largest differences between EMEP model values of nitrogen wet deposition and ICP data, are found for the same sites that show the largest deviations for the precipitation data (Fig. 4). Corresponding plots for concentrations in precipitation (e.g. Fig. 16 for NO−3) show a much larger correspondence be-tween EMEP model and ICP data. Compared to the wet de-position results, it seems that the EMEP model gives con-centrations of N in precipitation which are more similar to
0 10 20 30 40 0 5 10 15 20 25 30 35 40 (a) Year 1997 ICP EMEP 0 10 20 30 0 5 10 15 20 25 30 ICP EMEP (b) Year 2000
Fig. 10. Total deposition of SO2−4 in deciduous forests, kg(S) ha−1yr−1. EMEP modelled wet + dry vs. ICP throughfall + stemflow during 1997 and 2000. Lines and symbols as per Fig. 3.
the ICP network, so some of the differences in WDEP can be explained by differences in the precipitation amounts at the open-field sites. However, the EMEP model’s WCONC val-ues still underpredict the ICP network valval-ues in some areas, especially in southern Scandinavia, and suggest a systematic problem with either the model or the measurements in this region.
We can compare these results to those obtained in com-parison to the EMEP/CCC measurement data. In this case both oxidised and reduced nitrogen depositions are underes-timated by the EMEP model in both years, with the same magnitude as in the comparison with ICP data. NO−3 in precipitation is 15% and 23% lower than EMEP observa-tions in 1997 and 2000, respectively, whilst NH+4 in pre-cipitation is underestimated by approximately 10% in both years. The correlation coefficients (r2=0.37 for WDEP, 0.59 for WCONC) between model and measurements were rather similar to those found against the ICP network for oxidised nitrogen, and better (r2=0.48 for WDEP, 0.55 for WCONC) for reduced nitrogen.
Thus, both this comparison against ICP data and that against EMEP data suggest that the EMEP model system-atically underpredicts the levels of both oxidised and re-duced nitrogen. If we regard the WCONC comparison as most reliable for the ICP data (since it avoids some of the problems associated with precipitation sampling), both the ICP and EMEP measurement comparisons suggest that the EMEP model underpredicts N-deposition by around 10% on average. Although this actually represents a good level of agreement for regional transport modelling of nitrogen com-pounds, this may be an indication of problems in the atmo-spheric chemistry or scavenging of these compounds, or of the emissions.
4.4 Comparison with other models
A previous analysis by Schaap et al. (2004), who compared inorganic aerosol fields over Europe with the regional air quality model LOTOS, indicated good agreement for mean levels of air concentrations (within 10–20%), and correla-tion coefficients of around r2∼0.27–0.38. Results for con-centrations in precipitation were much worse, however, and this was partly attributed to the lack of in-cloud scavenging in the model. As well as problems with precipitation, this study also concluded that there were too few reliable data sets on NO3/HNO3and NH3/NH4in Europe, and that high
time-resolution data are needed to test the diurnal variations of species involved in N-chemistry. Problems with the repre-sentation of ammonia were also highlighted. Such problems are not apparent in our study, possibly because forest sites are less affected by local ammonia emissions than the sites in more agricultural areas (see also Simpson et al., 2006).
Mathur and Dennis (2003) considered model performance for sulphate, nitrate and ammonium concentrations and de-positions over the Eastern United States using a modified version of the RADM model (Chang et al., 1987). Model results for SO2−4 and NO−3 were found to be moderate to good (r2=0.4–0.7), but much worse for NH+4. This work suggested severe problems with the NH3emission
invento-ries used in the United States. Similarly, Adams et al. (1999) have compared these compounds with results from a global model, including some comparisons for EMEP measurement sites, obtaining good performance for SO2−4 , with geometric means within 4% for the EMEP stations, degrading to within 63% for NH+4. Again, some of these problems may be due to the emissions inventories used in specific regions, but be-cause of the coarse scale of the applied model (4◦latitude by 5◦longitude), it is not expected to capture the high spatial
0 2 4 6 8 10 0 2 4 6 8 10 (a) Year 1997 ICP EMEP 0 5 10 15 0 5 10 15 ICP EMEP (b) Year 2000
Fig. 11. Wet Deposition of NO−3 in open field, kg(N) ha−1yr−1. EMEP modelled wet vs. ICP bulk precipitation during 1997 and 2000. Lines and symbols as per Fig. 3.
0 0.2 0.4 0.6 0.8 1 0 0.2 0.4 0.6 0.8 1 (a) Year 1997 ICP EMEP 0 0.2 0.4 0.6 0.8 1 0 0.2 0.4 0.6 0.8 1 ICP EMEP (b) Year 2000
Fig. 12. Volume weighted concentrations of NO−3 in precipitation, mg(N) l−1, EMEP modelled wet vs. ICP bulk precipitation during 1997 and 2000. Lines and symbols as per Fig. 3.
variability of especially NH3and non-linearities in the
chem-istry.
Poor agreement between modelled and observed wet de-position fluxes was found in a regional model intercompari-son in Europe (van Loon et al., 2004). In general, all studies (including our own) find that modelling of wet depositions is more difficult than for air concentrations. In the COSAM global model intercomparison (Roelofs et al., 2001), it was concluded that cloud-related processes in the sulphur cycle display the largest model to model variability, and this was the dominant cause of differences. This study suggested that future model studies should address the validation of the spa-tial and temporal distributions of simulated cloud fields
(in-cluding precipitation formation), and also carry out compar-isons with observed wet deposition fluxes in order to assess the representativity of computed wet deposition fluxes. Note that in connection with the latter recommendation, the study presented in this paper is as far as we are aware the most comprehensive attempt to date to evaluate the wet deposition fluxes of any model over European forest areas.
Differences in model formulation, available emission in-ventories, and also in chemical climate between Europe and other parts of the World preclude the direct application of conclusions drawn from many of these studies to the EMEP model or to the situation over Europe. For example, we believe that the emission inventories used by EMEP over
0 5 10 15 0 5 10 15 (a) Year 1997 ICP EMEP 0 5 10 15 0 5 10 15 ICP EMEP (b) Year 2000
Fig. 13. Wet Deposition of NH+4-N in open field, kg(N) ha−1yr−1. EMEP modelled wet vs. ICP bulk precipitation during 1997 and 2000. Lines and symbols as per Fig. 3.
1.000 2.000 3.000 4.000 5.000 7.000
Fig. 14. Yearly average wet deposition of oxidised nitrogen, kg(N) ha−1yr−1. EMEP modelled wet deposition (deposition field) vs. ICP (bullets) during 1997.
Europe have reasonable quality, as evidenced by the good agreement found for air concentrations of S and N com-pounds. Uncertainties remain of course, especially for am-monia, but in general the emissions are probably not the weakest part of the EMEP modelling system. However, the results of the above model studies indicate strongly the uncertainties surrounding the modelling of the inorganic,
1.000 2.000 3.000 4.000 5.000 7.000
Fig. 15. Yearly average wet deposition of reduced nitrogen, kg(N) ha−1yr−1. EMEP modelled wet deposition (deposition field) vs. ICP (bullets) during 1997.
and especially nitrogen-containing, components of the at-mospheric aerosol, and of cloud and precipitation processes. The chemical problems can only be tackled by comparison with good-quality measurements, as noted above, and such data are currently too limited in Europe to enable a good eval-uation of the chemical cycling in models. Many of the prob-lems associated with cloud and precipitation processes are
inherently difficult, and very much in the domain of Meteo-rological research. However, there are some possibilities for work with finer scale meteorological and air pollution mod-els – this will be discussed further below.
5 Discussion and conclusions
This paper has presented a comparison of the results of the EMEP chemical transport model with a data-set never before used in the evaluation or formulation of the model, that of the EU/ICP Forest (Level II) monitoring network. Modelled data from 1997 and 2000 were compared with observed deposi-tion data from 160 sites from this network. The components that were compared consisted of (1) Precipitation amount, (2) Total deposition (TDEP) of SO2−4 to coniferous and de-ciduous forests, (3) Wet deposition (WDEP) of SO2−4 , NO−3 and NH+4 in open field, and (4) Concentrations (WCONC) of SO2−4 , NO−3 and NH+4 in precipitation at open-field sites.
It should be stressed that this study compares two com-pletely different methods for estimating deposition to forest locations: (a) measured data from a spot, normally a for-est plot of around 30×30 m2, with varying exposure, tree species, leaf area index, etc.; and (b) model calculated av-erage deposition to the same forest type in a corresponding grid square of size ∼50×50 km2. It should be noted that the EMEP model cannot be expected to reproduce small-scale variations in deposition regimes, caused by such factors as local emissions (especially important for NH3, e.g. Sutton
et al., 1998) and topography (which has strong effects on rainfall amount and deposition, e.g. Dore et al., 1992; Fowler et al., 1988), or where relevant processes that are not included in the model (e.g. occult deposition) are important. Further, as discussed in Sect. 4.1, the model has problems with sub-grid precipitation, and simulates precipitation more often, but in lower amounts, than reality. As precipitation scavenging is a complex and non-linear process (e.g. Barrie, 1992), such issues will cause errors in modelled wet deposition. On the other hand, it should be kept in mind that there are many uncertainties inherent in the deposition monitoring methods themselves.
Despite these difficulties, differences in mean values be-tween modelled and observed SO2−4 , NO−3 and NH+4 total and wet deposition were within 20% in 1997 and 30% in 2000, with the EMEP model showing slightly slightly lower values than the observations. Modelled and observed con-centrations of SO2−4 , NO−3 and NH+4 in precipitation are very similar on average (differences of 0–14%), and the corre-lation between modelled and observed data rather high for this type of comparison (between r2=0.4–0.8 for most com-ponents and years). The spatial pattern of total S deposi-tion was reproduced very well by the model. For the wet depositions of both S and N components, the overall spa-tial patterns were captured quite well, but systematic differ-ences were found in especially southern Norway and
Swe-0.200
0.400
0.600
0.800
1.000
Fig. 16. Yearly average concentrations in precipitation of oxidised
nitrogen, mg(N) l−1. EMEP modelled (concentration field) vs. ICP (bullets) during 1997.
den. These discrepancies for sulphur, and partly for nitrogen components, can probably be explained by problems with precipitation sampling in winter-time in these regions, which leads to quite different precipitation amounts in the ICP net-work and the EMEP model for these sites. In contrast to the results found for wet deposition, the spatial distribution of SO2−4 in precipitation was reproduced very well across Eu-rope. For NO−3 and NH+4 the concentrations in precipitation were reproduced well in most areas, but with some regions where the EMEP model showed much lower concentrations than ICP forest data.
Concerning precipitation, the EMEP model and ICP net-work showed very similar overall levels (within 4% for 1997 and 11% for 2000). The correlation was poor (r2=0.15–0.23), but this can be attributed partly to the influence of a few out-liers, combined with a small range of rainfall amounts for most points. As the range of the deposition data was much greater than that of precipitation, these poorer results for pre-cipitation do not have a major influence on the correlations found for deposition or concentrations. Some of the sites showing large discrepancies between the EMEP model and ICP data were found to have unusually high inter-annual vari-ability in the precipitation amounts registered by ICP, sug-gesting that some differences may be due to sampling proce-dures or complex topographic effects which the model can-not resolve.
Concerning the measurements, improved quality control of the ICP deposition network, or at least some procedure to
flag or quantify uncertainties, would make these data more useful for evaluation of air pollution models. Further work to improve the quality of precipitation collection at the ICP-forest sites will also improve their applicability for model-evaluation, and of course for estimation of deposition fields in Europe.
Concerning the model results, a number of main findings have emerged from this study which need further investiga-tion:
1. Coniferous versus deciduous forests. One unexplained problem is that the EMEP model seems to give much higher depositions to deciduous forests than those sug-gested by the ICP sites (albeit with few sites available for comparison). In fact, the EMEP model predicts similar deposition rates to deciduous forests as conif-erous, whereas this study (and others) would suggest that overall deposition should be smaller for deciduous forests. This discrepancy can not yet be explained, and more analysis concerning the role of different ecosys-tem properties, and the role of wet and dry deposition, is needed. Such analysis should be supported using data from more heavily instrumented sites, combined with more detailed micro-meteorological modelling ap-proaches.
2. Concurrent analysis with other pollution measurements will also help in understanding the sources of any dis-crepancies between modelled and monitored deposi-tion amounts. It would be particularly helpful to have more detailed knowledge of the different gas, aerosol and precipitation N-components, for example with dif-ferentiated HNO3, NH4NO3, NH3, in order to test the
model’s partitioning and deposition contributions from these species.
3. For evaluation of the precipitation amounts in the mod-els (and indeed the measurements), comparison with na-tional meteorological data, in consultation with nana-tional experts, is more likely to give a better guide to model performance than comparison with air pollution net-work data. Meteorological netnet-works use gauges specif-ically designed to maximise the collection of rainfall, whereas rain-gauges used in air pollution networks are designed as a compromise between the needs of the chemical and precipitation analysis. (Still, it can be noted that even Meteorological network data have un-certainties, e.g. Førland, 1996).
4. It is clear from this study that the model’s ability to re-produce precipitation plays a key role in estimating de-position amounts. Indeed, numerical weather predic-tion (NWP) models in general have problems in repro-ducing precipitation patterns, both in time and space, and such problems are exacerbated in regions with com-plex terrain where orographic effects can play a large
role. An improved resolution of the NWP models (to say 5×5 km2or finer) would help in resolving fine-scale features, but such a resolution would be too computer-resource demanding for application at the European scale within chemical-transport models. However, it may well be beneficial to explore the benefits and im-portance of such fine-scale modelling for smaller do-mains.
5. Some statistical down-scaling of model results to enable better comparability with measurements, especially in regions which show complex orographic effects on pre-cipitation patterns may be an option for future investi-gations.
Although more work is needed to understand these discrep-ancies, the overall conclusion is that the EMEP model per-forms rather well in reproducing patterns of S and N deposi-tion to European forests.
Acknowledgements. The work of O. Westling, S. Hellsten and
J. C. Knulst was funded by the Swedish ASTA programme. The work of H. Fagerli and D. Simpson was supported by the European Commission’s Fifth Framework Program in the form of the NOFRETETE Project (contract No. EVK2-CT2001-00106), and by the Co-operative Programme for Monitoring and Evaluation of the Long-range Transmission of Air pollutants in Europe (EMEP) under UNECE. Thanks are due to W. Aas from the Norwegian Institute for Air Research for valuable comments, and to 4 anony-mous referees whose comments led to significant improvements in the manuscript.
Edited by: F. X. Meixner
References
Aas, W. and Hjellbrekke, A.-G.: Data quality 2003, quality as-surance and field comparisons, EMEP/CCC Report 6/2005, The Norwegian Institute for Air Research (NILU), Kjeller, Norway, 2005.
Adams, P., Seinfeld, J., and Koch, D.: Global concentrations of tropospheric sulfate, nitrate, and ammonium aerosol simulated in a general circulation model, J. Geophys. Res., 104, 13 791– 13 828, 1999.
Amann, M., Bertok, I., Cofala, J., Gyarfas, F., Heyes, C., Klimont, Z., and Sch¨opp, W.: Integrated assessment modelling for the Protocol to abate acidification, eutrophication and ground level ozone in Europe, Tech. Rep. 132, Ministry of Housing, Spatial Planning and the Environment, luch & Energie Report, 1999. Andersson-Sk¨old, Y. and Simpson, D.: Comparison of the
chemi-cal schemes of the EMEP MSC-W and the IVL photochemichemi-cal trajectory models, Atmos. Environ., 33, 1111–1129, 1999. Barrie, L.: Scavenging ratios: black magic or a useful scientific
tool?, in: Proc. of 5th Int. Conf. on Precipitation Scavenging and Atmosphere-Surface Exchange Processes, edited by: Schwartz, S. and Slinn, W., vol. 1. the Georgii volume; Precipitation scav-enging processes, p. 403–420, Hemisphere Publ. Corp., Wash-ington, D.C., 1992.
Benedictow, A.: 1999 meteorological fields produced by PARLAM-PS and used as input for Eulerian EMEP model. Doc-umentation and characterization, Tech. rep., The Norwegian Me-teorological Institute, Oslo, Norway, 2002.
Berge, E. and Jakobsen, H. A.: A regional scale multi-layer model for the calculation of long-term transport and deposition of air pollution in Europe, Tellus, 50, 205–223, 1998.
Bobbink, R., Horning, M., and Roelofs, J.: The effects of air-borne nitrogen pollutants on species diversity in natural and semi-natural European vegetation, J. Ecology, 86, 717–738, 1998. Chang, J., Brost, A., Isaksen, I., Madronich, S., Middleton, P.,
Stockwell, W., and Walcek, C.: A three-dimensional Eulerian acid deposition model: Physical concepts and formulation, J. Geophys. Res., 92, 14 681–14 700, 1987.
De Vries, W., Reinds, G., Van der Salm, C., Draaijers, G., Bleeker, A., Erisman, J., Au´ee, J., Gundersen, P., Kristensen, H., Van Dobben, H., De Zwart, D., Derome, J., Voogd, J., and Vel, E.: Intensive Monitoring of Forest Ecosystems in Europe, Tech. Rep. 2001a, UN/ECE, EC, Forest Intensive Monitoring Co-ordinating Institute, 177 pp, 2001.
Dore, A., Choularton, T., and Fowler, D.: An improved wet deposi-tion map of the United Kingdom incorporating the seeder-feeder effect over mountaneous terrain, Atmos. Environ., 26A, 1375– 1381, 1992.
Dorsey, J., Duyzer, J., Gallagher, M., Coe, H., Pilegaard, K. Wes-trate, J., Jensen, N., and Walton, S.: Oxidised nitrogen and ozone interaction with forests. I: Experimental observations and analy-sis of exchange with Douglas fir, Quart. J. Roy. Meteorol. Soc., 130, 1941–1955, 2004.
Draaijers, G., Erisman, J., Spranger, T., and Wyers, G.: The appli-cation of throughfall measurements for atmospheric deposition monitoring, Atmos. Environ., 30, 3349–3361, 1996.
Draaijers, G., Bleeker, A., van der Veen, D., Erisman, J., Mols, J., Fonteijn, P., and Geusebroek, M.: Field intercomparison of throughfall, stemflow and precipitation measurements performed within the framework of the Pan European Intensive Monitoring Program of EU/ICP forests, TNO report R 2001/140, TNO-MEP, Apeldoorn, 2001.
Duyzer, J. and Fowler, D.: Modelling land atmosphere exchange of gaseous oxides of nitrogen in Europe, Tellus, 46B, 353–372, 1994.
Duyzer, J., Deinum, G., and Baak, J.: The interpretation of mea-surements of surface exchange of nitrogen oxides: corrections for chemical reactions, Phil. Trans. R. Soc. Lond. A, 351, 231– 248, 1995.
Emberson, L., Ashmore, M., Cambridge, H., Simpson, D., and Tuovinen, J.: Modelling stomatal ozone flux across Europe, En-viron. Pollut., 109, 403–414, 2000a.
Emberson, L., Simpson, D., Tuovinen, J.-P., Ashmore, M., and Cambridge, H.: Towards a model of ozone deposition and stom-atal uptake over Europe, EMEP MSC-W Note 6/2000, The Nor-wegian Meteorological Institute, Oslo, Norway, 2000b. Emberson, L., Wieser, G., and Ashmore, M.: Modelling of stomatal
conductance and ozone flux of Norway spruce: comparison with field data, Environ. Pollut., 109, 393–402, 2000c.
Erisman, J. and Draaijers, G.: Atmospheric deposition in relation to acidification and eutrophication, Studies in Environmental Re-search, 63, 1995.
Erisman, J., Vermeulen, A., Hensen, A., Flechard, C., D¨ammgen,
U., Fowler, D., Sutton, M., Gr¨unhage, L., and Tuovinen, J.: Monitoring and modelling of biosphere/atmosphere exchange of gases and aerosols in Europe, Environ. Pollut., p. 403–413, 2005. Erisman, J. W., M¨ols, H., Fonteijn, P., Geusebroek, M., Draaijers, G., Bleeker, A., and van der Veen, D.: Field intercomparison of precipitation measurements performed within the framework of the Pan European Intensive Monitoring Program of EU/ICP Forest, Environ. Pollut., 125, 139–155, 2003.
Fagerli, H.: Air concentrations and depositions of acidifying and euthrophying components, status 2002, in: Transboundary acidi-fication, eutrophication and ground level ozone in Europe, EMEP Status Report 1/2004, p. 77–107, The Norwegian Meteorological Institute, Oslo, Norway, 2004.
Fagerli, H., Simpson, D., and Aas, W.: Model performance for sul-phur and nitrogen compounds for the period 1980 to 2000, p. 1– 66, The Norwegian Meteorological Institute, Oslo, Norway, in: Transboundary Acidification, Eutrophication and Ground Level Ozone in Europe, EMEP Status Report 1/2003, Part II Unified EMEP Model Performance, 2003.
Fagerli, H., Simpson, D., and Tsyro, S.: Unified EMEP model: Updates, in: Transboundary acidification, eutrophication and ground level ozone in Europe, EMEP Status Report 1/2004, p. 11–18, The Norwegian Meteorological Institute, Oslo, Norway, 2004.
Førland, E. J.: Manual for operational correction of Nordic precipi-tation data, The Nordic Working Group on Precipiprecipi-tation, DNMI Klima Report 24/96, The Norwegian Meteorological Institute, Oslo, Norway, 1996.
Fowler, D. and Erisman, J.: Biosphere/Atmosphere Exchange of Pollutants. Overview of subproject BIATEX-2, in: Towards Cleaner Air for Europe – Science, Tools and Applications, Part 2. Overviews from the Final Reports of the EUROTRAC-2 Sub-projects, edited by: Midgley, P. M. and Reuther, M., Mar-graf Verlag, Weikersheim, also available from http://www.gsf. de/eurotrac/publications/, 2003.
Fowler, D., Cape, J., Leith, I., Choularton, T., Gay, M., and Jones, A.: The influence of altitude on rainfall composition at Great Dun Fell, Atmos. Environ., 22, 1355–1362, 1988.
Fowler, D., Sutton, M. A., Flechard, C., Cape, J. N., Storeton-West, R., Coyle, M., and Smith, R. I.: The control of SO2dry
depo-sition on to natural surfaces by NH3and its effects on regional
deposition, Water, Air and Soil Pollution, 1, 39–48, 2001. Ganzeveld, L., Lelieveld, J., Dentener, F., Krol, M., and Roelofs,
G.-J.: Atmosphere-biosphere trace gas exchanges simulated with a single-column model, J. Geophys. Res., 107, 4297, doi:10. 1029/2001JD000684, 2002.
Garland, J.: On the size dependence of particle deposition, Water, Air and Soil Pollution: Focus, 1, 323–332, 2001.
Hallgren Larsson, E., Knulst, J., Malm, G., and Westling, O.: De-position of acidifying compounds in Sweden, Water, Air and Soil Pollution, 85, 2271–2276, 1995.
Hjellbrekke, A.-G.: Data Report 2002 Acidifying and eutrophying compounds, EMEP/CCC Report 1/2004, The Norwegian Insti-tute for Air Research (NILU), Kjeller, Norway, 2004.
Hjellbrekke, A.-G.: Data Report 2003 Acidifying and eutrophying compounds, EMEP/CCC Report 3/2005, The Norwegian Insti-tute for Air Research (NILU), Kjeller, Norway, 2005.
Hultberg, H. and Grennfelt, P.: Sulphur and seasalt deposition as reflected by throughfall and runoff chemistry in forested
![[PDF] Cours Programmation Excel | Télécharger PDF](data:image/gif;base64,R0lGODlhAQABAIAAAP///wAAACH5BAEAAAAALAAAAAABAAEAAAICRAEAOw==)