Emergence of a linear tracer source from air concentration measurements
57
0
0
Texte intégral
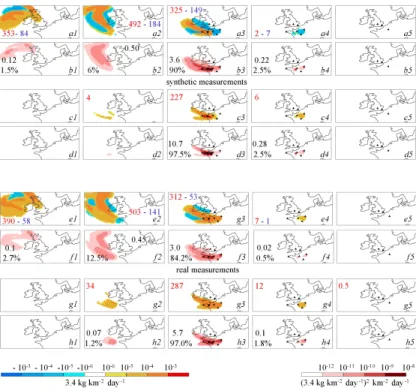
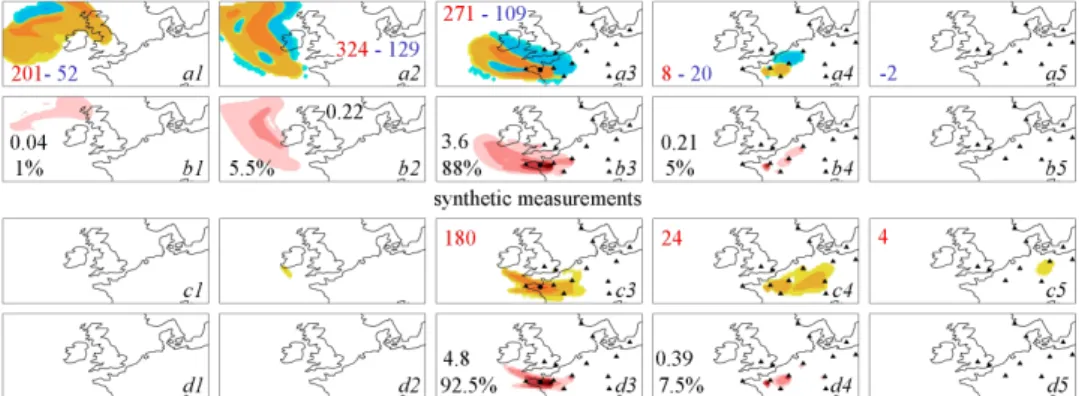
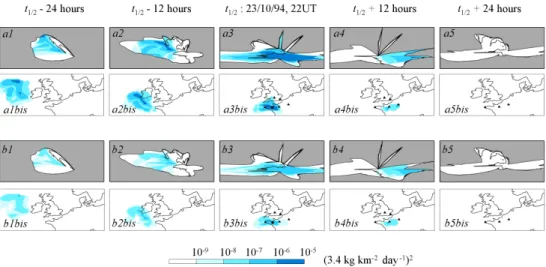
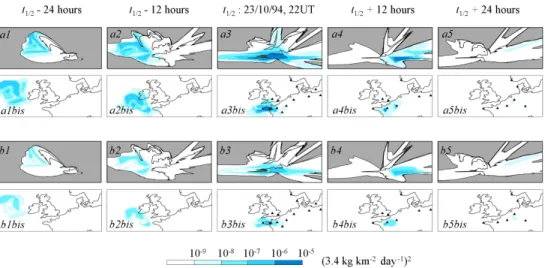
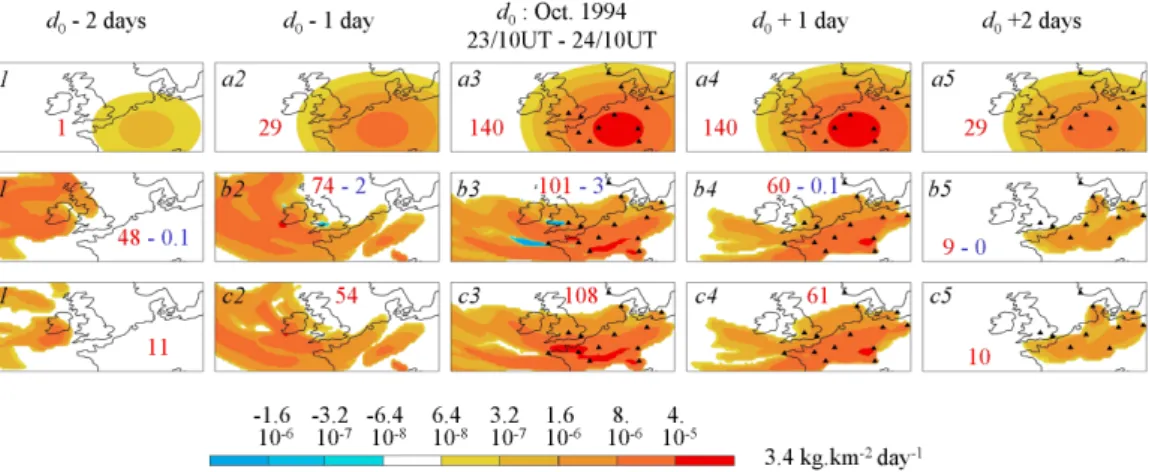
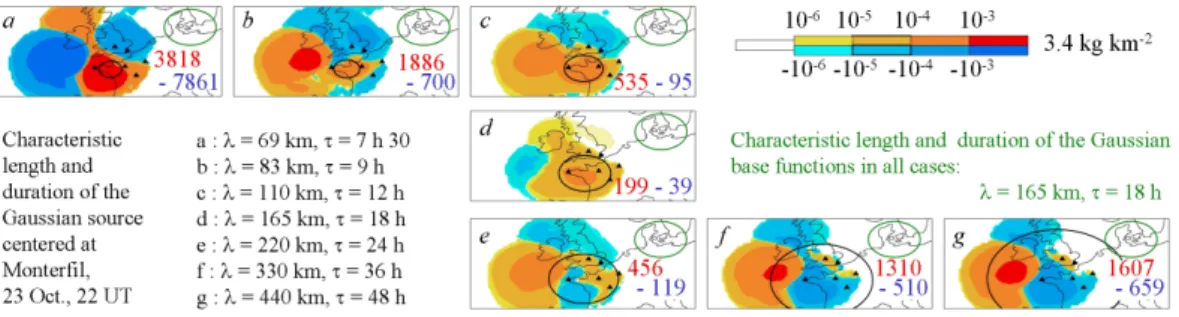
Figure
+7
Documents relatifs