HAL Id: hal-00300824
https://hal.archives-ouvertes.fr/hal-00300824
Submitted on 21 Feb 2002HAL is a multi-disciplinary open access
archive for the deposit and dissemination of sci-entific research documents, whether they are pub-lished or not. The documents may come from teaching and research institutions in France or abroad, or from public or private research centers.
L’archive ouverte pluridisciplinaire HAL, est destinée au dépôt et à la diffusion de documents scientifiques de niveau recherche, publiés ou non, émanant des établissements d’enseignement et de recherche français ou étrangers, des laboratoires publics ou privés.
The flux of carbonyl sulfide and carbon disulfide
between the atmosphere and a spruce forest
X. Xu, H. G. Bingemer, U. Schmidt
To cite this version:
X. Xu, H. G. Bingemer, U. Schmidt. The flux of carbonyl sulfide and carbon disulfide between the atmosphere and a spruce forest. Atmospheric Chemistry and Physics Discussions, European Geosciences Union, 2002, 2 (1), pp.181-212. �hal-00300824�
ACPD
2, 181–212, 2002
The flux of carbonyl sulfide and carbon
disulfide Xu et al. Title Page Abstract Introduction Conclusions References Tables Figures J I J I Back Close Full Screen / Esc
Print Version Interactive Discussion
c
EGS 2002 Atmos. Chem. Phys. Discuss., 2, 181–212, 2002
www.atmos-chem-phys.org/acpd/2/181/ c
European Geophysical Society 2002
Atmospheric Chemistry and Physics Discussions
The flux of carbonyl sulfide and carbon
disulfide between the atmosphere and a
spruce forest
X. Xu1,*, H. G. Bingemer1, and U. Schmidt1
1
Institute for Meteorology and Geophysics, University of Frankfurt, P.O. Box 111932, 60054 Frankfurt am Main, Germany
*
now at Max Planck Institute for Chemistry, Mainz, Germany
Received: 9 January 2002 – Accepted: 19 February 2002 – Published: 21 February 2002 Correspondence to: X. Xu ([email protected])
ACPD
2, 181–212, 2002
The flux of carbonyl sulfide and carbon
disulfide Xu et al. Title Page Abstract Introduction Conclusions References Tables Figures J I J I Back Close Full Screen / Esc
Print Version Interactive Discussion
c
EGS 2002 Abstract
Turbulent fluxes of carbonyl sulfide (COS) and carbon disulfide (CS2) were measured over a spruce forest in Central Germany using the relaxed eddy accumulation (REA) technique. A REA sampler was developed and validated using simultaneous mea-surements of CO2 fluxes by REA and by eddy correlation. REA measurements were 5
conducted during six campaigns covering spring, summer, and fall between 1997 and 1999. Both uptake and emission of COS and CS2by the forest were observed, with de-position occurring mainly during the sunlit period and emission mainly during the dark period. On the average, however, the forest acts as a sink for both gases. The aver-age fluxes for COS and CS2are −93 ± 11.7 pmol m−2s−1and −18 ± 7.6 pmol m−2s−1, 10
respectively. The fluxes of both gases appear to be correlated to photosynthetically active radiation and to the CO2 and H2O fluxes, supporting the idea that the air-vegetation exchange of both gases is controlled by stomata. An uptake ratio COS/CO2 of 10 ± 1.7 pmol µmol−1 has been derived from the regression line for the correlation between the COS and CO2fluxes. This uptake ratio, if representative for the global ter-15
restrial net primary production, would correspond to a sink of 2.3 ± 0.5 Tg COS yr−1.
1. Introduction
The tropospheric abundance (∼ 500 ppt) and long tropospheric lifetime (2–7 years) of carbonyl sulfide (COS) makes it the major source of the stratospheric background aerosol (Crutzen,1976;Engel and Schmidt, 1994), which plays a role in the Earth’s 20
radiation budget and in heterogeneous reactions causing chemical ozone destruction
(Lacis et al.,1992;Rodriguez et al.,1991;Grainier and Brasseur,1992).
COS is released to the atmosphere by oceans, biomass burning, oxidation of CS2 and DMS, and several anthropogenic sources (tire wear, aluminium production, coal combustion, sulfur recovery, etc.), and is removed by terrestrial vegetation, soils, pho-25
ACPD
2, 181–212, 2002
The flux of carbonyl sulfide and carbon
disulfide Xu et al. Title Page Abstract Introduction Conclusions References Tables Figures J I J I Back Close Full Screen / Esc
Print Version Interactive Discussion
c
EGS 2002 Davis,1993;Andreae and Crutzen,1997;Watts,2000). Terrestrial vegetation is
rec-ognized as a dominant sink of atmospheric COS, but the magnitude of this sink has not been satisfactorily quantified. The uptake of COS by vegetation was first observed
by Taylor et al. (1983) and Kluczewski et al. (1983,1985) during laboratory chamber
experiments with synthetic air containing 120 ppb and 4 ppb of COS, respectively. 5
Brown and Bell (1986) obtained a preliminary estimate of the global vegetation sink
of 2–5 Tg COS yr−1, based on data from Kluczewski et al. (1983, 1985). However, air-vegetation exchange of COS depends on the mixing ratio level of this gas (e.g.
Kesselmeier and Merk,1993). Therefore, estimates of the global COS uptake by
veg-etation that are derived from experiments employing largely enhanced COS levels will 10
not be representative of the real natural conditions. Laboratory experiments with crops conducted byGoldan et al. (1988) showed that the uptake of COS and CO2 for atmo-spheric levels and under daylight conditions has a common pathway, i.e., through the open stomata, and that the transport resistances for both gases are virtually the same. This similarity ledGoldan et al.(1988) to estimate the COS vegetation sink on the ba-15
sis of the atmospheric mixing ratios of COS and CO2 and the primary productivity of terrestrial plants. They reported an uptake rate ranging from 0.2 to 0.6 Tg COS yr−1, one order of magnitude smaller than the estimate ofBrown and Bell(1986).
Enzymological studies revealed that all enzymes involved in CO2 assimilation can metabolize COS, with carbonic anhydrase (CA) being the key enzyme which cat-20
alyzes the hydrolysis of COS to CO2 and H2S (Protoschill-Krebs and Kesselmeier,
1992;Protoschill-Krebs et al., 1995,1996). According to this finding, all living higher
plants should be able to consume COS. This view is consistent with laboratory re-sults (Kluczewski et al.,1983,1985;Taylor et al.,1983;Goldan et al.,1988;Fried et al.,
1993; Kesselmeier and Merk, 1993). However, it is not generally supported by field
25
studies. While some in-situ experiments clearly showed uptake of COS by plants or soil/plant systems (Mihalopoulos et al.,1989;Hofmann et al.,1992;Bartell et al.,1993;
Dippel and Jaeschke,1996; Kuhn et al., 1999), other measurements found either no
de-ACPD
2, 181–212, 2002
The flux of carbonyl sulfide and carbon
disulfide Xu et al. Title Page Abstract Introduction Conclusions References Tables Figures J I J I Back Close Full Screen / Esc
Print Version Interactive Discussion
c
EGS 2002 position and emission (Kesselmeier et al.,1993;Hofmann, 1993;Huber,1994). This
indicates that the role of vegetation under natural conditions is more complicated. The air-plant exchange of COS appears to be bidirectional and dependent on the ambient COS mixing ratio, the environmental conditions, the plant type, etc. A compensation point, at which deposition equals emission, was observed during experiments of the 5
air-plant exchange of COS (Rennenberg et al., 1991; Kesselmeier and Merk, 1993;
Huber,1994;Dippel and Jaeschke,1996). It varies from 90 to 515 ppt and is usually
lower than the tropospheric level of COS (∼ 500 ppt), suggesting that vegetation tends to take up COS in most cases. The air-plant exchange flux of COS was often found to be correlated to the CO2 assimilation rate, to photosynthetically active radiation (PAR) 10
and to the H2O flux (Kesselmeier and Merk, 1993; Kesselmeier et al., 1993; Bartell et al.,1993;Hofmann,1993;Huber,1994), implying the importance of plant physiolog-ical processes in controlling the COS exchange rate. The close relationship between COS uptake and CO2fixation is an encouraging finding, as it allows an estimate of the global vegetation sink of COS on the basis of the observed uptake ratio COS/CO2and 15
the terrestrial plant productivity. Assuming that the ratio of the COS and CO2 uptake equals the ratio of the atmospheric burden of both gases,Kesselmeier and Merk(1993) obtained a vegetation sink of 0.86–1.0 Tg COS yr−1. This figure is at the high end of the estimated range of 0.16–0.91 Tg COS yr−1 reported by Chin and Davis (1993). How-ever, the actual value of this COS sink might be larger, since it was observed that the 20
plants investigated prefer to take up COS over CO2, as indicated byKesselmeier and Merk (1993).
Only a few studies have been made on the air-plant exchange of CS2. Most of the earlier studies (Adams et al.,1981;Steudler and Peterson,1985;Goldan et al.,1987;
Lamb et al.,1987;Hines and Morrison,1992) reported emission of CS2from vegetated
25
soils. Castro and Galloway (1991) demonstrated that those chamber measurements employing sulfur-free sweep gases resulted in artificial release of CS2and COS. Dur-ing the experiments ofTaylor et al.(1983), vegetation uptake was observed at a high CS2level of 120 ppb. Fall et al.(1988) found indirect evidence for the uptake of CS2by
ACPD
2, 181–212, 2002
The flux of carbonyl sulfide and carbon
disulfide Xu et al. Title Page Abstract Introduction Conclusions References Tables Figures J I J I Back Close Full Screen / Esc
Print Version Interactive Discussion
c
EGS 2002 wheat at lower ambient levels. Gradient measurements of sulfur gases in a loblolly pine
forest did not reveal any evidence of CS2uptake by the trees (Berresheim and Vulcan, 1992). More recent field and laboratory studies (Hofmann, 1993; Kesselmeier et al.,
1993; Huber, 1994; Dippel and Jaeschke, 1996) indicate that CS2 is both deposited
to and emitted from soil/plant systems. It is presently not clear which physiological 5
process influences and controls the exchange of CS2 between the atmosphere and plants.
Considering the high variability of the exchange rates of COS and CS2between the atmosphere and terrestrial plants, present databases are obviously not adequate to allow a reliable estimate of global vegetation sinks for both gases. More field measure-10
ments on major ecosystems are required to improve our understanding of the role of terrestrial vegetation in the atmospheric cycle of COS and CS2.
Dynamic enclosure and gradient methods are commonly used for measuring COS uptake by plants. In the former, the chamber disturbs the natural microclimate and the results have only a limited spatial representativity. The latter method overcomes these 15
problems and measures the surface fluxes on an ecosystem scale, but the assumptions of the gradient method are not always tenable. The method is not recommended for measuring the surface fluxes over tall vegetation, such as forests (den Hartog and Neu-mann,1984). The widely adopted eddy correlation (EC) method needs fast-response sensors, which are unavailable for many species. A modified method, the relaxed eddy 20
accumulation (REA), also known as conditional sampling (CS), overcomes the need for fast-response sensors and has proven a promising technique for measuring fluxes using slow-response gas sensors (Oncley et al.,1993;Pattey et al.,1993,1999; Bev-erland et al.,1996;Moncrieff et al.,1998). According to Businger and Oncley(1990), the gas flux is expressed as
25
Fc= βσw(c+− c−), (1)
where c+ and c− are the average concentrations (pmol m−3) associated with updrafts and downdrafts, respectively, β is a dimensionless coefficient, and σw is the standard
ACPD
2, 181–212, 2002
The flux of carbonyl sulfide and carbon
disulfide Xu et al. Title Page Abstract Introduction Conclusions References Tables Figures J I J I Back Close Full Screen / Esc
Print Version Interactive Discussion
c
EGS 2002 deviation of the vertical windspeed (m s−1).
We have developed a REA sampler and used it to measure COS and CS2 fluxes over a spruce forest. In the following sections we present some details of the REA sampler and its validation. The measurements of the COS and CS2fluxes by REA are discussed.
5
2. Experimental
2.1. Site
Measurements were made on a plateau in the Solling Mountains, Germany (51◦460N, 9◦ 350E, 505 m a.s.l). The plateau extends about 1300 m and has a slight downward slope of 1◦ 200 towards east. Fig.1 shows a scheme of the research site. REA flux 10
measurements were taken from a 52 m meteorological tower of the Institute for Biocli-matology (IFB), University of G ¨ottingen.
The site is covered mainly by Norway Spruce (Picea abies) planted in 1888, with a tree density of 461 trees ha−1 (Ellenberg et al., 1986). The average canopy height of the spruce stand is about 30 m and the leaf area index is about 7. A beech stand 15
(Fagus sylvatica) with a canopy height of about 29 m is located south and southwest of the tower. The small triangle-shaped area located about 200 m northwest of the tower represents younger spruces of about 20 m height. There are some beech patches to the southeast of the tower. If these beech patches are neglected, the spruce fetch ex-tends 200–300 m in the south and southwest directions and up to 600–1500 m in other 20
directions from the tower (Ibrom et al.,1996). The largest source area extent (or the footprint) of the site, i.e., the maximum upwind distance from which the observed flux can originate, has been estimated byLaubach et al.(1994) andIbrom et al.(1996). For the measurement height of this work (39 m),Laubach et al.(1994) predicted that 80% of the flux originates from a distance between 0 and 600 m under neutral conditions. 25
ACPD
2, 181–212, 2002
The flux of carbonyl sulfide and carbon
disulfide Xu et al. Title Page Abstract Introduction Conclusions References Tables Figures J I J I Back Close Full Screen / Esc
Print Version Interactive Discussion
c
EGS 2002 obtained a maximum extent of the source area ranging from 200 m during daytime to
600 m during the night. Therefore, the fetch requirements for flux measurements are met during daytime even in the worst case, i.e., southwest wind. Inhomogeneous fetch may be encountered during nocturnal measurements, which only account for 2% of flux measurements in this work.
5
Soils at the site are characterized as cambisol with a pH value of 3.5 (Ellenberg et al., 1986). The soils are covered by a humus layer of 5 cm depth. Herbs, such as Trientalis europea, Avenella flexuosa, Galium harcynium, are the dominant ground plants. They cover 40% of the area. In addition, about 10% of the ground is covered by moss species, such as Dicranella heteromalla, Polytrichum formosum, etc.
10
The climate of the site is characterized as montane (sub-oceanic / sub-continental). The annual mean temperature is 6.6◦C. The maximum and minimum monthly mean temperatures are approximately 18◦C (July) and 4◦C (February), respectively. The an-nual precipitation is about 1045 mm, with relatively large interanan-nual variations. There is no clear dry or wet season at the site. The prevailing wind direction is west. More 15
details about the site are described byEllenberg et al. (1986), Laubach et al. (1994),
andIbrom et al.(1996).
2.2. Sampling
Samples were collected at a platform at 39 m altitude using a REA sampler depicted in Fig.2. A 3-dimensional sonic anemometer-thermometer with a USA-1 sensor (Metek) 20
was used for monitoring wind components and the virtual temperature. Wind and tem-perature data were recorded at a rate of 10 Hz. Three computer controlled Teflon solenoid valves (Cole Parmer) were employed to direct upstream and downstream air into two different sample reservoirs.
Bags with a volume of 9 L, made of Tedlar PVF film (5 µm, Du Pont), were used 25
as sample reservoirs. They were protected by polystyrene boxes, which on one hand prevented photochemical reactions in the samples, and on the other hand could easily be transported. Before sampling, the bags were evacuated and then connected to the
ACPD
2, 181–212, 2002
The flux of carbonyl sulfide and carbon
disulfide Xu et al. Title Page Abstract Introduction Conclusions References Tables Figures J I J I Back Close Full Screen / Esc
Print Version Interactive Discussion
c
EGS 2002 solenoid valves. During sampling, air from the height of the anemometer sensor was
drawn at a rate of 2200 ml min−1 through a 3 m Teflon FEP tubing (1/800O. D., 1/1600I. D.) by a Teflon diaphragm pump (N86 KTE, KNF Neuberger). This flow of compressed air was split in two sub-streams. A flow of 600 ml min−1, set by a mass flow controller (MFC, 0–1000 ml min−1, Bronk Horst), was directed to the selected reservoir, and the 5
remainder was vented.
The sampling period was 30 min. The effective sampling time was, however, less than 30 min, because a deadband (wd) was applied, i.e. an interval of the vertical wind speed in which air was not accumulated in the reservoir for up or downdraft, if |w| ≤wd. The use of a deadband increases the concentration differences between the two sam-10
ple reservoirs and prolongs the lifetime of the valves (Pattey et al.,1993;Oncley et al.,
1993; Valentini et al., 1997; Xu, 2001). To establish a suitable deadband, a test run
(3–5 min) was made before each REA sampling. The turbulence intensity (σw), as de-rived from the vertical wind data during the test run, was taken as a reference to select the value of wd. wd was usually set to less than 0.2σw, corresponding to an effective 15
sampling period of 25–30 min.
Although the sampling system can be operated at 10 Hz, the valves were switched at 5 Hz, with a few exceptions only. This prolongs the valve’s lifetime without significant reduction in the accuracy of the flux measurements. This is confirmed by the good agreement between the sensible heat fluxes obtained by REA simulations at sampling 20
frequencies 5 Hz and 10 Hz, respectively (Xu,2001).
The lag time, i.e. the travel time of air from the intake point to the switching valve, is estimated to be 1.0 s, based on the flow rates and dead volume of the tubing. This lag time was taken into account in the control program.
Damping of concentration fluctuations in the tubing due to mixing may cause an 25
underestimate of flux. However, an estimate of this effect using formulae ofLeuning and Moncrieff (1990) showed that the reduction of flux is negligible even under extreme conditions. Therefore, no correction of the damping effect is necessary. More details about this REA sampler are discussed inXu(2001)
ACPD
2, 181–212, 2002
The flux of carbonyl sulfide and carbon
disulfide Xu et al. Title Page Abstract Introduction Conclusions References Tables Figures J I J I Back Close Full Screen / Esc
Print Version Interactive Discussion
c
EGS 2002 2.3. Sample analysis
Air samples were analyzed for COS, CS2 and CO2 within 3 hour after sampling. The inertness of the Tedlar film ensures that loss and production of these trace gases in the bags are negligible during storage. Ambient air can be stored in the bags for more than 10 h without significant changes in the COS and CS2contents (Xu,2001)
5
COS and CS2 were measured using a gas chromatograph (GC, HP 6890, Hewlett Packard) with a flame photometric detector (FPD, Tracor). Figure3shows the analyzing system. The mixing ratios of COS and CS2 in the bags were measured by multiple analysis of 0.4–0.5 L aliquots from the bags. Each bag was analyzed at least 3 times. Samples were cryogenically focused (liquid Argon, −186◦C) in a capillary glass trap 10
(20 cm × 2 mm I. D.) filled with 2–3 cm silanized glasswool. Water vapor in the air samples was removed by passing the sample through a Nafion dryer (Perma Pure, KNF Neuberger), operated with a counterflow of dry air (Drierite, Cole Parmer). This method has proved to be effective and economical.
The sulfur compounds were separated on a 50×1/800Teflon column packed with Chro-15
mosil 310 (Supelco). Nitrogen (99.999%, Messer Griesheim) was used as a carrier gas. For optimal separation within a short time (4–5 min), a pressure program was used instead of the conventional temperature program. The carrier gas pressure at the inlet of the column was controlled by the electronic pneumatic control (EPC) of the GC. The oven temperature was set to 30 ± 0.1◦C. A typical pressure program was: (1) start 20
at 280 kPa and hold for 0.1 min, (2) decrease to 120 kPa at a rate of 240 kPa min−1and hold for 2 min, and (3) increase to 340 kPa at a rate of 1000 kPa min−1 and holding for 1.7 min.
The GC/FPD system was calibrated daily by injecting standard samples with a gas tight Teflon/glass syringe (Precision sampling Corp.). The standard gas mixture (0.6– 25
1 ppm COS and 0.1–0.25 ppm CS2) was produced by a permeation dilution device kept at 30 ± 0.1◦C (Haunold). The permeation rates were determined by weighing the permeation tubes (VICI Metronics) every one or two months with an electronic balance
ACPD
2, 181–212, 2002
The flux of carbonyl sulfide and carbon
disulfide Xu et al. Title Page Abstract Introduction Conclusions References Tables Figures J I J I Back Close Full Screen / Esc
Print Version Interactive Discussion
c
EGS 2002 (0.01 mg, Sartorius). The relative standard deviation of the permeation rates is less
than 10%.
Most of the samples were also analyzed for CO2, using a Li-6262 infrared CO2 / H2O analyzer (LI-COR). Pressure changes in the sample cell were measured by a pressure transducer (6262-03, LI-COR). The LI-6262 was programmed to automati-5
cally correct for the influence of pressure and H2O fluctuations on CO2measurements due to dilution and pressure broadening. Slight zero and span drifts were corrected using working standards, which were calibrated against secondary standards at the Institute for Stratospheric Chemistry, Research Center J ¨ulich, Germany, that can be traced to the Scripps CO2calibration scale.
10
2.4. Other measurements
Continuous eddy correlation measurements of the CO2, H2O and heat fluxes as well as measurements of meteorological parameters were conducted by the IFB. The EC measurements of the CO2and H2O fluxes were made at the same height as the REA sampling, at 39 m above the ground. The same sonic anemometer-thermometer was 15
used for the EC and REA measurements. The sensor of the instrument was mounted at the end of a metal bar of 2.5 m length, which was pointed towards west. The CO2 and H2O mixing ratios at the height of the sonic sensor were continuously measured at 10 Hz, using a second LI-6262. An automatic daily two point calibration of the system was made for both CO2 and H2O, using CO2 calibration gases and a stable capaci-20
tive humidity sensor, respectively. More details about the instrumentation and the EC measurements were described byLaubach et al.(1994) andIbrom et al.(1996).
The fluxes of COS and CS2 between the soil and the atmosphere were measured at several positions within 30 m distance from the tower. Three dynamic chambers in parallel were exposed to the ground. The chambers were flushed with ambient air. 25
Air samples of the in- and outflow of the chambers were collected in Tedlar bags, and analyzed as described in Sect. 2.3. The results are reported in detail bySteinbacher
ACPD
2, 181–212, 2002
The flux of carbonyl sulfide and carbon
disulfide Xu et al. Title Page Abstract Introduction Conclusions References Tables Figures J I J I Back Close Full Screen / Esc
Print Version Interactive Discussion
c
EGS 2002 (2000) andSteinbacher et al.(2002)
2.5. Assessment of errors
The turbulent flux Fc of a trace gas c was calculated using Equation 1. σw and β are derived from wind and temperature data measured by the sonic anemometer-thermometer. c+ and c− are obtained as averages of at least three concentration 5
measurements in samples of the respective bags.
According to the error propagation theory, the relative systematic error in Fc may be estimated by ∆Fc Fc = ∆σw σw + ∆β β + ∆(c+− c−) c+− c− , (2)
where∆Fc, ∆σw, ∆β, and ∆(c+− c−) are the absolute systematic errors in F c, σw, 10
β, and (c+ − c−), respectively. The three terms at the right-hand side of Eq. (2) are estimated to be less than 2%, 5%, and 3%, respectively (Xu, 2001). Therefore, the accuracy for the flux measurements is estimated to be better than 10%.
The relative random error in Fc is given by
δF c Fc = v u u t δσ w σw !2 + δβ β !2 + δ(c+−c−) c+− c− !2 , (3) 15 where δF
c, δσw, δβ, and δ(c+−c−) are the absolute random errors in Fc, σw, β, and (c+−c−), respectively. Detailed considerations (Xu,2001) show that δ
(c+−c−)/(c+− c−)
is normally dominant among the three error sources at the right-hand side of Eq. (3). Because of the relatively small |c+− c−| values, and the less perfect precision in the GC measurements of COS and CS2, δ(c+−c−)/(c+− c−) was as large as 10-100% in
20
ACPD
2, 181–212, 2002
The flux of carbonyl sulfide and carbon
disulfide Xu et al. Title Page Abstract Introduction Conclusions References Tables Figures J I J I Back Close Full Screen / Esc
Print Version Interactive Discussion
c
EGS 2002 close to zero, it was even larger than 1000%. Consequently, with a few exceptions,
random errors in σwand β contribute only negligibly to the overall precision of the COS and CS2 fluxes. CO2 could be measured at higher precision than sulfur gases. In spite of the small differences between c+ and c− for CO
2, the relative random error in (c+− c−) for CO
2was smaller than 10% in most cases. This is about the same order 5
of magnitude as the relative random errors in σw and β.
3. Results and discussion
3.1. Validation of the REA sampler
To verify the reliability of the REA sampler, CO2 flux measurements were intercom-pared with those from EC measurements by IFB. 94 pairs of CO2 fluxes measured 10
simultaneously by REA and EC techniques are plotted in Fig.4. Although there are some outliers, the overall agreement is good. The regression line indicates a slight overestimate of the CO2 deposition flux by REA. Considering the standard errors of the intercept and the slope, 0.55 and 0.06, respectively, this overestimate is not signif-icant. The 95% confidence belt covers the 1:1 line, suggesting a reliable performance 15
of the REA system under most conditions.
3.2. COS and CS2fluxes
Six campaigns of 10 to 15 days were conducted in August and September of 1997, in September of 1998, and in May, July and September–October of 1999, respectively. The observed fluxes ranged from −497 to 311 pmol m−2s−1for COS and from −305 to 20
236 pmol m−2s−1 for CS2, indicating that the spruce forest can both take up and emit COS as well as CS2. Uptake of both gases occurred mainly during the sunlit period, whereas emission was observed mostly at night (see Sect.3.4 for details). On the average, the forest is a sink for atmospheric COS and CS2. The average fluxes are
ACPD
2, 181–212, 2002
The flux of carbonyl sulfide and carbon
disulfide Xu et al. Title Page Abstract Introduction Conclusions References Tables Figures J I J I Back Close Full Screen / Esc
Print Version Interactive Discussion
c
EGS 2002 −93 ± 11.7 pmol m−2s−1for COS and −18 ± 7.6 pmol m−2s−1for CS2.
Soil chamber measurements at the site showed that the soil always acted as a sink for atmospheric COS (Steinbacher, 2000). However, based on the average flux of −0.81 ± 0.24 pmol m−2s−1, the soil sink of COS accounts for only less than 1% of the mean deposition of COS into the ecosystem, as observed in the REA measurements. 5
The air-soil exchange of CS2, ranging from −0.11 pmol m−2s−1 to 0.23 pmol m−2s−1, is also negligibly small compared to the exchange flux of CS2 between the forest and the atmosphere. Therefore, the COS and CS2fluxes observed by the REA technique are mainly caused by the air-vegetation exchange.
For the purpose of comparison, the values of the observed deposition fluxes of COS 10
and CS2were converted to deposition velocities relative to the leaf area. The deposi-tion velocity for COS averaged 1.1 ± 0.7 mm s−1. This agrees well with deposition ve-locities obtained in other laboratory and in situ studies (Taylor et al.,1983;Kluczewski et al., 1985; Goldan et al., 1988; Kesselmeier and Merk, 1993; Huber, 1994; Kuhn, 1997) although quite different plant species were investigated in most of these studies. 15
The deposition velocity for CS2averaged 5.4 ± 5.9 mm s−1. CS2 deposition velocities reported byHuber(1994) andTaylor et al.(1983) range from 0 to 1.5 mm s−1.
3.3. Seasonal variations
Field experiments covered the seasons of spring, summer and fall. Because of unsuit-able weather conditions (cold, snow coverage, etc.), no field experiment was carried 20
out in the winter months. Table1 lists statistical data for the REA measurements of COS and CS2 fluxes in different seasons and years. Data for CO2 fluxes are also presented in this table.
During all seasons, COS on the average was taken up by the forest, although emis-sion was observed sometimes during individual measurements. The largest COS de-25
position was observed in September of 1997, the smallest in September of 1998. There is no clear seasonal variation of the COS flux due to the large year-to-year fluctuation
ACPD
2, 181–212, 2002
The flux of carbonyl sulfide and carbon
disulfide Xu et al. Title Page Abstract Introduction Conclusions References Tables Figures J I J I Back Close Full Screen / Esc
Print Version Interactive Discussion
c
EGS 2002 in fall. CS2 flux data show a net deposition in August, September and October and a
minor, but insignificant net emission in May and July. The CO2flux data show a clear seasonal variation, with larger CO2 deposition observed in later spring and in sum-mer, and a smaller deposition in fall. This seasonal variability is consistent with the continuous measurements of CO2flux at the same site (Ibrom et al.,1996).
5
3.4. Diurnal variations
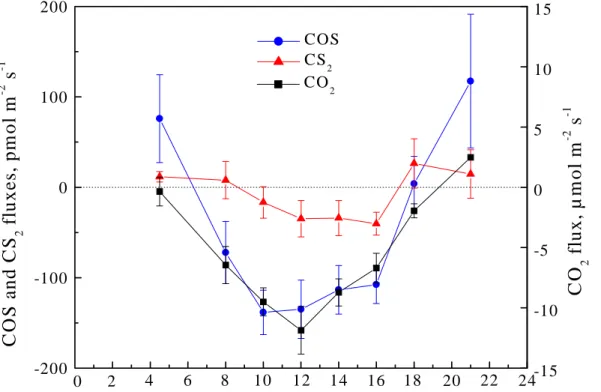
Because of the high variability of the COS and CS2 fluxes and the small number of measurements which could be performed on an individual day, it is difficult to iden-tify any potential diurnal variation of the COS and CS2 fluxes on the basis of data for individual observational days. Such data do not always show any common features. 10
Some daily profiles are even contradictory. However, the average diurnal variations, presented in Fig.5, clearly indicate systematic features of the fluxes of COS and CS2, as well as of CO2. It is obvious that COS and CS2 are taken up by the forest pre-dominantly during the sunlit hours, and that the release of these gases occurs during the rest of the day, similarly to CO2. The strongest deposition of both sulfur gases 15
was observed around local noon, i.e. during the period with most intense solar radia-tion and strongest turbulence. The similar diurnal features for COS and CO2 suggest the existence of a common uptake pathway, i.e. the open stomata, as suggested by
Goldan et al.(1988). The change of stomatal aperture, which is controlled by various
environmental factors, such as the light intensity, water stress, etc., may cause the di-20
urnal cycles of the COS and CS2fluxes, as it does for the CO2flux. This is supported by the correlations shown in the following sections.
3.5. Correlations to PAR and to the H2O flux
Figures6a and6b show the relationships of the COS flux to photosynthetically active radiation (PAR) and to the H2O flux, respectively. The correlation coefficients in the 25
ACPD
2, 181–212, 2002
The flux of carbonyl sulfide and carbon
disulfide Xu et al. Title Page Abstract Introduction Conclusions References Tables Figures J I J I Back Close Full Screen / Esc
Print Version Interactive Discussion
c
EGS 2002 to the H2O flux.
As implied by the slopes of the regression lines in Figs.6a and 6b, the uptake of COS increases with increasing PAR and H2O flux. This may be a result of physiological regulation through stomatal aperture, which is related to both PAR and the H2O flux. At higher PAR, the trees tend to take up more COS and CS2 and release more water 5
vapor, because of decreased stomatal resistance. Although the relationships of Fig.6 between the COS flux and physiological parameters are plausible, they are not suitable for parameterization purposes, since the correlations capture only a very small fraction (< 10%) of the variance.
The CS2flux is also correlated to PAR and the H2O flux. However, both correlations 10
are only significant at confidence levels of 75% and 87%, respectively. There is no known enzymatic mechanism which can explain the deposition of CS2 to plants and the slight correlations of the CS2flux to PAR and the H2O flux.
3.6. Correlation to the CO2flux
Laboratory studies show that COS is consumed by plants in nearly the same way 15
as CO2, after being split by the key enzyme, CA (Protoschill-Krebs and Kesselmeier,
1992;Protoschill-Krebs et al.,1995,1996). This finding not only reveals the
physiolog-ical background of the uptake of COS by higher plants, but also implies the possibility of extrapolating these measurements to obtain the global COS deposition to vegeta-tion, using the ratio of the COS uptake to CO2assimilation and the global CO2fixation, 20
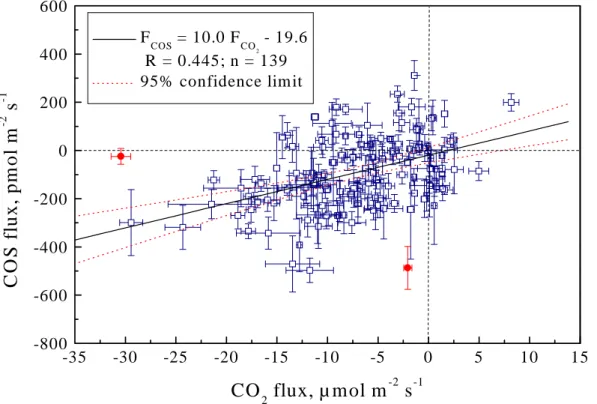
which is better quantified. Measurements performed during this work support this idea. Figure7shows that the COS and CO2fluxes are positively correlated at the 99% confi-dence level. Although the data points are relatively scattered, the correlation line is well defined, as indicated by the dotted lines of the 95% confidence belt of the regression line.
25
The regression line in Fig.7 contains a small intercept (−19.6 pmol m−2s−1). Both the intercept and the origin lie within the 95% confidence belt, suggesting that the deviation of this intercept from the origin is not significant. This is consistent with the
ACPD
2, 181–212, 2002
The flux of carbonyl sulfide and carbon
disulfide Xu et al. Title Page Abstract Introduction Conclusions References Tables Figures J I J I Back Close Full Screen / Esc
Print Version Interactive Discussion
c
EGS 2002 idea that both COS and CO2are exchanged between the atmosphere and vegetation
through a common pathway, i.e. the open stomata. On the other hand, since the soils at the site were observed to be a permanent source of CO2and a minor sink of COS, it is to be expected that a small negative intercept should exist.
The slope (10.0 with a standard deviation of 1.7) of the regression line in Fig.7can 5
be considered as a representative value for the ratio of the COS- and CO2-uptake. Such uptake ratios were also investigated in several laboratory as well as in situ stud-ies (Hofmann,1993;Kesselmeier and Merk,1993;Kesselmeier et al.,1993;Velmeke,
1993; Huber, 1994; Kuhn, 1997). Table2 lists various values of uptake ratios which
were reported in these articles, along with the one obtained in this work. Considerable 10
differences exist between the uptake ratios reported for different plant species, and even between various values reported for spruce. Hofmann (1993) andHuber(1994) measured exchanges of COS and CO2between the atmosphere and a spruce forest (80 years) in Schachtenau (Nationalpark Bayerischer Wald), Germany, using the gradi-ent and chamber methods, respectively. The uptake ratio obtained in the presgradi-ent work 15
agrees reasonably well with the one derived from the measurements ofHuber(1994), but it is about one order of magnitude larger than that derived byHofmann(1993). If compared with the other uptake ratios listed in Table2, our results fall roughly into the middle of all values reported so far.
3.7. Extrapolation to global vegetation sinks 20
One of the goals of the present work was to derive an estimate of the global vege-tation sink of atmospheric COS by extrapolating the ratio between COS uptake and CO2 fixation from the flux measurements. As shown in Sect.3.6, a correlation of the COS flux to CO2 flux was obtained for the spruce forest. The measurements of
Hofmann (1993) and Huber (1994) on a 80 year spruce stand also showed a
sig-25
nificant correlation between the COS and CO2 fluxes. However, such a correlation was not found during cuvette experiments on young (10 years) spruce trees ( Hu-ber, 1994). A poor correlation between the COS exchange and the CO
assimila-ACPD
2, 181–212, 2002
The flux of carbonyl sulfide and carbon
disulfide Xu et al. Title Page Abstract Introduction Conclusions References Tables Figures J I J I Back Close Full Screen / Esc
Print Version Interactive Discussion
c
EGS 2002 tion was also found byKesselmeier et al. (1993) during field experiments on tropical
plants (Poterandia cladantha and Saccoglottis gabonensis), while a good correlation was observed by Kuhn (1997) during experiments on a temperate plant (Quercus
agrifolia). Laboratory studies on agricultural plants (wheat, corn, rapeseed and pea)
showed a certain correlation of the COS uptake to the CO2 assimilation (Hofmann, 5
1993;Kesselmeier and Merk,1993), while no relationship between COS and CO2
ex-changes was observed over a wheat field (Hofmann,1993). The inconsistency among these results indicates the uncertainty of any estimates of the global COS vegetation sink based on extrapolation. Nevertheless, it is worthwhile to use this extrapolation method until better methods become available. Based on the uptake ratio COS/CO2of 10
10.0 ± 1.7 pmol µmol−1 obtained in this work and the recent estimate of the terrestrial net primary production (NPP) of about 45 ± 5 Pg C yr−1 (or 90 Pg dry matter yr−1) from
Matthews(1997), the global vegetation sink is estimated to be 2.3 ± 0.5 Tg COS yr−1.
This value lies within the ranges 2–5 Tg COS yr−1 and 1–3.4 Tg COS yr−1estimated by
Brown and Bell(1986) andHofmann(1993), respectively, but is much larger than the
15
estimates of 0.24–0.59 Tg COS yr−1, 0.16–1.0 Tg COS yr−1 and 0.86–1.0 Tg COS yr−1
by Goldan et al. (1988), Chin and Davis (1993), and Kesselmeier and Merk (1993),
respectively. The COS vegetation uptake derived from our REA measurements should not be considered as the current best estimate of this sink. While its uncertainty of ± 0.5 Tg COS yr−1is due to the scatter of the REA data and the uncertainty in the NPP 20
estimate, the total error in the extrapolation is unknown and maybe large. A plausible range for the uptake ratio (see Table2) seems to be 2–12 pmol µmol−1, corresponding to a sink of 0.5–2.8 Tg COS yr−1. The figure obtained in this work falls within this range. However, as it is derived from a large number of in situ data covering several years and seasons, it should be given special consideration.
25
The above method can also be applied to tentatively estimate the vegetation sink of CS2. A linear fit shows FCS
2 = (1.9 ± 1.2)FCO2 − 3.8, with FCS2 in pmol m
−2 s−1 and FCO
2 in µmol m
−2
s−1. Assuming that the uptake ratio CS2/CO2 is equal to 1.9 ± 1.2 pmol µmol−1, the global vegetation sink is estimated to be 0.54 ± 0.35 Tg CS2yr−1.
ACPD
2, 181–212, 2002
The flux of carbonyl sulfide and carbon
disulfide Xu et al. Title Page Abstract Introduction Conclusions References Tables Figures J I J I Back Close Full Screen / Esc
Print Version Interactive Discussion
c
EGS 2002 However, this preliminary estimate of the vegetation sink of atmospheric CS2should be
viewed with caution since the correlation between the CS2and CO2 fluxes is only sig-nificant at the 90% confidence level. Considering the large uncertainty in this estimate, further studies are necessary to quantify the air-vegetation exchange of CS2.
4. Conclusions
5
A REA sampler for measuring gas fluxes over forests has been developed and val-idated. Exchange fluxes of COS and CS2 between a tall spruce forest and the at-mosphere were measured using this system. Both deposition and emission of COS and CS2 were observed. On the average, however, the forest acted as a net sink of both gases. The average fluxes for COS and CS2 were −93 ± 11.7 pmol m−2s−1 and 10
−18 ± 7.6 pmol m−2s−1, respectively. The uptake of COS by the forest showed no clear seasonal pattern. A net deposition of CS2was observed in August, September and October and a minor net emission in May and July. On the average, a maximum deposition is found around noon, indicating the importance of stomata in controlling the air-plant exchange of COS and CS2. This is supported by the correlations of the 15
fluxes of both gases to PAR and to the H2O and CO2 fluxes. Based on the uptake ratio COS/CO2(10.0 ± 1.7 pmol µmol−1) and a recent estimate of the NPP, the global COS vegetation sink is estimated to be 2.3 ± 0.5 Tg COS yr−1. This estimate suggests that the vegetation sink of COS may have been significantly underestimated in earlier budget reviews of atmospheric COS. Since the tropospheric burden of COS is about 20
4.6 Tg, such a large vegetation sink of COS may limit the residence time of atmospheric COS to about 2 years and cause significant seasonal variations in the mixing ratio of tropospheric COS at the middle and high latitudes of the Northern Hemisphere.
Acknowledgements. This work was funded by the Deutsche Forschungsgemeinschaft (DFG)
through grant BI 462/1-3. We are very grateful to Drs. K. Morgenstern, A. Ibrom and others 25
ACPD
2, 181–212, 2002
The flux of carbonyl sulfide and carbon
disulfide Xu et al. Title Page Abstract Introduction Conclusions References Tables Figures J I J I Back Close Full Screen / Esc
Print Version Interactive Discussion
c
EGS 2002 Graeme Handisides for improving the manuscript.
References
Adams, D. F., Farwell, S. O., Pack, M. R., and Robinson, E.: Biogenic sulfur gas emissions from soils in eastern and southern United States, J. Air Pollut. Cont. Ass., 31, 1083–1089, 1981.
184
5
Andreae, M. O. and Crutzen, P. J.: Atmospheric aerosols: Biogeochemical sources and role in atmospheric chemistry, Science, 276, 1052–1058, 1997. 183
Bartell, U., Hofmann, U., Kreuzburg, B., Andreae, M. O., and Kesselmeier, J.: COS and H2S fluxes over a wet meadow in relation to photosynthetic activity: An analysis of measurements made on 6 September 1990, Atmos. Environ., 27, 1851–1864, 1993. 183,184
10
Berresheim, H. and Vulcan, V. D.: Vertical distributions of COS, CS2, DMS and other sulfur compounds in a loblolly pine forest, Atmos. Environ., 26 (11), 2031–2036, 1992. 183,185
Beverland, I. J., Moncrieff, J. B., ´ON´eill, D. H., Hargreaves, K. J., and Milne, R.: Measurement of methane and carbon dioxide fluxes from peatland ecosystems by the conditional-sampling technique, Q. J. R. Meteorol. Soc., 122, 819–838, 1996. 185
15
Brown, K. A. and Bell, J. N. B.: Vegetation - the missing sink in the global cycle of COS, Atmos. Environ., 20, 537–540, 1986. 183,197
Businger, J. A. and Oncley, S. P.: Flux measurement with conditional sampling, J. Atmos. Ocean. Technol., 2, 349–352, 1990. 185
Castro, M. S. and Galloway, J. N.: A comparison of sulfur-free and ambient air enclosure tech-20
niques for measuring the exchange of reduced sulfur gases between soils and the atmo-sphere, J. Geophys. Res., 96, 15 427–15 437, 1991. 184
Chin, M. and Davis, D. D.: Global sources and sinks of OCS and CS2and their distributions, Global Biogeochem. Cycles, 7, 321–337, 1993. 182,184,197
Crutzen, P. J.: The possible importance of CSO for the sulfate layer of the stratosphere, Geo-25
phys. Res. Lett., 3, 73–76, 1976. 182
den Hartog, G. D. and Neumann, H. H.: An empirical study on dry deposition of air pollutants to forests, Tech. Rep. AQRB-84-011-L, AES, Canada, 1984. 185
ACPD
2, 181–212, 2002
The flux of carbonyl sulfide and carbon
disulfide Xu et al. Title Page Abstract Introduction Conclusions References Tables Figures J I J I Back Close Full Screen / Esc
Print Version Interactive Discussion
c
EGS 2002 the reduced sulfur compounds H2S, COS, and CS2 in a tropical industrialized region, J.
Atmos. Chem., 25, 251–270, 1996. 183,184,185
Ellenberg, H., Mayer, R., and Schauermann, J.: ¨Okosystemforschung - Ergebnisse des Solling-projektes 1966–1986, Verlag Eugen Ulmer, Stuttgart, 1986. 186,187
Engel, A. and Schmidt, U.: Vertical profile measurements of carbonylsulfide in the stratosphere, 5
Geophys. Res. Lett., 21, 2219–2222, 1994. 182
Fall, R., Albritton, D. L., Fehnsenfeld, F. C., Kuster, W. C., and Goldan, P. D.: Laboratory studies of some environmental variables controlling sulfur emissions from plants, J. Atmos. Chem., 6, 341–362, 1988. 184
Fried, A., Klinger, L. F., and III, D. J. E.: Atmospheric COS exchange in bog microcosms, Geo-10
phys. Res. Lett., 20 (2), 129–132, 1993. 183
Goldan, P. D., Kuster, W. C., Albritton, D. L., and Fehsenfeld, F. C.: The measurement of natural sulfur emissions from soil and vegetation: Three sites in the Eastern United States revisited, J. Atmos. Chem., 5, 439–467, 1987. 184
Goldan, P. D., Fall, R., Kuster, W. C., and Fehnsenfeld, F. C.: Uptake of COS by growing veg-15
etation: A major tropospheric sink, J. Geophys. Res., 93, 14 186–14 192, 1988. 183,193,
194,197
Grainier, C. and Brasseur, G.: Impact of heterogeneous chemistry on model predictions of ozone changes, J. Geophys. Res., 97 (D16), 18 015–18 033, 1992. 182
Hines, M. E. and Morrison, M. C.: Emission of biogenic sulfur gases from Alaskan tundra, J. 20
Geophys. Res., 97 (D15), 16 703–16 707, 1992. 184
Hofmann, U.: Vergleichende Untersuchungen zum Austausch von reduzierten Schwe-felverbindungen zwischen Vegetation und Atmosph ¨are im Feldversuch und unter kontrol-lierten Bedingungen, Ph.D. thesis, Universit ¨at Mainz, 1993. 184,185,196,197,205
Hofmann, U., Hofmann, R., and Kesselmeier, J.: Field measurements of reduced sulfur com-25
pounds over wheat during a growing season, in: Precipitation scavenging and atmosphere-surface exchange. Volume 2: Atmosphere-Surface Exchange Processes, (Eds) Schwartz, S. E. and Slinn, W. G. N., 967–977, Hemisphere, Washington, D. C., 1992. 183
Huber, B.: Austausch fl ¨uchtiger Schwefelverbindungen in land- und forstwirtschaftlichen ¨
Okosystemen, Wissenschaftsverlag Maraun, Frankfurt, 1994. 184,185,193,196,205
30
Ibrom, A., Schuetz, C., Tworek, T., Morgenstern, K., Oltchev, A., Falk, M., Constaintin, J., and Gravenhorst, G.: Eddy-correlation measurements of the fluxes of CO2 and H2O above a
ACPD
2, 181–212, 2002
The flux of carbonyl sulfide and carbon
disulfide Xu et al. Title Page Abstract Introduction Conclusions References Tables Figures J I J I Back Close Full Screen / Esc
Print Version Interactive Discussion
c
EGS 2002 Kesselmeier, J. and Merk, L.: Exchange of carbonyl sulfide (COS) between agricultural plants
and the atmosphere: Studies on the deposition of COS to peas, corn and rapeseed, Bio-geochem., 23, 47–59, 1993. 183,184,193,196,197,205
Kesselmeier, J., Meixner, F. X., Hofmann, U., Ajavon, A.-L., Leimbach, S., and Andreae, M. O.: Reduced sulfur compounds exchange between the atmosphere and tropical tree species in 5
Southern Cameroon, Biogeochem., 23, 23–45, 1993. 184,185,196,197,205
Khalil, M. A. K. and Rasmussen, R. A.: Global sources, lifetimes and mass balances of carbonyl sulfide (OCS) and carbon disulfide (CS2) in the Earth’s atmosphere, Atmos. Environ., 8 (9), 1805–1813, 1984. 182
Kluczewski, S. M., Bell, J. N. B., Brown, K. A., and Minski, M. J.: The uptake of35S-carbonyl sul-10
phide by plants and soils, in: Ecological aspects of radionuclide release, Special Publication of British Ecological Society III, (Ed) Coughtrey, P. J., pp. 91–104, Blackwell Scientific Press, Oxford, 1983. 183
Kluczewski, S. M., Brown, K. A., and Bell, J. N. B.: Deposition of [35S]-carbonyl sulphide to vegetable crops, Radiat. Prot. Dosim, 11, 173–177, 1985. 183,193
15
Kuhn, U.: Spurengasaustausch klimarelevanter reduzierter Schwefelverbindungen zwischen Biosph ¨are und Atmosph ¨are: COS Transfer der Flechten und anderer biotischer Komparti-mente, Ph.D. thesis, Universit ¨at Mainz, 1997. 193,196,197,205
Kuhn, U., Ammann, C., Wolf, A., Meixner, F. X., Andreae, M. O., and Kesselmeier, J.: Carbonyl sulfide exchange on an ecosystem scale: Soil represents a dominant sink for atmospheric 20
COS, Atmos. Environ., 33 (6), 995–1008, 1999. 183
Lacis, A., Hansen, J., and Sato, M.: Climate forcing by stratospheric aerosols, Geophys. Res. Lett., 19, 1607–1610, 1992. 182
Lamb, B., Westberh, H., Allwine, G., Bamesberger, L., and Guenther, A.: Measurement of biogenic sulfur emission from soil and vegetation: Application of dynamic enclosure methods 25
with Natusch filter and GC/FPD analysis, J. Atmos. Chem., 5, 469–491, 1987. 184
Laubach, J., Raschendorfer, M., Kreilein, H., and Gravenhorst, G.: Determination of heat and water vapour fluxes above a spruce forest by eddy correlation, Agric. For. Meteorol., 71, 373–401, 1994. 186,187,190
Leuning, R. and Moncrieff, J.: Eddy-covariance CO2 flux measurements using open- and
30
closed-path CO2analysers: Corrections for analyser water vapour sensitivity and damping of fluctuations in air sampling tubes, Bound.-Layer Meteorol., 53, 63–76, 1990. 188
ACPD
2, 181–212, 2002
The flux of carbonyl sulfide and carbon
disulfide Xu et al. Title Page Abstract Introduction Conclusions References Tables Figures J I J I Back Close Full Screen / Esc
Print Version Interactive Discussion
c
EGS 2002 data and regression models, J. Geophys. Res., 102, 18 771–18 800, 1997. 197
Mihalopoulos, N., Bonsang, B., Nguyen, B. C., Kanakidou, M., and Belviso, S.: Field observa-tions of COS deficit near the ground: Possible implication of vegetation, Atmos. Environ., 23 (10), 2159–2166, 1989. 183
Moncrieff, J. B., Beverland, I. J., ´ON´eill, D. H., and Cropley, F. D.: Controls on trace gas ex-5
change observed by a conditional sampling method, Atmos. Environ., 32 (19), 3265–3274, 1998. 185
Oncley, S. P., Delany, A. C., Horst, T. W., and Tans, P. P.: Verification of flux measurement using relaxed eddy accumulation, Atmos. Environ., 27, 2417–2426, 1993. 185,188
Pattey, E., Desjardins, R. L., and Rochette, R.: Accuracy of the relaxed eddy-accumulation 10
technique, evaluated using CO2flux measurements, Bound.-Layer Meteorol., 66, 341–355, 1993. 185,188
Pattey, E., Desjardins, R. L., Westberg, H., Lamb, B., and Zhu, T.: Measurement of isoprene emissions over a black spruce stand using a tower-based relaxed eddy-accumulation sys-tem, J. Appl. Meteorol., 38 (7), 870–877, 1999. 185
15
Protoschill-Krebs, G. and Kesselmeier, J.: Enzymatic pathways for the consumption of carbonyl sulphide (COS) by higher plants, Bot. Acta, 105, 206–212, 1992. 183,195
Protoschill-Krebs, G., Wilhelm, C., and Kesselmeier, J.: Consumption of carbonyl sulphide by chlamydomonas reinhardtii with different activities of carbonic anhydrase (CA) induced by different CO2growing regimes, Bot. Acta, 108, 445–448, 1995. 183,195
20
Protoschill-Krebs, G., Wilhelm, C., and Kesselmeier, J.: Consumption of carbonyl sulphide (COS) by higher plants carbonic anhydrase (CA), Atmos. Environ., 30, 3151–3156, 1996.
183,195
Rennenberg, H., Schr ¨oder, P., and Huber, B.: Emission of reduced sulfur compounds from agricultural and forest ecosystems, in: EUROTRAC Annual Report 1990, Part 4, BIATEX, 25
pp. 156–162, Garmisch-Partenkirchen, 1991. 184
Rodriguez, J. M., Ko, M. K. W., and Sze, N. D.: Role of heterogeneous conversion of N2O5 on sulphate aerosols in global ozone loses, Nature, 352, 134–137, 1991. 182
Steinbacher, M.: Untersuchungen zum Austausch von Carbonylsulfid (COS) ¨uber einem Wald ¨okosystem, Master thesis, Universit ¨at Frankfurt, 2000. 190,193
30
Steinbacher, M., Bingemer, H. G., and Schmidt, U.: Exchange of COS and CS2between forest soil and atmosphere at a site in Central Europe, in preparation, 2002. 191
Eng-ACPD
2, 181–212, 2002
The flux of carbonyl sulfide and carbon
disulfide Xu et al. Title Page Abstract Introduction Conclusions References Tables Figures J I J I Back Close Full Screen / Esc
Print Version Interactive Discussion
c
EGS 2002 land spartina alterniflora marsh, Atmos. Environ., 19 (9), 1411–1416, 1985. 184
Taylor, Jr., G. E., McLaughlin, Jr., S. B., Shriner, D. S., and Slevidge, W. J.: The flux sulfur-containing gases to vegetation, Atmos. Environ., 17, 789–796, 1983. 183,184,193
Valentini, R., Greco, S., Seufert, G., Bertin, N., Ciccioli, P., Cecinato, A., Brancaleoni, E., and Frattoni, M.: Fluxes of biogenic VOC’s from Mediterranean vegetation by trap enriched re-5
laxed eddy accumulation, Atmos. Environ., 31(S1), 229–238, 1997. 188
Velmeke, F.: Versuche zur Korrelation von Photosynthese mit dem Austausch fl ¨uchtiger Schwefel-Verbindungen zwischen B ¨aumen and Atmosph ¨are, Master thesis, Universit ¨at Mainz, 1993. 196,205
Watts, S. F.: The mass budgets of carbonyl sulfide, dimethyl sulfide, carbon disulfide and hy-10
drogen sulfide, Atmos. Environ., 34, 761–779, 2000. 183
Xu, X.: Investigations into the Tropospheric Cycle of COS: Atmospheric Distribution, Air-Sea and Air-Vegetaion Exchanges, Ph.D. thesis, Unversit ¨at Frankfurt, 2001.
ACPD
2, 181–212, 2002
The flux of carbonyl sulfide and carbon
disulfide Xu et al. Title Page Abstract Introduction Conclusions References Tables Figures J I J I Back Close Full Screen / Esc
Print Version Interactive Discussion
c
EGS 2002
Table 1. REA measurements of COS, CS2 and CO2 fluxes over a spruce forest in Solling,
Germany. Mean values and standard errors of the mean are listed for the individual campaigns
Time FCOS FCS
2 FCO2
pmol m−2s−1 pmol m−2s−1 µmol m−2s−1
Aug. 1997 −105±47 −44±37 no data Sept. 1997 −173±51 −17±8 no data Sept. 1998 −43±27 −32±20 −5.98±0.81 May 1999 −93±32 1±20 −10.2±1.4 Jul. 1999 −88±19 5±9 −9.29±1.03 Sep./Oct. 1999 −105±23 −36±19 −5.06±1.26
ACPD
2, 181–212, 2002
The flux of carbonyl sulfide and carbon
disulfide Xu et al. Title Page Abstract Introduction Conclusions References Tables Figures J I J I Back Close Full Screen / Esc
Print Version Interactive Discussion
c
EGS 2002
Table 2. Measurements of the uptake of COS by different plants in relation to CO2assimilation
Plant COS/CO2(pmol µmol−1) Method Reference
Spruce 10.0±1.7 REA, in situ This work
Spruce 11.7±4.8 Chamber, in situ Huber(1994)
Quercus agrifolia 2.2 Chamber, in situ Kuhn(1997)
Spruce 0.8±0.1 Gradient, in situ Hofmann(1993)
Wheat 5.7±1.0 Chamber, in situ
Corn 11.2±3.8
Pea 6.2±2.1
Pea 0.3–4.2 Chamber, laboratory Kesselmeier and Merk(1993)
Rapeseed 0.9–1.4
Corn 1.9–16.7
Sacoglottis gabonensis 14.4(0.8–38.4) Chamber, in situ Kesselmeier et al.(1993)
Porterandia cladantha 1.7(0.14–6.0)
ACPD
2, 181–212, 2002
The flux of carbonyl sulfide and carbon
disulfide Xu et al. Title Page Abstract Introduction Conclusions References Tables Figures J I J I Back Close Full Screen / Esc
Print Version Interactive Discussion c EGS 2002 1 0 0 m T o w e r N S p r u c e Y o u n g e r S p r u c e B e e c h
ACPD
2, 181–212, 2002
The flux of carbonyl sulfide and carbon
disulfide Xu et al. Title Page Abstract Introduction Conclusions References Tables Figures J I J I Back Close Full Screen / Esc
Print Version Interactive Discussion c EGS 2002 U S A - 1 2 2 0 0 m l / m i n M F C 60 0m l/m in V e n t V a l v e C o n t r o l l e r S o l e n o i d V a l v e s O n / O f f V a l v e s P o r t a b l e P C T e d l a r S a m p l e B a g s P u m p R S-23 2 A n e m o m e t e r S e n s o r w > w w < |w | w < -w d d d V + V 0 V -N e e d l e V a l v e
ACPD
2, 181–212, 2002
The flux of carbonyl sulfide and carbon
disulfide Xu et al. Title Page Abstract Introduction Conclusions References Tables Figures J I J I Back Close Full Screen / Esc
Print Version Interactive Discussion c EGS 2002 D r i e r i t e N a f i o n D r y e r P u m p M F C V e n t C C 8 - W a y V a l v e P u m p L i q i u d A r W a t e r S t a n d a r d s C h r o m o s i l 3 1 0 C o l u m n H P 6 8 9 0 E P C F P D H 2 A i r N 2 P C w i t h E - L a b 3 - W a y V a l v e L o o p 1 L o o p 2 +
ACPD
2, 181–212, 2002
The flux of carbonyl sulfide and carbon
disulfide Xu et al. Title Page Abstract Introduction Conclusions References Tables Figures J I J I Back Close Full Screen / Esc
Print Version Interactive Discussion c EGS 2002 -40 -30 -20 -10 0 10 20 -40 -30 -20 -10 0 10 20
CO flux by REA, µ mol m
-2s
-1 1:1 linemeasurements with error estimates
regression line: FEC = 0.902 FREA - 0.509, R = 0.86, n = 94 95 % confidence limit
CO
2f
lux by E
C
, µ
m
ol
m
-2s
-1ACPD
2, 181–212, 2002
The flux of carbonyl sulfide and carbon
disulfide Xu et al. Title Page Abstract Introduction Conclusions References Tables Figures J I J I Back Close Full Screen / Esc
Print Version Interactive Discussion c EGS 2002 -200 -100 0 100 200 24 22 20 18 16 14 12 10 8 6 4 2 0 COS CS2
CO
S
a
n
d
CS
2f
luxe
s,
pm
ol
m
-2s
-1 -15 -10 -5 0 5 10 15CO
2f
lux,
µ
m
ol
m
-2s
-1 CO2Fig. 5. Average diurnal variation in the COS, CS2 and CO2 fluxes. The error bars indicate
ACPD
2, 181–212, 2002
The flux of carbonyl sulfide and carbon
disulfide Xu et al. Title Page Abstract Introduction Conclusions References Tables Figures J I J I Back Close Full Screen / Esc
Print Version Interactive Discussion c EGS 2002 0 200 400 600 800 1000 1200 1400 -600 -400 -200 0 200 400 600 (a) FCOS = -0.121 PAR - 44.2, R = 0.26, n = 154 C O S f lux, pm ol m -2 s -1 -2 -1 -2 0 2 4 6 8 10 -600 -400 -200 0 200 400 600 (b) F COS = -24.4 FV - 43.4, R = 0.28, n = 112 C O S f lux, pm ol m -2 s -1
W ater vapor flux, m m ol m-2 s-1
Fig. 6. Correlation of the COS flux to (a) photosynthetically active radiation (PAR) and (b) the
ACPD
2, 181–212, 2002
The flux of carbonyl sulfide and carbon
disulfide Xu et al. Title Page Abstract Introduction Conclusions References Tables Figures J I J I Back Close Full Screen / Esc
Print Version Interactive Discussion c EGS 2002 -35 -30 -25 -20 -15 -10 -5 0 5 10 15 -800 -600 -400 -200 0 200 400 600 FCOS = 10.0 FCO 2 - 19.6 R = 0.445; n = 139 95% confidence lim it
C
O
S
f
lux,
pm
ol
m
-2s
-1CO
2flux, µ mol m
-2s
-1Fig. 7. Correlation between the COS and CO2fluxes. The vertical and horizontal bars present
the estimated errors of the observed COS and CO2fluxes. The two outliers marked with filled circles were not included in the regression since the results are too sensitive to them.