HAL Id: hal-00302306
https://hal.archives-ouvertes.fr/hal-00302306
Submitted on 25 Feb 2004
HAL is a multi-disciplinary open access
archive for the deposit and dissemination of
sci-entific research documents, whether they are
pub-lished or not. The documents may come from
teaching and research institutions in France or
abroad, or from public or private research centers.
L’archive ouverte pluridisciplinaire HAL, est
destinée au dépôt et à la diffusion de documents
scientifiques de niveau recherche, publiés ou non,
émanant des établissements d’enseignement et de
recherche français ou étrangers, des laboratoires
publics ou privés.
materials
P. G. Kapiris, G. T. Balasis, J. A. Kopanas, G. N. Antonopoulos, A. S.
Peratzakis, K. A. Eftaxias
To cite this version:
P. G. Kapiris, G. T. Balasis, J. A. Kopanas, G. N. Antonopoulos, A. S. Peratzakis, et al.. Scaling
similarities of multiple fracturing of solid materials. Nonlinear Processes in Geophysics, European
Geosciences Union (EGU), 2004, 11 (1), pp.137-151. �hal-00302306�
SRef-ID: 1607-7946/npg/2004-11-137
Nonlinear Processes
in Geophysics
© European Geosciences Union 2004
Scaling similarities of multiple fracturing of solid materials
P. G. Kapiris1, G. T. Balasis2, J. A. Kopanas1, G. N. Antonopoulos1, A. S. Peratzakis1, and K. A. Eftaxias1
1Solid State Section, Physics Department, University of Athens, Greece 2GeoForschungsZentrum Potsdam, Germany
Received: 13 August 2003 – Revised: 18 December 2003 – Accepted: 19 December 2003 – Published: 25 February 2004
Abstract. It has recently reported that electromagnetic flashes of low-energy γ -rays emitted during multi-fracturing on a neutron star, and electromagnetic pulses emitted in the laboratory by a disordered material subjected to an increas-ing external load, share distinctive statistical properties with earthquakes, such as power-law energy distributions (Cheng et al., 1996; Kossobokov et al., 2000; Rabinovitch et al., 2001; Sornette and Helmstetter, 2002). The neutron star-quakes may release strain energies up to 1046erg, while, the fractures in laboratory samples release strain energies ap-proximately a fraction of an erg. An earthquake fault re-gion can build up strain energy up to approximately 1026erg for the strongest earthquakes. Clear sequences of kilohertz-megahertz electromagnetic avalanches have been detected from a few days up to a few hours prior to recent destructive earthquakes in Greece. A question that arises effortlessly is if the pre-seismic electromagnetic fluctuations also share the same statistical properties. Our study justifies a positive an-swer. Our analysis also reveals “symptoms” of a transition to the main rupture common with earthquake sequences and acoustic emission pulses observed during laboratory experi-ments (Maes et al., 1998).
1 Introduction
An important question in material science and in geophysics is to identify precursors of macroscopic defects or shocks. We report here some experimental results that may help to gain valuable information in that direction.
Our main tool is the monitoring of the micro-fractures, which occur before the final break-up in the pre-focal area, by recording their kilohertz-megahertz electromagnetic (EM) emissions. We remember, when a heterogeneous mate-rial is strained, its evolution toward breaking is characterized by the nucleation and coalescence of micro-cracks before the Correspondence to: K. A. Eftaxias
final break-up. Both acoustic as well as EM emissions in a wide frequency spectrum ranging from very low frequencies (VLF) to very high frequencies (VHF), are produced by mi-crocracks, which can be considered as the so-called precur-sors of general fracture. These precurprecur-sors are detectable both at a laboratory and a geological scale (Mogi, 1962; Scholz, 1968; Warwick et al., 1982; Gokhberg et al., 1982; Ogawa et al., 1985; Diodati et al., 1991; Fifolt et al., 1993; Anifrani et al., 1995; Petrenko and Gluschenkov, 1996; Garcimartin et al., 1997; Frid et al., 1999; Mavromatou and Hadjicon-tis, 2001; Bahat et al., 2002). Several experimental results, which illustrate the connection between anomalous VLF– VHF EM phenomena and acoustic phenomena with earth-quake (EQ) preparation, were presented in a rather compre-hensive collection of papers (Hayakawa and Fujinawa, 1994; Hayakawa, 1999; Hayakawa and Molchanov, 2002).
Clear kilohertz-megahertz sequences of EM anomalies have been detected from a few days to a few hours prior to re-cent destructive EQs in Greece. Rere-cently, we have attempted to establish the hypothesis that the detected EM phenomena are probably precursors emitted during micro-fracturing pro-cess from the focal area. This study combines concepts from spectral analysis associated with “intermittent criticality”, re-sults from laboratory experiments of rupture, and seismolog-ical arguments, as following:
1. Features of these EM precursors are possibly corre-lated with the corresponding fault model (Eftaxias et al., 2001a; Kapiris et al., 2004) and with the degree of heterogeneity within the pre-focal area (Eftaxias et al., 2000, 2001b, 2004).
2. The evolution of the sequence of the observed radio-emissions reveals similarities to that observed in labo-ratory acoustic and EM emissions during the last stages of failure preparation process in rocks, i.e. about 97%– 100% of the fracture strength (Eftaxias et al., 2002). Thus, the idea that the detected kilohertz-megahertz EM emissions came from the focal area is plausible.
3. A hallmark of EQ preparation process is its extraordi-nary complexity. Complexity manifests itself in link-ages between space and time, generally producing pat-terns on many scales and the emergence of fractal struc-tures (Newman and Turcotte, 2002). A related consider-ation is whether the nucleconsider-ation of EQ is associated with distinctive alterations in these scaling properties, which could be of practical “diagnostic” use. In the frame of this thought a new method to assess the approach of the main shock has been suggested, namely, the mon-itoring of fractal characteristic of EM emission towards global failure in consecutive time windows. This frac-tal statistical analysis under the “critical point earth-quake model”, first proposed in Sornette and Sammis (1995), reveals characteristic signs of approaching the global failure (“critical point”) (Kapiris et al., 2002, 2004, 2003; Eftaxias et al., 2003, 2004): (i) emergence of long-range correlations, i.e. the appearance of mem-ory effects, (ii) increase of the spatial correlation in the time series with time; (iii) gradual predominance of large EM events as the main shock is approached, (iv) decrease of the anti-persistence behaviour with time, (v) appearance of persistence properties in the “tail” of the precursors and finally, (vi) the significant divergence of the EM energy release rate with time. These critical fea-tures are also compatible with the percolation theory of fracture process (Kapiris et al., 2004).
4. A key parameter of the preparation of fracture is the degree and the nature of disorder. Our results reveal that the interplay between the heterogeneities in the pre-focal area and the stress field might be responsible for the observed pattern of the EM time-series. More pre-cisely, the temporal evolution of the Hurst exponent could be understood in the framework of this scenario: “the first anti-persistence part of the precursory EM ra-diation is triggered by micro-fractures in the highly dis-ordered system that surrounds the, more-or-less, homo-geneous backbones within the pre-focal area. The per-sistence radiation in the “tail” of the emission is thought to be clue to the fracture of the high strength backbones (Kapiris et al., 2004; Eftaxias et al., 2004)”.
5. We have uncovered a significant loss of multifractal complexity in the “tail” of the detected EM precursors. We remember that the final part of the precursory EM activity also exhibits persistence behavior. The combi-nation of these two results enhances the scenario that the last stage of the precursory EM activity might be originated in the fracture of the high strength backbones (Kapiris et al., 2004).
It might be argued that beyond any terminology all the above mentioned EM hallmarks distinguish the dynamics in a heterogeneous medium close to its final rupture, and hence, might be considered as candidate precursors of the global in-stability.
2 Electromagnetic “critical” pre-fracture hallmarks Seismicity is characterized by an extraordinary rich phe-nomenology and variability, which makes the development of a coherent explanatory and predictive framework very dif-ficult. Most aspects of a new class of models are encom-passed by a concept called “intermittent criticality” (Sornette and Sammis, 1995; Saleur et al., 1996a,b; Sammis et al., 1996; Heimpel, 1997; Bowman et al., 1998; Zoller et al., 2001; Zoller and Hainzl, 2002). This approach is an out-growth of efforts to characterize large earthquakes as a “crit-ical phenomenon”, culminating in a large event that is anal-ogous to a kind of “critical point”. The fundamental hypoth-esis of the “critical point earthquake model” is that a large EQ is the end result of a process in which the stress field becomes correlated over increasing long scale-lengths. The largest event possible of the fault network can not occur un-til regional criticality has been achieved and stress is conse-quently correlated at all length scales up to size of the re-gion. This large event then destroys criticality on its associ-ated network, creating a period of relative quiescence after which the process repeats by rebuilding correlation lengths towards criticality and the next large event. Thus a large EQ acts as a sort of “critical point” dividing the seismic cycle into a period of growing stress correlations before the great EQ and a relatively uncorrelated stress field after. The critical point hypothesis predicts two different precursory phenom-ena in space and time: the accelerating moment release and the growth of the spatial correlation length.
The school of “intermittent criticality” implies variations in the seismic activity during a seismic cycle. Consequently, a degree of predictability might then become possible mon-itoring the fault network. We remember that our main tool is the monitoring of the micro-fractures, which occur before the final break-up in the pre-focal area, by recording their kilohertz-megahertz EM emissions. The mentioned distinc-tive alterations in the scaling properties of the EM time series as the global instability is approached (see introduction) im-ply that the evolution of the Earth’s crust toward the “critical point” may take place not only in the seismological sense but also in the associated VLF-VHF electromagnetic sense.
Recently, we have studied the precursory EM phenom-ena in the framework of the “Intermittent Dynamics of Criti-cal Fluctuations” model that reveals the dynamics of critiCriti-cal fluctuations (Contoyiannis and Diakonos, 2000; Contoyian-nis et al., 2002). A recent analysis (ContoyianContoyian-nis et al., 2004) suggests that the EM precursors can be described in terms of intermittent dynamics of type I (Schuster, 1998). The es-timated critical exponents classify the phenomenon to the 3D–Ising universality class (Kapiris et al., 2003; Contoyian-nis et al., 2004).
The observed behavior of the EM precursors is contrary to what predicted from pure SOC models that imply a sys-tem perpetually near global failure (Bak and Tang, 1989; Sor-nette and SorSor-nette, 1989; Olami et al., 1992, e.g.), hence re-ducing the degree of predictability of individual earthquakes (Geller et al., 1997). However, these models fail to reproduce
some important properties of the spatiotemporal clustering of earthquakes observed in real fault systems: they do not show foreshock and aftershock sequences correlated to large earth-quakes as well as earthquake swarms (e.g. Hainzl et al., 2000; Main and Al-Kindy, 2002). Grasso and Sornette (1998) have attempted to clarify the notion of SOC and to solve some contradictions between this concept and some observations. Authors try to bridge both the hypothesis of an underlying self-organized critical state and the occurrence of precursory phenomena based on more complex and realistic models or combining self-organized complexity with critical point be-haviour (e.g. Huang et al., 1998; Sornette, 2000; Sammis and Smith, 1999; Hainzl et al., 2000; Newman and Turcotte, 2002; Al-Kindy and Main, 2003). These models also imply time-dependant variations in the activity as the main shock is approached, consequently, they may justify the emergence of sort time EM precursors immediately prior to the global instability as well.
More than 100 years since the development of equilib-rium statistical mechanics by Boltzmann and Gibbs, the gen-eral consensus appears to be that we still do not have an equivalent formalism for predicting the behavior of non-equilibrium systems. It is by now not crystal clear what is and what is not to be called SOC (Turcotte, 2001), and what this concept could add to the understanding of an observed, for example power-law behavior, which constitute a funda-mental characteristic of criticality (Maes et al., 1998). Main and Al-Kindy (2002) note that in order to distinguish the dif-ference between competing models of self-organized criti-cality and intermittent criticriti-cality depends on a more precise definition of the two than available at present. Consequently, terms such as “critical point”, “criticality”, “intermittent crit-icality” or “self-organized critcrit-icality” must be treated with cautiousness due to the fact that these terms are loaded with many different meaning and has been used in distinct ways in several contexts and scientific communities (Sammis and Sornette, 2002; Newman and Turcotte, 2002).
3 The main directions of the present work
Keeping in mind the above mentioned cautiousness concern-ing the terminology we wish to stick to the facts. Here, we attempt to establish more independent arguments in order to evaluate the sequence of the detected EM events as an “EM symptom” of an underlying complex dynamics without char-acteristic time and length scales. Therefore, turning back to avalanche state of the observed EM phenomena, we con-centrate on three types of observations: the amplitude, the quiescent (waiting) time between successive bursts, and the burst lifetime (duration). In particular, we focus on a poten-tial power-law distribution.
Second, a basic reason for our interest in the field of crit-ical phenomena is the striking similarities in behaviour near the “critical point” among systems that are otherwise quite different in nature. Even the numerical values of the “critical-point” exponents describing the quantitative nature of the
sin-gularities are identical for large groups of apparently physical systems (Stanley, 1999). In this sense, we focus on the ques-tion if the pre-seismic EM fluctuaques-tions share the same scal-ing similarities with other emissions observed durscal-ing multi-ple fracturing of solid materials.
4 “Gutenberg-Richter type” distribution in pre-fracture “EM events”
Many forms of scaling invariance appear in seismic phenom-ena. The most impressive feature is the Gutenberg-Richter law for the magnitude distribution of earthquake:
log10N (M > m) = α − bm, (1) where N (M>m) is the number of earthquakes with a magni-tude greater than m in a specific area and time, while, α and
b are two empirical parameters. The constant α is a mea-sure of the intensity of the regional seismicity. The available data indicate that the b-value depends on three factors (i) the geometrical properties of the fault, (ii) the physical proper-ties of the medium, and (iii) the stress level of the seismic region. Thus, many of the problems inherent in the identi-fication of precursory seismicity patterns also beset methods designed to detect precursory b-value variation . In general, experimental studies indicate that the approach of the main shock is characterized by a jump of the associated b-values to lower values (see Sect. 5). It is remarkable that laboratory experiments strongly support this result (Lei et al., 2003).
The Gutenberg-Richter law is at the heart of many models of seismicity. It is thought that such a power-law or fractal distribution may be a fundamental result of multiple fractur-ing when spontaneously activated micro-cracks tent to coa-lesce leading, by numerous up-scaling, to a catastrophic fail-ure. Hence, using earthquake terminology (e.g. Maes et al., 1998; Rabinovitch et al., 2001) we focus on a possible EM “Gutenberg-Richter type” distribution in the detected pre-seismic EM time series.
We concentrate on the kilohertz EM activities observed before the 7 September 1999 Athens earthquake with Ms (Ath)=5.9 at Zante station (Eftaxias et al., 2000, 2001a, 2003). These emissions have a rather long duration, i.e. ap-proximately a few days (the data were sampled at 1 Hz), thus it provides sufficient data for statistical analysis (Fig. 1a). We note that the pre-seismic accelerating anomalies have been launched through long duration kilohertz EM quiescence, while, they ceased a few hours before the Athens earthquake (Fig. 1b). In this work, we are dealing with the 10 kHz EM time series recording by the magnetic loop antenna having its axis along the E–W direction (Fig. 1b).
This “Gutenberg-Richter type” law is expected to be valid for signals with amplitude higher than a threshold connected with some minimal event, i.e. the minimum energy for crack propagation. Here, we limit its validity to signals higher than the experimental noise (Cannelli et al., 1993; Maes et al., 1998).
2000 (mV) NS EW Vert 10 kHz activity 30/08/99 01/09/99 03/09/99 05/09/99 07/09/99 2000 (mV) NS EW Vert 3 kHz activity EQ a 04/07 14/07 03/08 23/08 24/07 10kHz(EW) 13/08 1500 (mV) 0 1 2 3 4 5 6 7 8 9 10 02/09 Days b EQ
Fig. 1. (a) Electromagnetic anomalies of gradual increasing activ-ity simultaneously recorded at both the 3 kHz and 10 kHz magnetic loop antennas during the last a few days before the Mw=5.9 Athens earthquake on 7 September 1999, 11:56:50 UT. The asterisk indi-cates the time of the earthquake occurrence. (b) Electromagnetic recordings at the 10 kHz (E–W) magnetic loop antenna between 4 July 1999 and 11 September 1999. The figure reveals that the accelerating pre-seismic EM activities are embedded in a long dura-tion quiescence period concerning the detecdura-tion of EM disturbances at the kilohertz frequency band. The signals ceased ∼9 h prior to the main event.
Four ten-days successive intervals of the quiescence pe-riod preceding the EM anomaly have been studied and the corresponding amplitude distributions are shown in Fig. 2. Based on these distributions we consider as a background noise level of the times-series the value Anoise≈500 mV.
Thus, we regard as amplitude A of the precursory “EM events” the difference A=Araw−Anoise.
200 400 600 800 0 0.05 0.1 0.15 PDA raw A raw (mV) 20−Jul−1999 10 Days 200 400 600 800 0 0.05 0.1 0.15 PDA raw A raw (mV) 30−Jul−1999 10 Days 200 400 600 800 0 0.05 0.1 0.15 PDA raw Araw (mV) 09−Aug−1999 10 Days 200 400 600 800 0 0.05 0.1 0.15 PDA raw Araw (mV) 19−Aug−1999 10 Days
Fig. 2. The probability distribution of amplitude (PDA) of the EM recordings for four ten-day successive intervals of the quiescence period preceding the EM anomaly. These distributions indicate as noise level of the EM times-series the value Anoise≈500 mV.
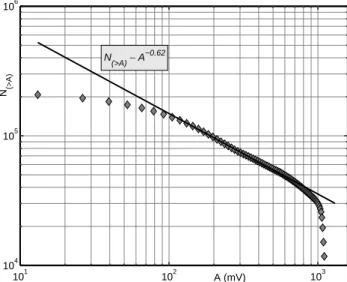
101 102 103 104 105 106 N(>A)∼ A−0.62 N(>A) A (mV)
Fig. 3. Number of “EM events” with amplitudes A=Araw−Anoise
(see text) higher than that given by the corresponding abscissa. The continuous line is the least squares fit of the power-law N (>A)=A−b where b=0.62. The power-law observed here is the fingerprint of a scale-free activity; an absence of characteristic lengths in the system.
Fig. 3 shows the cumulative number N (>A) of “EM events” (the number of “EM events” having amplitudes larger than A) vs EM event amplitude A. Its main part fol-lows the power-law
N (> A) ∼ A−b (2)
where b=0.62. Hence, the cumulative amplitude distri-bution of the precursory “EM events” is consistent with a “Gutenberg-Richter-type” law with a b-value of 0.62. The power-law observed here could be interpreted as an EM in-dication that the system evolves towards the global failure
without characteristic length scale. This evidence is a typical hallmark of criticality. The following laboratory experimen-tal result strongly enhances this hypothesis.
Rabinovitch et al. (2001) have recently studied the frac-tal nature of EM radiation induced by uni-axial and tri-axial rock fracture. The analysis of the pre-fracture EM time-series reveals that the cumulative distribution function of the amplitudes follows a “Gutenberg-Richter type” law with a
b-value of 0.62.
We pay attention to close correspondence between labora-tory scale EM observations and EM pre-seismic emissions. A power-law-scaling behavior was seen to be due an un-derlying criticality. The accord of b-values in phenomena involving remarkably different scales should be considered as a further hint that the same fracto-electromagnetic criti-cal dynamics hold from the geophysicriti-cal scriti-cale down to the microscopic scale of the sample rheological structure.
Remark: The cumulative number N (>A) of “EM events” vs “EM event” amplitude A is fitted by the power-law
N (>A)∼A−0.62for about one order of magnitude (approxi-mately between 100 mV and 800 mV). Based exclusively to this information, it is difficult for one to accept the observed power-law as a strong fingerprint of an underlying “scale-free process”. However, one should keep in mind the fol-lowing: (i) The data fit the power-law very well, i.e. the cor-relation coefficient in the log-log representation of the rela-tion N (>A)∼A−b is r∼1. (ii) The observed close corre-spondence between laboratory scale pre-fracture EM events and pre-seismic “EM events”. (iii) Accumulated experimen-tal evidence suggests that the EM time series under inves-tigation is in agreement with the critical point earthquake model (Eftaxias et al., 2003; Kapiris et al., 2004; Eftaxias et al., 2004). If we accept these results, then, a power-law relation N (>A)∼A−b is expected as a pre-fracture signa-ture. (iv) In Sect. 7 we show that the sequence of pre-seismic “EM events” is organized without characteristic time scale. Maslov et al. (1994) have demonstrated that fractal spatial and temporal behaviour are intrinsically related for a broad range of critical phenomena. The authors show that the tem-poral and spatial activity can be described as different cuts in the same underlying fractal. Thus, if we accept the power-law correlations in time, the power-power-law behaviour in space is also expected. In general, any real data comprise a sample from some unknown population. Based on these considera-tions it might be concluded that the detected “EM events”, due to absorption (or noise) phenomena, are taken from a population of “EM events” which exhibits scaling law be-havior in wide temporal scales (see remark Sect. 6). Also, we should keep in mind that the Gutenberg-Richter law for earthquake magnitudes is valid for about seven orders of magnitude.
5 The observed b-value as a candidate precursory indicator
It is remarkable that the observed frequency-amplitude rela-tion of pre-seismic “EM events” in comparison agrees with those of Refs. (Kossobokov et al., 2000; Elgazzar, 1998; Gabrielov et al., 2000) for the distribution of earthquake magnitudes in that the b-value is of the order of 2/3. More precisely, detailed observations of earthquake catalogs have shown that foreshock sequences and mainshocks are charac-terized, on average, by a much smaller exponent b=0.6, com-pared to aftershocks, b=1 (Meredith, 1990; Knopoff, 2000; Hainzl et al., 2003). Hence, this kind of variation in b is used as a precursory phenomenon (Sobolev et al., 1991). The physical background of this consideration is that the high
b-values indicate a preponderance of small events, while, the law b-values show a preponderance of larger events. Moreover, acoustic emissions in rocks have been studied as a model of natural seismicity. During the deformation of rock in laboratory experiments, small cracking events emerge which radiate elastic waves in a manner similar to earthquake (Scholz, 1968; Ponomarev et al., 1997). These emissions were found to obey the “Gutenberg-Richter type” relation. Acoustic emissions from rock fracturing show an analogous jump of the b-value as the main event approaches, i.e. in-dicate a significant decrease in the level of the observed b-values immediately before the critical point: Scholz (1968) has reported that the b-values fall between 1 and 0, with a consistent tendency for b to decrease as stress is raised. Lab-oratory experiments performed by Ponomarev et al. (1997) also showed a significant fall of the observed b-values from 1 to 0.6 just before the global rupture. Lei et al. (2000) have presented the results of an ongoing experimental investiga-tion of compressive failure of homogeneous and heteroge-neous rocks. The authors used a rapid data acquisition sys-tem to monitor the spatio-sys-temporal distribution of acoustic emission during fault nucleation. They conclude that the b-value decreased with increasing acoustic emission rate, from an initial value of about 1.2–1.4; near the final fracturing the
b-value became as low as about 0.7.
In summary, from laboratory to geophysical scale the jump of b-value to lower values may signalize the approach of the main shock. Based on the aforementioned field and laboratory results it may be said that the appearance of a “Gutenberg-Richter type” distribution of the “EM events” with a b-value of 0.62 (that means a preponderance of large “EM events”) may indicate that the earthquake process might be in the last stage. We focus on this point.
Wavelet spectral analysis permits quantitative monitoring of the evolution of the transient signals, and hence of the un-derlying mechanism, by decomposing a time-series to linear super-position of identical predefined mathematical wave-forms (wavelets), each with finite duration and narrow fre-quency content. The global wavelet spectrum from the Mor-let continuous waveMor-let transform was used in order to provide an unbiased and consistent estimation of the true power spec-trum of the time-series (Torrence and Compo, 1998). The
25/08/99
28/08/99
31/08/99
03/09/99
06/09/99
09/09/99
0
1000
2000
1 2 3 4EQ
(mV)
(a) (b)1
1.5
2
0
0.1
0.2
0.3
05% r > 0.85β
Probability
11
1.5
2
33% r > 0.85β
21
1.5
2
69% r > 0.85β
31
1.5
2
06% r > 0.85β
4 (c) Fig. 4. (a) The time-series of the 10 kHz (E–W) magnetic field variations. The star indicates the time of the Athens EQ occurrence. (b) The wavelet power spectrum of the 10 kHz (E–W) electromagnetic time series between 25 August 1999 and 11 September 1999. The intensity scale on the top shows colour corresponding to the values of the square spectral amplitudes in arbitrary units. The spectrum reveals both, new higher frequencies are progressively added with time and the amplitude in each frequency (emission rate) increases as the earthquake is approached. (c) Histograms of probability distribution of the exponent β calculated on 1024 measurements segments for four consecutive time intervals as marked in (a) taking into account only the segments with good power-law spectrum density (r>0.85). Inserts show the percentage of segments with r>0.85.wavelet spectrum of the EM signal under investigation is il-lustrated in Fig. 4b. This figure reveals a progressive shift to higher frequencies. These new components, however, are emerged with small amplitudes. Fig. 4b also shows increase of amplitudes in each emission rate as the main shock is ap-proached. It is remarkable that this behaviour mainly charac-terizes the lower frequencies (emission rates). The question to be answered is whether the system transmits more power at low frequencies than at high frequencies. Further insight on this point can be gathered analyzing the power spectral density.
If the time series of amplitudes of the EM emission is a temporal fractal, then, a power-law spectrum density of the recorded time series is expected (Kapiris et al., 2002):
S(f )∼f−β. In a log S(f )− log f representation the power spectrum is a straight line with linear spectra slope β. Apply-ing the least square method, we calculate the spectra slope
β and the linear correlation coefficient r of the fitting asso-ciated with successive segments of 1024 samples each and study the distributions of exponent β in four consecutive time intervals (Fig. 4a). The power density shows a “coloured-noise” type of behaviour, i.e. β>0. This means that the power spectrum manifests more power at low frequencies than at high frequencies. If all frequencies are equally impor-tant (white-noise), we have β=0. Furthermore, one can rec-ognize that the closer the final stage of seismic process, the larger shift of β to higher values (second and third interval in Fig. 4c). The increase in the spectrum slope β with time signalizes the gradual prevalence of lower frequency fluctua-tions in the precursory sequence of “EM events”.
By combining the above mentioned information, we con-clude that new higher frequencies gradually emerge in the power spectrum; simultaneously, all spectral amplitudes in-crease as the main shock is approached. The system, how-ever, select to transmit more power at lower frequencies, con-sequently, their amplitudes increase significantly. Finally, the lower frequencies relatively dominate in the power spectrum. These findings are in agreement with the observed value of
b=0.62 that indicates the prevalence of large “EM events” in the precursory time series. All these results may reveal the last stage of the earthquake preparation, when due to the high level of clustering of defects, even a new small crack, if it connects large clusters, may generate a large event. The appearance of persistence properties in the tail of the EM precursor enhances the former consideration (Kapiris et al., 2004).
Summarizing the above considerations, we propose that the above mentioned findings demonstrate the basis of sim-ilarity between rock deformation experiments in the labora-tory and deformation of the crust both in terms of EM waves and elastic waves. We read the observed striking agreement of b-values as a further suggestion that the detecting pre-seismic EM activity is indeed powered by cooperative micro-fracturing process in the tail of the earthquake generation. We remember that the energy released by observed in the Earth fractures ranges from 1026erg, for the strongest earth-quakes, down to a fraction of an erg, for laboratory samples.
Thus, the observed similarities may reflect a scenario of an EM critical transition common for a broad class of non-linear systems.
Remark. Figure 3 shows that on both ends of the graph there is a deviation from the Gutenberg-Richter type law. Ra-binovitch et al. (2001) have noted a similar slope-change ef-fect for EM pulses obtained during rock fracture in the lab-oratory. It is remarkable that a number of researchers have noted this slope-change effect for seismic data as values in the smallest and largest ranges deviated from the Gutenberg-Richter law (Gabrielov et al., 2000). In the range of large am-plitudes, the EM b-value is significantly higher than in main part (Fig. 3). Scholz (1968); Kossobokov et al. (2000) noted this slope-change effect in the high range of earthquakes and explained it as being due to the maximum energy release and which is limited by the size of the crust and energy density. Concerning our data, we believe such a bend is inevitable since the absorption of the kilohertz signals in the complex structure of the stressed region, and EM energy density lim-its the maximum EM energy radiated into free space. On the other hand, the observed very low b-value for the small am-plitude ranges (Fig. 3) might be related to either an incom-plete sampling of small events or to noise or to a physical effect governing the process (Rabinovitch et al., 2001).
6 Characteristics of the Athens earthquake fault pattern
The principle feature of criticality is the fractal organization in both space and time. Fractals are critical features in the sense that they are not associated to any characteristic scale. From the sub-millimeter scale (Nolen-Hoeksema and Gor-don, 1987; Velde et al., 1993; Weiss, 2001) to geophysical scales (Turcotte, 1992; Ouillon et al., 1996) complex frac-ture patterns have been observed. The earthquakes occur on a fractal structure of faults: fault displacements (Kakimi, 1980), fault and fracture trace lengths (Heffer and Beven, 1990) and fracture apertures (Barton and Zoback, 1992) fol-low a power-law distribution.
An interesting question that arises concerns the fractal di-mension, D, of the activated fault. The number of fault rup-tures of length larger than l, N (L>l), follows the power-law
N (L>l)∼l−3b/c, where ‘c’ a constant (Aki, 1981; Turcotte, 1989). This means that the b-value is related to the distri-bution of rupture fault lengths. For most earthquake studies
c=1.5 has been appropriate (Kanamori and Anderson, 1975). Consequently, the distribution of rupture fault lengths gives the power-law N (L>l)∼l−2b.
The previously mentioned relations refer to seismologi-cal measurements. The results of the present study sug-gest that the observed b-value in the log-linear frequency-amplitude distribution of electromagnetic events (b=0.62) might be considered representative of the b-value of the frequency-magnitude distribution of foreshocks (Gutenberg-Richter law) associated with the Athens earthquake. There-fore, it might be argued that in the case of Athens earthquake
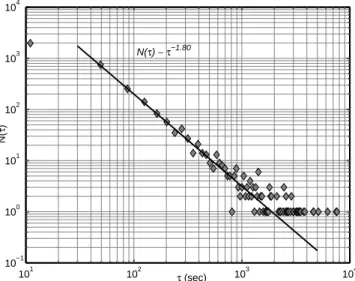
101 102 103 104 10−1 100 101 102 103 104 N(τ) ∼τ−1.80 N( τ ) τ (sec)
Fig. 5. The distribution of the laminar times τ between two EM emissions. The strait line is the respective power-law fit. The oc-currence of power-law indicates that the system develops critical correlations without characteristic time scales.
the distribution of rupture fault lengths follows the power-law
N (L>l)∼l−1.2. In the framework of the standard definition of fractals (Mandelbrot, 1982) one can immediately conclude that the fractal dimension of the fault system associated with the Athens earthquake is D=1.2. We note that seismologi-cal measurements as well as theoretiseismologi-cal studies (e.g. Sahimi, 1993; Sahimi et al., 1993, and references therein) suggest that a surface trace of a single major fault might be charac-terized by D∼1.2.
We clarify that the exponent D does not describe the ge-ometrical setting of the rupture faults but it only gives the distribution of rupture fault lengths irrespective of their po-sitions. More information is needed for a full geometrical interpretation of the faults, e.g. the position of the rupture centers (Sornette, 1991).
Remark: An opening crack, due to emitting, diffusing and recombination charge, can act as an EM emitter. Thus, the creation of rupture fault lengths, i.e. fracto-electromagnetic emitters, without characteristic length scale may rationalize the fact that the sequence of pre-seismic EM event is orga-nized in busts that have a distribution of amplitudes that is power-law (see remark in Sect. 4).
7 Clustering in pre-fracture EM avalanches
De Boer et al. (1995) argued that a power-law distribution of avalanches is not sufficient enough to claim that a model or a phenomenon is at criticality. They considered that power-law correlations in both space and time are at least required. Hence, one can ask how the precursory EM emission corre-late in time.
In the following, we investigate the temporal clustering of the pre-seismic EM bursts in terms of burst lifetime
(dura-101 102 103 104 10−1 100 101 102 103 104 N(T) ∼ T −1.94 N(T) T (sec)
Fig. 6. The distribution of the time duration T of each EM pulse related to the observed pre-fracture EM emission. The strait line is the respective power-law fit. The power-law observed here provides another indication that the systems have developed scaling behavior through a critical process.
tion) and waiting time (time interval between two successive EM events) focusing on a potential power-law distribution. 7.1 Temporal correlations in terms of “waiting-times”
statistics
In Fig. 5 the behavior of the distribution N (τ ) of the waiting times τ is checked. The analysis reveals that, the waiting times display a clear power-law distribution N (τ )=Aτ−γ with γ =1.8, indicating that the probability of detecting two EM anomalies separated by a time interval τ decreases as a power-law ∼τ−1.8. Note that Vespignani et al. (1995) mea-sured an exponent γ =1.6 via acoustic signals from labora-tory samples subjected to an external stress.
The occurrence of power-law in the distribution of the waiting times for the precursory EM fluctuations represents a clear indication of the existence of strong correlations be-tween successive EM bursts. Notice that, several authors ar-gue that self organized criticality (SOC) should be discarded as the underlying dynamics if N (τ ), constructed from exper-imental data, does not decay exponentially (Boffetta et al., 1999). On the contrary, Sanchez et al. (2002) suggest that waiting time statistics cannot be used as a necessary test for SOC behavior in real systems.
7.2 Temporal correlations in terms of “lifetime” statistics The distribution of the lifetimes displayed in the logarithmic plot of Fig. 6. A line with slope –1.9 can fit the experimental results. Thus the distribution of lifetimes follows the scaling law N (T )=T−δ with δ=1.9. This indicates that the proba-bility N (T ) of detecting EM anomalies with duration T de-creases on intermediate scales as a power-law N (T )∼τ−1.9. This finding further supports the hypothesis of the existence
of strong correlations between EM events in the precursory phenomenon under study.
In summary, the important result to be stressed is that the sequence of pre-seismic EM events is organized in bursts that have a distribution of lifetimes and a distribution of waiting times that are power-laws. We remember that the amplitude and energy distributions of this EM sequence also exhibit power-law behavior. These experimental results constitute a further indication that the system evolves without charac-teristic time and length scales, which is a typical feature of the existence of an underlying critical dynamics.
8 Similarities of multiple fracturing from laboratory to geophysical scale
We remember the proposal that if a great earthquake can be viewed as a critical point, precursors of earthquakes should follow universal power-laws Stanley (1999). Like most crit-ical points, the resulting exponents, although universal, will depend on certain properties in the system: the dimensional-ity, the range of interactions, and perhaps other aspects.
In Sect. 5, the statistical analysis revealed that the cumula-tive distribution function of the amplitudes in the pre-seismic EM time series follows the power-law N (>A)∼A−b, where
b=0.62. The amplitude distribution of the binned data will follow the power-law N (A)∼A−ζ , where ζ =(1+b) (Elgaz-zar, 1998), i.e. ζ =1.62. Remembering that the squared am-plitude of the events is proportional to their energy, we can express the distribution function also in terms of the number of events with energy between E and E+dE. Will follow the distribution N (E)∼E−η , where η=(1+ζ )/2 (Maes et al., 1998), i.e. η=1.31.
Experiments on, mostly, three-dimensional systems have yielded power-laws for the acoustic energy release; the typi-cal exponent is ranged from 1 to 1.5 (Salminen et al., 2002, and references therein). More precisely, in the following, we compare the energy distribution N (E)∼E−1.31 of the pre-seismic EM events in binned data with that N (E)∼E−B obtained from seismicity, acoustic emissions on rock sam-ples, acoustic emissions produced during volcanic activity, and theoretical models reproduced the major dynamical fea-tures observed in seismicity. Therefore: (i) The distribution of energies released at any earthquake is well described by the power-law, N (E)∼E−B, where B≈1.4 − 1.6. (ii) Dio-dati et al. (1991) have presented experimental evidence of ultrasonic acoustic emission (AE) from volcanic rocks pro-duced by a survey of the Strobolian activity; the scaling law
N (E)∼E−1.5fits the distribution of the AE bursts. (iii) Petri et al. (1994) have performed the statistical analysis of acous-tic emission time series in the ultrasonic frequency range, obtained experimentally from laboratory samples subjected to external uni-axial elastic stress. They found a power-law scaling behavior in the acoustic emission energy distribution
N (E)∼E−B with B=1.3 ± 0.1. We remember that acous-tic emission in rocks has been studied as a model of nat-ural seismicity. (iv) Maes et al. (1998) have studied
criti-cality in creep experiments on cellular glass. The statisti-cal analysis of the acoustic signals emitted by the sample, while stress is being internally redistributed, shows that the energy distribution follows a power-law, N (E)∼E−1.5. (v)
B=1.5 is also the value of the exponent measured by Can-nelli et al. (1993) via acoustic emission associated to frac-ture processes in hydrogenated niobium. (vi) Salminen et al. (2002) have reported tensile failure experiments on paper sheets. The acoustic emission energy follows power-law dis-tribution which remains true while the strain rate is varied by more than 2 orders of magnitude. The energy statistics has the exponent B=1.25. The authors suggest that a large-scale analogy is earthquakes. (vii) Houle and Sethna (1996) found that the crumpling of paper generates acoustic pulses with a power-law distribution in energy P (E)=E−B, B=1.3−1.6. (viii) Chen et al. (1991) have constructed a dynamical model of crack propagation. Taking into account both elastic com-pression and static friction the authors obtained B≈1.5. (ix) Gabrielov et al. (2000) have recently developed a “colliding-cascades model”. This model seemingly exhibits regulari-ties that are common in a wide class of complex hierarchi-cal systems, not necessarily Earth specific. On the basis of this model, the authors suggest that the B value should be 1.53 for main earthquakes. (x) Cowie et al. (1993); Sornette et al. (1994); Cowie et al. (1995) have developed a model of self-organized earthquakes occurring on self-organized faults Their study suggest that the value should be 1.3.
It was found empirically that one could form an analo-gous of the Mendeleev table if one partitions all critical sys-tems into universality classes (Stanley, 1999). The above-mentioned systems with same scaling functions and sim-ilar values of critical-point exponents all could belong to the same universality class. This hypothesis strongly rein-forces the concept that the detected pre-seismic anomaly cor-responds to the emergence of long-range correlations in the stress field preceding the critical point (main rupture). In ad-dition, these findings may indicate that both the pre-seismic mechanical and electromagnetic emissions might be due to the opening cracks as this comes in light from laboratory experiments (Yamada et al., 1989; Fifolt et al., 1993; Pe-trenko and Gluschenkov, 1996; Mavromatou and Hadjicon-tis, 2001). In the next section we attempt to further explore the former suggestion.
9 EM signatures of “critical point” hypothesis in the energy domain
Observations of the acceleration of seismic moment leading up to large events and “stress shadows” following them have been interpreted as a fundamental evidence that seismic cy-cles represent the approach and retreat of a fault network from a critical state (Sornette and Sammis, 1995; Sammis and Sornette, 2002). Figure 1a demonstrates a clear accel-erating EM energy release rate lasting several days and cul-minated with the largest precursory signal that ceased a few hours before the main event. In this section we test whether
1 2 3 4 5 x 10⁶
Cumulative Beniof strain
0 0.5 1 1.5 2 2.5 x 10⁸Cumulative amplitude of EM activity
20/07/99 28/07/99 05/08/99 13/08/99 21/08/99 29/08/99 06/09/99
Athens EQ
Cumulative Beniof strain Cumulative amplitude of EM activity
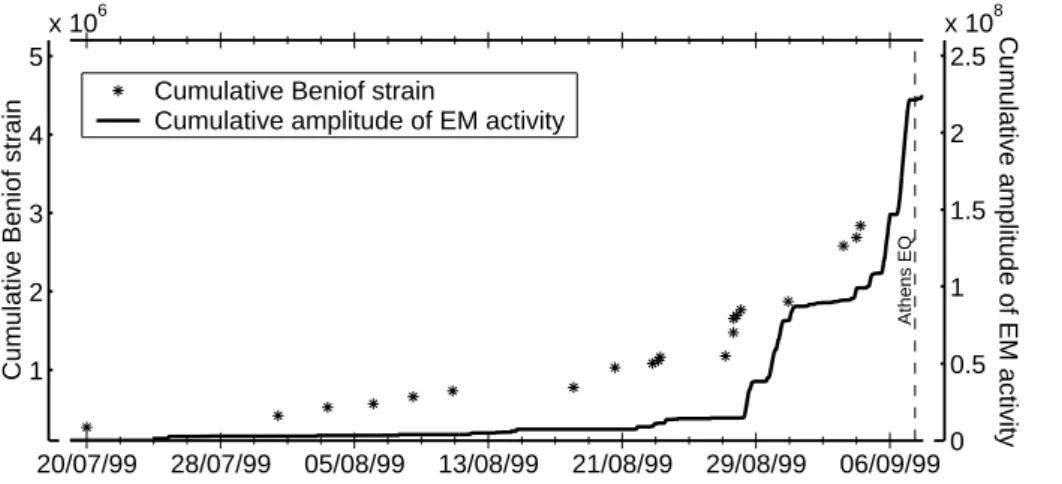
Fig. 7. The Benioff cumulative strain release computed over circle (R=110 km) on the epicenter of the Athens earthquake as a function of time along with the Benioff cumulative electromagnetic energy release in arbitrary units as a function of time. The strong similarity of the temporal evolution of both the seismic and the EM energy release approach-ing the main event is pronounced. Provenance of seismicity data is http://www.gein.noa.gr/services/cat.html for the period 10 May 1999–7 Septem-ber 1999.
the temporal evolution of the precursory seismicity associ-ated with the Athens seismic event is correlassoci-ated with the de-tected precursory EM activity.
A number of publications have suggested that seismicity over a wide region appears to be modified before a major event. The time-to-failure model is a technique in which a failure function is fitted to a time series of accumulated Be-nioff strain ε(t )=(P√
E)(t ), where E is the energy release of an earthquake, before a large earthquake. In the studies by (Bufe and Varnes, 1993; Sornette and Sammis, 1995; Jo-hansen et al., 1996) premonitory escalation of seismicity is represented by the function
ε(t ) = A − B(tf −t )m (3) where tf is the failure time, while the constants A, B, m, are positive.
Recently, Tzanis and Makropoulos (2002) have shown that prior to the Athens earthquake, a power-law ε(t)=A−B(tf−
t )m acceleration of seismic energy release was observed, which could be modelled to yield fair estimates of the crit-ical time, epicentral area and magnitude of the event. The authors have established a critical radius of 110 km. Figure 7 shows the traditional cumulative Benioff strain release ε(t) as a function of time computed over circle (R=110 km) on the epicenter of the Athens earthquake, along with the “cu-mulative Benioff EM energy release” (P√E)(t )∼(P A)(t)
(in arbitrary units) as a function of time, where E∼A2is the energy of an EM event and A is the amplitude. One can observe the similarity of the temporal evolution of both the mechanical and the EM energy release as the critical point approaches. Thus, the evolution of the quantity (P A)(t)
also enables us to monitor the continuous development of the upscaling fracture process through time.
It is remarkable that Rabinovitch et al. (2001) have also re-ported an accelerating EM energy as the global failure of lab-oratory sample approaches. The relation (P√
E)(t )=A − B(tf−t )mhas successfully tested the pre-fracture EMR data, where E∼A2is the energy of an EM pulse.
These experimental finding further supports the hypothe-sis of having precursory elastic / EM emissions proportional
to the energy of the bonds broken during the cracks evolu-tion (Caldarelli et al., 1996; Bahat et al., 2002). We focus on the subsequent experimental fact that may support the for-mer consideration. The EM phenomenon recorder before the Athens earthquake ends in two very strong signals (Fig. 1a): the first signal contains approximately 20% of the total EM energy received and the second the remaining 80% (Eftaxias et al., 2001a). The fault modeling of the Athens earthquake, based on information obtained by radar interferometry (Kon-toes et al., 2000), predicts two faults: the main fault segment is responsible for 80% of the total energy released, with the secondary fault segment for the remaining 20%. Notice that a recent seismic data analysis carried out by M. Kikuchi, indi-cates that there was probably a subsequent (Mw=5.5) earth-quake after about 3.5 s of the main event (Mw=5.8) (Eftaxias et al., 2001a).
As mentioned, observations of the acceleration of seis-mic moment leading up to large events and “stress shadows” following them have been interpreted as a fundamental evi-dence that seismic cycles represent the approach and retreat of a fault network for a critical state (Sammis and Sornette, 2002). Therefore, the observed acceleration of the EM emis-sion leading up to EM large event and “EM shadow” follow-ing this could be interpreted as an electromagnetic confirma-tion of the critical point hypothesis.
10 Thermal Infrared radiances possibly associated with Athens earthquake
Several studies have done, suggesting on the basis of satel-lite and ground-based observations that space-time anoma-lies in the Thermal Infrared (TIR) radiances fields mea-sured by satellite can be related to seismogenic areas dis-tribution, as well as to their activation before earthquakes. The commonly accepted explanation of this correlation re-lies on the following, simplified, consideration: Earth de-gassing activity is expected (i) to be generally more intense alongside seismogenic faults (spatially stable anomalies) and (ii) to increase in the pre-seismic phase as far as the pro-cess of micro-cracks extensive formation proceeds under a
continuously increasing stress field (space-time non-stable anomalies) (Tramutoli et al., 2001). Filizzola et al. (2004) have reported that satellite monitoring of thermal anoma-lies, possibly associated to the Athens earthquake prepara-tion process, have been emerged simultaneously with the launch of the kilohertz electromagnetic anomalies. No TIR anomalies were detected after the earthquake occurrence. This evidence further encourages the seismogenic origin of the observed EM phenomenon.
11 A possible electromagnetic trace of the Kaizer effect (or Kaizer effect combined with log-periodic oscilla-tions)
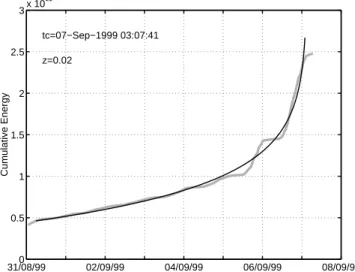
Figure 8 shows the cumulative Benioff type EM energy re-lease (P√
E)(t ), where E∼A2 is the energy of an EM pulse, during the last few days before the Athens earthquake (grey line), while, the black line shows the least squares fit of the data by a simple power-law (P√
E)(t )=A−B(tf−t )m. One can observe a possible trace of oscillations decorating the main power-law behavior. We comment on these oscilla-tions.
1. Irreversible deformation of rocks is accompanied by the Kaizer effect: if the heterogeneous material is loaded, then unloaded before fracture, and loaded again, only a small number of micro-fractures are detected before at-taining the previous load. Micro-fracturing activity in-creases dramatically as soon as the largest previously experienced stress level are exceeded indicating the be-ginning of further damage in rocks (Chelidze, 1986; Garcimartin et al., 1997). In a recent review article Lavrov (2003) discusses experimentally established fea-tures of the Kaizer effect, including mechanism and the-oretical models of the phenomenon.
We suggest that the observed oscillations around the main power-law could be considered as a signature of the non-monotonous tectonic stress variation, i.e. as an EM hallmark of the Kaizer effect in the geophysical scale.
2. In a recent series of papers, there has been growing ex-perimental evidence of log-periodic structures decorat-ing the main power-law behavior in acoustic emissions prior to rupture (Anifrani et al., 1995) and in the seis-mic precursory activity before large earthquakes, (Sor-nette and Sammis, 1995; Saleur et al., 1996a,b; Varnes and Bufe, 1996; Gluzman and Sornette, 2001). Using computer simulation Sahimi and Arbadi (1996) have shown that, near the global failure point, the cumula-tive elastic energy released during fracturing of hetero-geneous solids follows a power-law with log-periodic corrections to the leading term. The log-periodic os-cillations may result from a partial breakdown of the continuous scale-invariance symmetry into a discrete-scale-invariance (DSI) symmetry (Sornette, 2000), as occurs for instance in hierarchical lattices. Sahimi and
31/08/99 0 02/09/99 04/09/99 06/09/99 08/09/99 0.5 1 1.5 2 2.5 3x 10 11 z=0.02 tc=07−Sep−1999 03:07:41 Cumulative Energy
Fig. 8. The gray line shows the temporal evolution of the Be-nioff type cumulative electromagnetic energy received during the last seven days before the Athens earthquake. The black line fits the data according to the formula A + B(t − tc)−zwhere z=0.02 and
tc=03 : 07 : 41 GMT on 7 September 1999. One can observe that
oscillations decorate the main power-law.
Arbadi (1996) suggest that the interplay between the heterogeneities of rock and the stress field generates dy-namically such a DSI, and does not have to be present in the rock structure itself. This suggestion is sup-ported by Huang et al. (1997). The authors suggest that short-wavelength Mullins-Sekerka instability, together with strong screening effects, generate spontaneously a DSI in growth phenomena; a signature of this DSI is the presence of log-periodic oscillations correcting the usual power-laws. Log-periodic oscillations have also been documented in the fractal structure of arrays of cracks in geological media (Ouillon et al., 1996).
The Log-periodic oscillations are modulated in frequency with a geometric increase of the frequency on the approach to the time of rupture tc. Physically, the oscillations con-tain information on tc. This model gives reliable predictions of the rupture of composite materials and these predictions are now routinely used industrially (Johansen and Sornette, 2000; Sornette and Le Floc’h, 2003).
Figure 8 reveals that the reported precursory oscillations are modulated in frequency with a decrease of frequency on the approach to the time of rupture. Therefore, these os-cillations could not be considered as a fingerprint of a log-periodic time-to-failure behaviour. However, it is reasonable that the oscillations around the main power-law could be con-sidered as a signature of the Kaizer effect combined with a log-periodic time-to-failure behavior.
12 The limits of similarity in the dynamics of the multiple fracturing
Neutron stars are believed to have solid crust, which may ex-hibit tectonic activity analogous to earthquakes. These “star-quakes” have been invoked to explain several phenomena as-sociated with neutron stars, such as the flashes of low-energy
γ-ray repeaters (SGRs). A group of 111 starquakes with ce-lestial coordinates 1806–20 were recorded during continuous observation from August 1978 to April 1985. They occurred about 40 000 years ago.
Cheng et al. (1996) and Kossobokov et al. (2000) have revealed that the recorded SGR 1806–20 sequence of star-quakes shows a power-law energy distribution. We remem-ber that Rabinovitch et al. (2001) have shown that both the Gutenberg-Richter-type and the Benioff strain-release rela-tionship, for earthquakes and starquakes, are shown to extent to the microscale. Finally, we have demonstrated that the pre-seismic EM anomalies are matched with a Gutenberg-Richter cumulative amplitude distribution with b=0.62, a value that (i) measured by Rabinovitch et al. (2001) via electromagnetic emission associated to fracture processes in rocks, and (ii) falls within the observed values for earth-quakes.
The above-mentioned sequence of starquakes shows not only the power-law energy distribution, but also “symp-toms” of a transition to the main rupture common with earth-quake sequences and pre-seismic electromagnetic anomalies. Hence, the association of starquakes into clusters is rather clear from Figs. 1 and 3 in reference (Kossobokov et al., 2000). There, we see a number of clusters before the main event. The former Fig. 3 also shows a power-law increase
(P√
E)(t )for 111 SGR1806–20 starquakes, while, one can observe a possible trace of logarithmic oscillations. The sta-tistical similarities between earthquakes, SGR events, pre-fracture EM events from laboratory to geophysical scale may argue for physically similar origins. We remember that the source of a starquake, i.e. the fracture in the neutron star crust, may release strain energy up to 1046erg. Thus the lim-its of similarity in the dynamics of the multiple fracturing are dramatically expanded.
13 Discussion
In this study we have performed the statistical analysis of the EM anomalies detected prior to the Athens earthquake. We find that both the amplitudes and energies of the “EM events” follow power-law distributions with exponents consistent with other critical realizations obtained there via real lab-oratory measurements, theoretical predictions or computer simulations even with earthquakes. We have also monitored the distribution of the time interval between “EM events” and the distribution of the duration of the EM pulses. In both cases we also find a power-law. We propose that the observed power-laws correspond to the emergence of long-range correlations in the pre-focal area. The results also
sig-nalize that the system evolves without characteristic time and length scales.
A previous fractal spectral analysis has revealed the fol-lowing collection of particular features in the precursory kilohertz EM activity: (i) emergence of memory effects, (ii) increase of the spatial correlations in the EM time-series with time, (iii) gradual predominance of large “EM events” as the main shock is approached, (iv) decrease of the anti-persistence behavior, (v) appearance of anti-persistence proper-ties in the tail of the precursors, and finally, (vi) significant divergence of the EM energy release rate. These features distinguish the dynamics in a disordered system close to its critical point. The present analysis has added supplemen-tary physically powerful arguments/necessities of an under-lying approach to the critical point: (vii) “Gutenberg-Richter type” distribution of “EM events” in terms of amplitude and energy consistent with earthquakes as well as with other crit-ical realizations, (viii) power-law waiting time distribution, (ix) power-law distribution of the durations of the EM pulses, (x) similarity of the temporal evolution of the elastic and the EM energy release.
It might be argued that beyond any terminology all the above mentioned EM fingerprints distinguish the dynamics in a heterogeneous medium close to its final rupture, and hence, might be considered as candidate precursors of the global instability.
There is accumulated evidence that distributed seismic-ity is a problem in statistical physics: the development and dynamics of fault systems has been studied as a non-equilibrium critical phenomenon. This association has im-portant implications regarding earthquake hazard assessment and forecasting (Kossobokov et al., 2000). In the frame-work of this consideration, the observed precursory EM pe-culiarities are consistent with the “Critical Point Earthquake Model” (Sornette and Sammis, 1995).
All the above results yield to the suggestion that the study of precursory EM emissions might be possible to illuminate from another view-point the last stage of the fracture (or earthquake) preparation process. We propose that the ap-pearance of a sequence of EM anomalies that develops in time in agreement with the above mentioned group of physi-cally powerful arguments could give a hint of a considerable probability for a transition to a major rupture.
The conceptual framework of critical phenomena is in-creasingly finding application in other fields, ranging from chemistry and biology on the one hand to econophysics and liquid water and even internetquakes. Why is this? One pos-sible answer concerns the way in which correlations spread throughout a system comprised of subunits. The critical frac-ture suggests that as the damage increases, a new “phase” ap-pears, where micro-cracks begin to merge leading to cooper-ative effects; finally, the main fracture is formed leading to global failure. The challenge is to determine the above men-tioned time interval during which short-range correlations evolves to long-range correlations. The collection of critical features/necessities observed in the sequence of EM anoma-lies detected prior to the Athens earthquake could specify
such a time interval. This might be indicating that the pro-posed method of analysis is interesting for readers belonging to different scientific fields.
Acknowledgements. We are grateful to D. Sornette and to the
anonymous reviewer for reviewing the original manuscript, whose critical and constructive comments contributed to enhancing the value of the manuscript.
Edited by: J. B¨uchner Reviewed by: two referees
References
Aki, K.: A probabilistic synthesis of precursory phenomena, in: Earthquake Prediction, Maurice Ewing Series 4, edited by Simp-son, D. and Richards, P., AGU, Washington, D.C., 566–574, 1981.
Al-Kindy, F. and Main, I.: Testing self-organized criticality in the crust using entropy: A regionalized study of the CMT global earthquake catalog, J. Geophys. Res., 108, 5-1–5-9, 2003. Anifrani, J.-C., Le Floc’h, C., Sornette, D., and Souillard, B.:
Uni-versal log-periodic correction to renormalization group scaling for rupture stress prediction from acoustic emissions, J. Phys. I France, 5, 631–638, 1995.
Bahat, D., Frid, V., Rabinovitch, A., and Palchik, V.: Exploration via electromagnetic radiation and fractographic methods of frac-ture properties induced by compression in glass-ceramic, Inter-national Journal of Fracture, 116, 179–194, 2002.
Bak, P. and Tang, C.: Earthquakes as a self-organized critical phe-nomenon, J. Geophys. Res., 94, 15 635–15 637, 1989.
Barton, C. and Zoback, M.: Self-similar distribution and properties of macroscopic fractures at depth in crystalline rock in the Cajon Pass scientific borehole, J. Geophys. Res., 97, 5181–5200, 1992. Boffetta, G., Carbone, V., Giuliani, P., Veltri, P., and Vulpiani, A.: Power laws in solar flares: Self-organized criticality or turbu-lence?, Phys. Rev. Lett., 83, 4662–4665, 1999.
Bowman, D., Ouillon, G., Sammis, C., Sornette, A., and Sornette, D.: An observational test of the critical earthquake concept, J. Geophys. Res., 103, 24 359–24 372, 1998.
Bufe, C. and Varnes, D.: Predictive modelling of the seismic cycle of the greater San Francisco Bay region, J. Geophys. Res., 98, 9871–9883, 1993.
Caldarelli, G., Di Tolla, F., and Petri, A.: Self-organization and annealed disorder in a fracturing process, Phys. Rev. Lett., 77, 2503–2505, 1996.
Cannelli, G., Cantelli, R., and Cordero, F.: Self-organized critical-ity of the fracture processes associated with hydrogen precipita-tion in niobium by acoustic emission, Phys. Rev. Lett., 70, 3923– 3926, 1993.
Chelidze, T.: Percolation theory as a tool for imitation of fracture process in rocks, Pure Appl. Geophys., 124, 731, 1986. Chen, K., Bak, P., and Obukhov, S.: Self-organized criticality in a
crack-propagation model of earthquakes, Physics Review A, 43, 625, 1991.
Cheng, B., Epstein, R., Guyer, R., and Young, C.: Earthquake-like behaviour of soft γ -ray repeaters, Nature, 382, 518–520, 1996. Contoyiannis, Y. and Diakonos, F.: Criticality and intermittency in
the order parameter space, Phys. Lett. A, 268, 286–292, 2000.
Contoyiannis, Y., Diakonos, F., and Malakis, A.: Intermittent dy-namics of critical fluctuations, Phys. Rev. Lett., 89, 35 700/1– 35 700/4, 2002.
Contoyiannis, Y., Diakonos, F., Kapiris, P., Peratzakis, A., and Ef-taxias, K.: Intermittent dynamics of critical pre-seismic electro-magnetic fluctuations, Phys. and Chem. of the Earth, accepted, 2004.
Cowie, A., Sornette, D., and Vanneste, C.: Multifractal scaling properties of a growing fault population, Geophys. J. Int., 122, 457–469, 1995.
Cowie, P., Vanneste, C., and Sornette, D.: Statistical physics model for spatio-temporal evolution of faults, J. Geophys. Res., 98, 21 809–21 821, 1993.
de Boer, J., Jackson, A., and Wettig, T.: Criticality in simple models of evolution, Phys. Rev. E., 51, 1059–1073, 1995.
Diodati, P., Marchesoni, F., and Piazza, S.: Acoustic emission from volcanic rocks: An example of self-organized criticality, Phys. Rev. Let., 67, 2239–2241, 1991.
Eftaxias, K., Kopanas, J., Bogris, N., Kapiris, P., Antonopoulos, G., and Varotsos, P.: Detection of electromagnetic earthquake precursory signals in Greece, Proc. Japan Acad., 76(B), 45–50, 2000.
Eftaxias, K., Kapiris, P., Polygiannakis, J., Bogris, N., Kopanas, J., Antonopoulos, G., Peratzakis, A., and Hadjicontis, V.: Sig-natures of pending earthquake from electromagnetic anomalies, Geophys. Res. Lett., 28, 3321–3324, 2001a.
Eftaxias, K., Kapiris, P., Polygiannakis, Y., Hadjicontis, V., Che-lidze, Z., Zilpimiani, D., and CheChe-lidze, T.: Seismogenic radio-emission as a signature of the earthquake preparation process, Journal of the Georgian Geophysical Society, 6, 3–16, 2001b. Eftaxias, K., Kapiris, P., Dologlou, E., Kopanas, J., Bogris, N.,
Antonopoulos, G., Peratzakis, A., and Hadjicontis, V.: EM anomalies before the Kozani earthquake: A study of their be-havior through laboratory experiments, Geophys. Res. Lett., 29, 69/1–69/4, 2002.
Eftaxias, K., Kapiris, P., Polygiannakis, J., Peratzakis, A., Kopanas, J., and Antonopoulos, G.: Experience of short term earthquake precursors with VLF-VHF electromagnetic emissions, Natural Hazards and Earth System Sciences, 3, 217–228, 2003. Eftaxias, K., Frangos, P., Kapiris, P., Polygiannakis, J., Kopanas, J.,
Peratzakis, A., Skountzos, P., and Jaggard, D.: Review/ model of pre-seismic electromagnetic emissions in terms of fractal elec-trodynamics, Fractals, in press, 2004.
Elgazzar, A.: An inhomogeneous self-organized critical model for earthquakes, Physica A, 251, 303–308, 1998.
Fifolt, A., Petrenko, F., and Schulson, M.: Preliminary study of electromagnetic emissions from cracks in ice, Phil. Mag. B, 67, 289–299, 1993.
Filizzola, C., Pergola, N., Pietrapertosa, C., and Tramutoli, V.: Ro-bust satellite techniques for seismically active areas monitoring: a sensitivity analysis on September 7th 1999 Athens earthquake, Physics and Chemistry of the Earth, accepted, 2004.
Frid, V., Rabinovitch, A., and Bahat, D.: Electromagnetic radiation associated with induced triaxial fracture in granite, Philos. Mag. Lett., 79, 79–86, 1999.
Gabrielov, A., Keilis-Borok, V., Zaliapin, I., and Newman, W.: Crit-ical transitions in colliding cascades, Phys. Rev. E, 62, 237–249, 2000.
Garcimartin, A., Guarino, A., Bellon, L., and Ciliberto, S.: Statis-tical analysis of fracture precursors, Phys. Rev. Lett., 79, 3202– 3205, 1997.
cannot be predicted, Science, 275, 1616–1617, 1997.
Gluzman, S. and Sornette, D.: Log-periodic route to fractal func-tions, Phys. Rev. E, 65, 036 142-1–036 142-19, 2001.
Gokhberg, M., Morgunov, V., and Tomizawa, I.: Experimental mea-surements of electromagnetic emissions possibly related to earth-quake in Japan, J. Geophys. Res., 87(B9), 7824–7828, 1982. Grasso, J.-R. and Sornette, D.: Testing self-organized criticality by
induced seismicity, J. Geophys. Res., 103, 1998.
Hainzl, S., Zoller, G., and Kurths, J.: Seismic quiescence as an indi-cator for large eartquakes in a system of self-orginized criticality, Geophys. Res. Let., 27, 597–600, 2000.
Hainzl, S., Zoller, G., and Scherbaum, F.: Earthquake clusters re-sulting from delayed rupture propagation in finite fault segments, J. Geophys. Res. Lett., 108, 2013, 2003.
Hayakawa, M.: Atmospheric and Ionospheric Electromagnetic Phe-nomena Associated with Earthquakes, Terrapub, Tokyo, 1999. Hayakawa, M. and Fujinawa, Y.: Electromagnetic Phenomena
Re-lated to Earthquake Prediction, Terrapub, Tokyo, 1994. Hayakawa, M. and Molchanov, O.: Seismo Electromagnetics,
Ter-rapub, Tokyo, 2002.
Heffer, K. and Beven, T.: Scaling relationships in natural fractures-data theory and applications, Proc. Eur. Petrol. Conf., 2, 367– 376, 1990.
Heimpel, M.: Critical behavior and the evolution of fault strength during earthquake cycles, Nature, 388, 865–868, 1997.
Houle, P. and Sethna, J.: Acoustic emission from crumpling paper, Phys. Rev. E, 54, 278–283, 1996.
Huang, Y., Ouillon, G., Saleur, H., and Sornette, D.: Spontaneous generation of discrete scale invariance in growth models, Phys. Rev. E, 55, 6433–6447, 1997.
Huang, Y., Saleur, H., Sammis, C., and Sornette, D.: Precursors, aftershocs, criticality and self-organized criticality, Europhys. Lett., 41, 43–48, 1998.
Johansen, A. and Sornette, D.: Critical ruptures, Eur. Phys. J. B, 18, 163–181, http://arXiv.org/abs/cond-mat/0003478, 2000. Johansen, A., Sornette, D., Wakita, H., Tsunogai, U., Newman, W.,
and Saleur, H.: Discrete scaling in earthquake precursory phe-nomena: evidence in the Kobe earthquake, Japan, J. Phys., I France, 6, 1391–1402, 1996.
Kakimi, T.: Magnitude-frequency relation for displacement of mi-nor faults and each significance in crustal deformation, Bull. Geol. Surv. Jap., 31, 467–487, 1980.
Kanamori, H. and Anderson, D.: Theoretical basis of some empir-ical relations on seismology, Bull. Seism. Soc. Am., 65, 1073– 1095, 1975.
Kapiris, P., Polygiannakis, J., Nomicos, K., and Eftaxias, K.: VHF-electromagnetic evidence of the underlying pre-seismic critical stage, Earth Planets Space, 54, 1237–1246, 2002.
Kapiris, P., Eftaxias, K., Nomikos, K., Polygiannakis, J., Dologlou, E., Balasis, G., Bogris, N., Peratzakis, A., and Hadjicontis, V.: Evolving towards a critical point: A possible electromagnetic way in which the critical regime is reached as the rupture ap-proaches, Nonlin. Proc. Geophys., 10, 511–524, 2003.
Kapiris, P., Eftaxias, K., and Chelidze, T.: The electromagnetic sig-nature of prefracture criticality in heterogeneous media, Phys. Rev. Lett., in press, 2004.
Knopoff, L.: The magnitude distribution of declustered earthquakes in southern California, Proc. Natl. Acad. Sci. USA, 97, 11 880– 11 884, 2000.
Kontoes, C., Elias, P., Sycioti, O., Briole, P., Remy, D., Sachpazi, M., Veis, G., and Kotsis, I.: Displacement field and fault model for the September 7, Athens earthquake inferred from the ERS2
satellite radar interferometry, Geophys. Res. Lett., 27, 3989– 3992, 2000.
Kossobokov, V., Keillis-Borok, V., and Cheng, B.: Similarities of multiple fracturing on a neutron star and on Earth, Phys. Rev. E, 61, 3529–3533, 2000.
Lavrov, A.: The Kaizer effect in rocks: principle and stress estima-tion techniques, Int. J. Rock Mech. Mining Sciences, 40, 151– 171, 2003.
Lei, X., Nishizawa, O., Kusunose, K., Cho, A., Satoh, T., and Nishizawa, O.: Compressive failure of mudstone samples con-taining quartz veins using rapid ae monitoring: the role of asper-ities, Tectonophysics, 328, 329–340, 2000.
Lei, X., Kusunose, K., Satoh, T., and Nishizawa, O.: The hierarchi-cal rupture process of a fault: an experimental study, Phys. Earth Planet. Inter., 137, 213–20–8, 2003.
Maes, C., Moffaert, A., Frederix, H., and Strauven, H.: Criticality in creep experiments on cellular glass, Phys. Rev. B, 57, 4987– 4990, 1998.
Main, I. and Al-Kindy, F.: Entropy, energy and proximity to criti-cality in global earthquake populations, Geophys. Res. Lett., 29, 25/1–25/4, 2002.
Mandelbrot, B.: The fractal geometry of nature, Freeman, New York, 1982.
Maslov, S., Paczuski, M., and Bak, P.: Avalanches and 1/f noise in evolution and growth models, Phys. Rev. Lett., 73, 2162, 1994. Mavromatou, C. and Hadjicontis, V.: Laboratory investigation of
the electric signals preceding the fracture of crystalline insula-tors, in: Earthquake thermodynamics and phase transformations in the earth’s interior, edited by Teisseyre, R. and Majewski, E., 501–517, Academic Press, 2001.
Meredith, P.: Fracture and failure of brittle polycrystals: an overview, in Deformation Processes in Minerals, Ceramics and Rocks, edited by Barder, D. and Meredith, P. 5–41, Unwin Hy-man, London, 1990.
Mogi, K.: Magnitude frequency relation for elastic shocks accom-panying fractures of various materials and some related problems in earthquakes, Bull. Earthquake Res. Instit., 40, 831–853, 1962. Newman, W. and Turcotte, D.: A simple model for the erthquake cycle combining self-organized complexity with critical point behavior, Nonlin. Proc. Geophys., 9, 453–461, 2002.
Nolen-Hoeksema, R. and Gordon, R.: Optical detection of crack patterns in the opening-mode fracture of marble, Int. J. Rock Mech. Min. Sci., 98, 11 935–11 940, 1987.
Ogawa, T., Oike, K., and Miura, T.: Electromagnetic radiations from rocks, J. Geophys. Res., 90, 6245–6249, 1985.
Olami, Z., Feder, H., and Christensen, K.: Self organized criticality in a continuous, nonconservative cellular automaton modeling earthquakes, Phys. Rev. Let., 68, 1244–1247, 1992.
Ouillon, G., Castaing, C., and Sornette, D.: Hierarchical geometry of faulting, J. Geophys. Res., 101, 5477–5487, 1996.
Petrenko, V. and Gluschenkov, O.: Crack velocities in freshwater and saline ice, J. Geophys. Res., 101(B5), 11 541–11 551, 1996. Petri, A., Paparo, G., Vespignani, A., Alippi, A., and Constantini, M.: Experimental evidence for critical dynamics in microfractur-ing processes, Phys. Rev. Let, 73, 3423–3426, 1994.
Ponomarev, A., Zavyalov, A., Smirnov, V., and Lockner, D.: Phys-ical modelling of the formation and evolution of seismPhys-ically ac-tive fault zones, Tectonophysics, 277, 57–81, 1997.
Rabinovitch, A., Frid, V., and Bahat, D.: Gutenberg-Richter-type relation for laboratory fracture-induced electromagnetic radia-tion, Phys. Rev. E, 65, 11 401/1–11 401/4, 2001.