HAL Id: hal-02932429
https://hal.archives-ouvertes.fr/hal-02932429
Submitted on 7 Sep 2020
HAL is a multi-disciplinary open access
archive for the deposit and dissemination of
sci-entific research documents, whether they are
pub-lished or not. The documents may come from
teaching and research institutions in France or
abroad, or from public or private research centers.
L’archive ouverte pluridisciplinaire HAL, est
destinée au dépôt et à la diffusion de documents
scientifiques de niveau recherche, publiés ou non,
émanant des établissements d’enseignement et de
recherche français ou étrangers, des laboratoires
publics ou privés.
swimming cells
Nicolas Garcia-Seyda, Laurene Aoun, Victoria Tishkova, Valentine Seveau,
Martine Biarnes-Pelicot, Marc Bajenoff, Marie-Pierre Valignat, Olivier
Theodoly
To cite this version:
Nicolas Garcia-Seyda, Laurene Aoun, Victoria Tishkova, Valentine Seveau, Martine Biarnes-Pelicot,
et al.. Microfluidic device to study flow-free chemotaxis of swimming cells. Lab on a Chip, Royal
Society of Chemistry, 2020, 20 (9), pp.1639-1647. �10.1039/d0lc00045k�. �hal-02932429�
ARTICLE
Microfluidic device to study flow-free chemotaxis of swimming cells
Nicolas Garcia-Seyda
1,§, Laurene Aoun
1,§,
Victoria Tishkova
2, Valentine Seveau
1,
Martine
Biarnes-Pelicot
1, Marc Bajénoff
3, Marie-Pierre Valignat
1, Olivier Theodoly
1,*
Microfluidic devices have been used in the last two decades to study in-vitro cell chemotaxis, but few existing devices generate gradients in flow-free conditions. Flow can bias cell directionality of adherent cells and precludes the study of swimming cell like naïve T lymphocytes, which only migrate in a non-adherent fashion. We developed two devices that create stable, flow-free, diffusion-based gradients and are adapted for adherent and swimming cells. The flow-free environment is achieved by using agarose gel barriers between a central channel with cells and side channels with chemoattractants. These barriers insulate cells from injection/rinsing cycles of chemoattractants, they dampen residual drift across the device, and they allow co-culture of cells without physical interaction, to study contactless paracrine communication. Our devices were used here to investigate neutrophil and naïve T lymphocyte chemotaxis.
Introduction
Microfluidic generation of chemical gradients was introduced about twenty years ago 1 and has been developed ever since. Gradient devices have been
used to study the chemotaxis of different cells such as bacteria, neutrophils, T lymphocytes, dendritic, endothelial and cancer cells 234567. We recently
described a new migration mode on immune cells termed swimming, where cells move in a non-adherent, non-confined environment 8. This lack of
adhesion makes swimming cells very sensitive to fluid flow. Immune cells respond to a vast variety of chemokine gradients 910,11, but to evaluate their
chemotaxis while swimming, it is required to generate gradients under negligible flow. This is particularly crucial in the case of naïve T lymphocytes, which only migrate in a non-adherent fashion 12. Chemotaxis of these cells is
mainly tested in Boyden chamber assays, which consists in counting the fraction of cells crossing a microporous membrane in response to a gradient of solute across it. These assays circumvent the necessity of cell adhesion. However, they only provide an endpoint analysis without live imaging, they can miss-score chemokinesis (random migration) for chemotaxis (directed migration), and they provide no precise information on migration parameters nor on gradient shape or dynamics.
Existing microfluidic gradient devices can be divided in two groups according to their functioning principle. Those maintaining stable gradients based on flow and diffusion, and those establishing local gradients using diffusion only. Examples of the first group are the gradient mixers, consisting of a sequential combination of splitting and merging channels 13, and the ‘Y’ shaped
converging channels 14. The main advantage of these devices is the ability to
generate controllable, long-term and stable gradients in space and time. The downside of flow-based gradients is that they can only be used on adherent cells, as they are exposed to flow and can be flushed out of the channels 1516.
Moreover, as certain cells are mechanosensitive, external forces create a direction bias as reported for neurons and immune cells 17–20 .
The second approach to generate gradients is based on diffusion, with the advantage of reducing the flow experienced by cells. In this case many strategies have been developed, most of them based on the generation of a gradient in a central channel by connecting it to lateral reservoirs acting as chemokine source and sink 21. Alternatively, microcapillaries are placed
between the central and lateral chambers acting as pseudo-barriers 622 or as
the test chamber where cell chemotaxis is scored23. Such setups create
long-term diffusion-based gradients, however they do so in the absence of insulating barriers, rendering it unsuited for loading and testing swimming cells. Another strategy is based on a device entirely fabricated in agarose, consisting of three parallel channels where chemokines are free to diffuse through the permeable gel walls 24. This design is simple; however, it does not
allow the incorporation of membrane valves to abrogate residual drifts, therefore rendering it inefficient for studying swimming cell chemotaxis. In a different setup, a gradient is established in a central channel where cells are
1 LAI, Aix Marseille Univ, CNRS, INSERM, Marseille, France. 2CINaM, Aix Marseille Univ, CNRS, Marseille, France.
3CIML, Aix Marseille Univ, INSERM, Marseille, France.
§Equal contributions
ARTICLE
Journal Name
2 | J. Name., 2012, 00, 1-3 This journal is © The Royal Society of Chemistry 20xx embedded in a 3D matrix, often consisting of collagen gel7,25. While this setup
renders a more physiological context as compared to cell migration in vivo, it describes cell migration only under confined conditions and therefore is not suited to analyze swimming cells.
Several microdevices allow studying cells in unconfined, shear-free conditions. One of them consists of covering a test chamber with a porous membrane and overlaying it with parallel source and sink channels, making a PDMS-membrane-PDMS composite 2,26–28. Another strategy is based on
microfluidic valves linking a chamber to side reservoirs 29. However, open
valves provide no physical barrier between the cells and the chemoattractant source. This may be a requisite in the case of using cells, rather than purified molecules, as the source of chemoattractant. The two populations of interacting cells may be required to remain separated over the course of the experiment, in order to better score their directionality, while at the same plane to allow simultaneous imaging. It is also necessary in many systems where the responding cell, upon reaching its target, modulates the chemokine gradient or triggers amplification waves leading to collective migration. Examples of such behaviors are immune tripartite interactions 30,31
or neutrophil swarming 32,33. To our knowledge, few devices offer such
capabilities, since composite devices with a sandwiched membrane preclude simultaneous imaging of both cell populations. An elegant solution consists of in-situ microfabricated membranes. This is achieved either by a UV-dependent polyethyleneglycol polymerization 34,35 or a spatially controlled
chitosan gel fabrication 36. Such microfluidic devices allow further
introduction of microfluidic valves to improve flow control, which makes them good candidates for swimming cell studies. However, the proofs of concept with in-situ microfabricated membranes remain limited to small diffusing molecules with less than 1 kDa molar mass. Further optimization may be needed to extend their use to larger molecules 35.
Here we sought to create a user-friendly, flow-free, diffusion-based device useful for studying chemotaxis of swimming cells, with the addition of a physical barrier insulating the test chamber. We developed two devices. The first design works in a flow-reduced environment and is suited for studying adherent cells. The second design incorporates valves to perform experiments in flow-free conditions and is suited for adherent, non-confined, swimming cells. The incorporated barriers are permeable for molecules at least as large as 40 kDa. In addition, they offer the possibility of studying contactless paracrine communication, by co-culturing different populations of cells without physical interaction between them.
Results
Device rationale and gradient dynamics
Our first goal was to fabricate a user-friendly device involving no tubings nor connections. Inspired by previously existing devices 37,38 we designed a wide
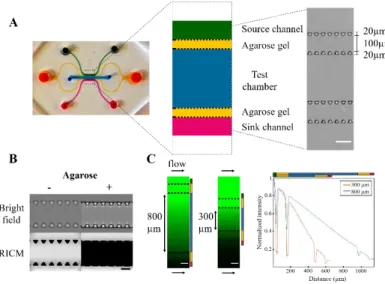
central channel with two parallel side channels used as the chemokine source and sink. These three channels are separated from each other by a double array of trapezoidal pillars, whose function is to hold a 1% agarose gel (Fig 1 A). The trapezoidal geometry of the pillars allowed an easy filling of the gel without leaking into the other channels (Fig 1 B). The size of the pillars was minimized to lower the width of the gel barrier, allowing the cells to experience a broader chemokine range at equilibrium, from approximately 25% to 75% of the chemokine concentration at the source. By varying the width of the central chamber, in e.g. 300 vs 800 µm width, different slopes were achieved upon gradient establishment (Fig 1 C).
Fig 1. Device rationale (A) Left, photograph of the device with the central channel colored in blue, agarose gel channels in yellow, and side channels in green and magenta. Middle, design of the device’s central part, keeping the same color code as on the left. Right, Bright field image of the central part before agarose addition, scale bar = 100µm (B) Bright field and Reflection Interference Contrast Microscopy (RICM) images of the trapezoidal pillars array, before and after addition of the agarose gel. The dark zone in RICM images reveals trapezoids adhered to the glass bottom and areas filled with gel. Scale bar = 50µm (C) Left, fluorescein gradients in 800µm and 300µm wide devices, snapshots taken upon reaching linearity. Right, normalized intensity profiles across the devices, highlighting the increase of slope for the narrower device, scale bar= 100µm.
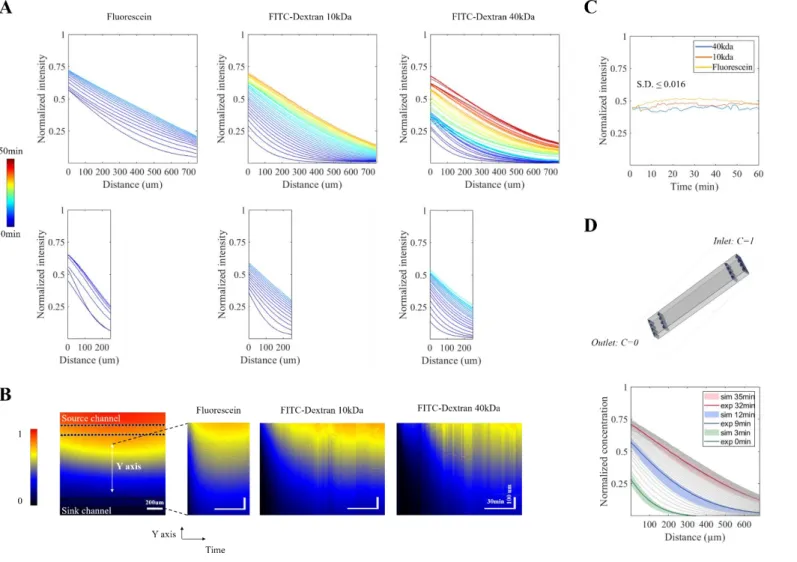
Three fluorescent molecules of different sizes, and therefore different diffusion coefficient, were used to track gradient dynamics in 300 and 800 µm devices: fluorescein, 10kDa Dextran and 40kDa Dextran (Fig 2 A). Upon linear equilibrium, all three gradients were stable for at least one hour, as seen on kymographs plotted from the central chamber (Fig 2 B). The increase of noise with the increasing size of the diffusing molecule results from a greater sensitivity to residual flow of slower diffusing molecules. However, when the local intensity variation was calculated over a 10µm width (cell body size) for a 60 min period, we obtained standard deviations smaller than 0.016 % (Fig 2 C). Finally, these dynamics were reproduced in silico by 3D finite element modeling of 10kDa Dextran, with the initial injection time as the only adjustable parameter and internal liquid flux set to zero. Matching of
simulated and experimental curves confirmed the dominance of diffusion over convection in our experimental data (Fig 2 D).
Fig. 2 Gradient establishment and stability (A) Normalized intensity profiles across the central chamber for Fluorescein, 10kDa and 40kDa FITC-dextran in 800µm (top) and 300 µm (bottom) devices. Time is color-coded from 0 to 50min, timepoints are plotted until beginning of curve overlapping. (B) Kymographs across the central chamber for Fluorescein, 10kDa and 40kDa FITC-dextran in 800µm devices. Fluorescence intensity is normalized to the maximum value observed in the source channel. (C) Normalized intensity in the middle of the central channel for an 800 µm device, over a 1hour period after the gradients reached stability. Standard Deviation (S.D.) was calculated for 2.5 µm (corresponding to the smallest size, one pixel) on the Y axis and 10 µm (corresponding to a cell body size) on the X axis. (D) Top, 3D geometry used for gradient modelling. Bottom, comparison of simulated (sim) and experimental (exp) data for 10kDa FITC-dextran at different time points with a time shift of 3min. Experimental curves are drawn in grey with selected timepoints highlighted in color. Shadowed areas represent simulated results within the reported error for its diffusion coefficient (90 ± 22 µm²/sec).
User-friendly device for adherent cells
Our user-friendly device offers a simplified experimental setup for studying chemotaxis, as gradient generation and cell loading is achieved by simply pipetting solutions into the wells. The gradient is generated by adding equal volumes of both chemokine and medium in the source and sink inlets, respectively, with the two outlets bearing smaller volumes to allow a unidirectional flow along the channels. As a proof of concept, we tested human Neutrophils migrating in a 15nM FMLP gradient, which was monitored
using the fluorescent marker fluorescein. As previously reported39 cells
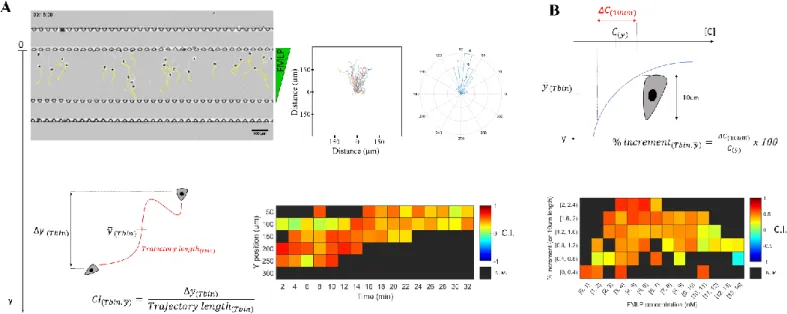
responded by migrating towards the source of chemokine (Fig 3 A, top row, and Supplementary movie 1). Tracks were analyzed by calculating the chemotactic index (CI), defined as the distance traveled along the chemokine axis (Δy) divided by the total trajectory length. CI’s were calculated every 2 min intervals, and then pooled together according to the timepoint and mean Y position of each cell. Stronger chemotaxis was observed at early timepoints (Fig 3 A, bottom row). Because the chemokine gradient evolves with time and the time zero is different for each experimental replica, this analysis precludes
ARTICLE
Journal Name
4 | J. Name., 2012, 00, 1-3 This journal is © The Royal Society of Chemistry 20xx data pooling. To allow merging data from independent experiments, CI’s were
plotted as a function of the local chemokine concentration and slope experienced by each cell. In this case the values are independent of time, taking advantage of all data recorded at equilibrium and during gradient
establishment, where cells are exposed to a steeper gradient profile. With this analysis, stronger chemotaxis was observed for high slopes (2-2.4% increment) and a lower concentration range (3-6 nM) (Fig 3 B).
Fig. 3 Chemotaxis of adherent cells in the user-friendly device (A) Top row, left, bright field image with cell tracks in yellow, middle, tracks overlaid on the origin (middle), and right, angle histogram of a representative experiment with Human neutrophils migrating towards a fMLP gradient (concentration at the source = 15nM, n = 22 tracks). Bottom left, illustration of the Chemotactic Index (C.I.) calculated as the ratio between the displacement in the gradient direction (Δ𝑦) over the total trajectory length. Bottom right, heatmap of C.I. values binned according to time (𝑇𝑏𝑖𝑛) and mean Y position (𝑦̅). (B) Top, Illustration of the local chemokine concentration (𝐶(𝑦̅)) and slope (ΔC) experienced by individual cells,
used to tag individual C.I. values. Bottom, C.I. values from 3 independent experiments (n = 68 tracks, 703 values calculated) were binned and plotted as a heatmap. N.M. = Not Measured.
The presence of a physical barrier insulating the central chamber offers the possibility of co-incubating different cell types to analyze their interaction in a contactless fashion. To exemplify such application, we loaded neutrophils in the central chamber and Escherichia coli in the source channel (Fig 4 A). With the bacteria confined to one side, their secreted compounds diffused to the central chamber and strongly attracted neutrophils (Fig 4 B and C), revealing the utility of our device to study cell paracrine communication. Altogether, this design allows a user-friendly operation for short term experiments on adherent cells.
Fig. 4 Co-incubation of Human neutrophils and bacteria (A) Cartoon illustrating the co-incubation of Human neutrophils and E. coli separated by the agarose gel channel, allowing bacterial chemoattractants to diffuse. Cartoon not scaled. (B) Bright field image of a representative experiment with cell tracks in yellow after 46min recording (scale bar=100µm). (C) Tracks aligned in the origin and angle rose for 2 independent experiments (n = 21 tracks).
Chemotaxis of non-adherent, swimming cells
While the gel barrier was effective at reducing flow in the central chamber, it did not fully abrogate it. We occasionally observed residual drift detaching
adherent cells (Supplementary movie 1). Such flow has a minor impact on the gradient profile as diffusion remains dominant, but it has a great effect on swimming cells. An example of such cells are naïve T lymphocytes, which migrate randomly on 2D substrates upon chemokine stimulation but they do so in the absence of firm integrin adhesion12. We reproduced such behavior
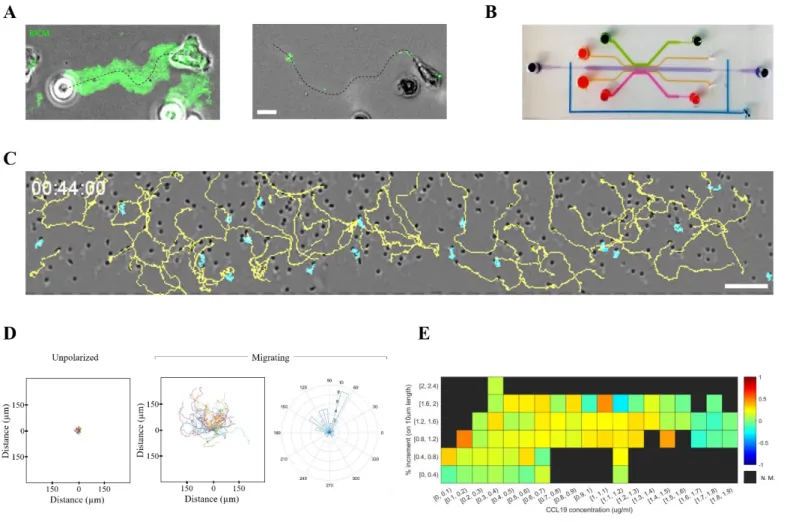
by recording the migration of these cells in the presence of the chemokine CCL19 on a substrate coated with ICAM-1 molecules, ligands of the integrin LFA-1, using Reflection Interference Contrast Microscopy (RICM) to assess cell adhesion fingerprints. Unlike their activated counterparts (effector T lymphocytes), naïve cells migrated without strong nor stable adhesion to the ICAM-1 substrate (Fig 5 A). Therefore, a strictly flow-free environment is required to study chemotaxis of these cells. In order to fully cancel residual
drift in the central chamber we took two measures. First, we added local valves on the central chamber inlet and outlet, to prevent flow along the horizontal axis (Fig 5 B). Second, we adapted the strategy from Aizel et al. 7
and submerged the whole device in culture media, to limit evaporation and dampen pressure imbalances between the source and sink channels, therefore abrogating remaining drift. Such measures fully cancelled residual flow in the central chamber, as observed by tracking round, unpolarized cells (Fig 5 C and D). With this new device, we could successfully image the migration of naïve T lymphocytes in CCL19 gradients (Fig 5 C and D and Supplementary movie 2). We observed migration towards the chemokine source at concentrations between 0.9 and 1.4 µg/ml (Fig 5 E).
Fig. 5 Chemotaxis of non-adherent, swimming cells (A) representative effector (left) and naïve (right) T lymphocyte migrating on an ICAM-1 coated substrate for a period of 5 and 10 minutes respectively. Projected RICM signal overlaid in green to reveal adhesion fingerprints, scale bar = 10µm. (B) Photograph of the second design with added channels for valve control colored in blue. (C) Bright-field image of a representative experiment with naïve T lymphocytes migrating towards a CCL19 gradient. Trajectories are overlaid in yellow for migrating cells and in cyan for unpolarized cells. Scale bar = 100µm. (D) Track analysis for the experiment in (C). From left to right, tracks overlaid on the origin for unpolarized (n=18) and migrating (n=49) cells, plus angle rose for migrating cells. (E) Heatmap of chemotactic Index (C.I.) as a function of chemokine concentration and gradient slope for 4 independent experiments (n=206 tracks, 4080 CI values calculated). N.M. = Not Measured.
Discussion
Neutrophil migration in chemokine gradients has been studied in a range of devices, from modified Boyden chambers 40 to linear 3 and exponential 41
ARTICLE
Journal Name
6 | J. Name., 2012, 00, 1-3 This journal is © The Royal Society of Chemistry 20xx flow-free conditions, which compromises the results as adherent neutrophils
are known to respond to flow, therefore their directionality can be biased
18,20,42–46. A similar argument applies to effector T lymphocytes 17–19,47 and
neurons 48,49, cells known to respond or be sensitive to flow. Regarding
swimming cells, gradients need to be generated in a flow-free manner in order not to wash them away. This is the case of naïve T lymphocytes, which polarize and migrate upon chemokine stimulation, such as CCL19, but they move in an integrin-independent manner. While the chemokinetic effect of CCL19 has been described50, the 2D migration of these cells along a soluble
gradient has, to our best knowledge, never been imaged due to the lack of an
in-vitro setup suited for studying swimming cell chemotaxis.
Here, we combined gel barriers and microfluidic valves to create diffusion-based gradients with reduced or zero flow. We implemented trapezoidal pillars as previously described 5152 to enhance gel filling. The low height of the
channels and the geometry used for the pillars reinforced agarose surface tension and prevented it from leaking to the side channels, even in the absence of hydrophobic surface treatments as demonstrated for bigger geometries 7 , where chemical patterning and silanization were necessary.
Our first design is user-friendly and was successfully applied to study neutrophil chemotaxis towards FMLP and live bacteria. This design is free of valves and tubings, with the side wells filled with pipettes, allowing for short term experiments in flow-reduced conditions. The second design incorporates microfluidic valves to fully abrogate flow and was tested with naïve CD4+ T lymphocytes migrating towards CCL19. This chemokine is secreted in lymph nodes by mature dendritic cells (mDC) loaded with antigen. However, a debate remains whether its function is to attract naïve lymphocytes 53 or to simply enhance their random scanning behavior, given
the chemokinetic effect of this molecule on 2D migration analysis 50. Here, we
recorded directed migration towards CCL19, in agreement with the model of directed migration towards antigen-loaded mDC’s. The lower C.I. values obtained as compared to the experiments with neutrophils are likely a result of the greater diffusivity of swimming cells, which increases their trajectory length, as already described for swimming effector lymphocytes 8. It also
supports the idea of a recruitment towards areas with antigen presentation without trapping them around one particular mDC, allowing local search for antigen to continue. This is an opposing behavior as compared to preying neutrophils, whose ultimate goal is to reach their prey and phagocyte it, therefore a ballistic motion towards the target is more efficient.
As a final remark, our devices offer a wide central chamber where a large number of cells are exposed to the same gradient range, allowing the analysis of many parallel events. This is an important feature as cell chemotaxis is intrinsically noisy 41, and strong statistic power is needed to highlight
differences in cell directionality. When working with swimming cells, the independently controlled input/output of the central chamber enables to flush and renew the cells, starting a new experiment without further
manipulation. All in all, these characteristics allow to collect more data per experiment than many previously reported devices.
Material and methods
Fabrication of the PDMS microdevices
Microfluidic devices were produced by soft photolithography and micromolding techniques. The user-friendly device was fabricated by spin coating one layer of the negative photoresist SU-8 (MicroChem Newton, MA) (SU-8 3050, h=80 µm) on a 4-inch silicon wafer (Siltronix). The photoresist was exposed to UV light through the mask containing the gradient design. SU-8 developer solution (MicroChem, Newton, MA) was used to dissolve unexposed parts of the photoresist. For the second design with valves, control channels were added by spin coating with positive photoresist AZ-40XT at 500 rpm for 10s and 2800 rpm for 20s. Spin coating was followed by a 7min baking at 125°C, alignment and exposure to UV for 30s, a second bake for 1min and development in AZ326 MIF for 3.5min followed by a third bake for 7min. Valve molds were produced on a separate wafer using SU-8 3050, h=40 µm. PDMS molding was performed by mixing the pre-polymer (Sylgard 184, Dow Corning) with the polymerization agent at 10:1 ratio for the devices and 12:1 ratio for the valve master molds. PDMS was directly poured on the device molds, followed by degassing in a vacuum bell and spin coated on the valve molds to obtain a thickness of 10 µm above the channels (actuator membrane). Molds where baked in a 65°C oven for at least 2 hours. After curing, only the devices were unmolded and both PDMS surfaces (devices and valve layers) were treated in UV-Ozone for 30min, overlaid on the valve mold and left overnight at 65ºC to assure strong bonding. The next day the PDMS montages were removed from the valve molds and the inlets and outlets were punched with 1.2 or 2mm punchers (Harris Uni-Core), before being sealed on a glass slide via plasma activation (Harrick Plasma) for 15min and final 100ºC baking for another 15min. User-friendly devices were directly bonded on glass, without the valve layer.
Surface treatments
After sealing the devices were immediately put in a humid-free chamber and exposed to vapor 3-Aminopropyltriethoxysilane (APTS; Sigma-Aldrich, St.Louis, MI) for 1 hour, then heated for 15 min on a 95°C hot plate. UltraPure Agarose (Invitrogen) 1% in Phosphate Buffer Solution (PBS) (Gibco) was used to fill the gel channels. The gel was kept in a 65ºC oven to prevent gelification and pipetted slowly into the channels while on a hot plate at 65°C. Devices were then transferred to a 4°C chamber for at least 30min to allow gelification. Afterwards the central channel was incubated with 10µg/ml human ICAM-1 (R&D Systems) for 1hr at room temperature, followed by blocking with 4% bovine serum albumin (BSA) (w/v; Axday, France) solution in PBS, for at least 30 min at room temperature. Channels were finally rinsed
with degassed PBS to remove air bubbles, and then culture media. Chemokines were prepared by diluting them in culture media at 1 - 2µg/ml for CCL19 (Miltenyi biotech) or 15nM for FMLP (Sigma Aldrich). Fluorescent markers of similar molecular weight were used to analyze gradient dynamics, Fluorescein (376 Da, Sigma) to monitor FMLP and 10 kDa Dextran FITC (Sigma) for CCL19. 40 kDa Dextran FITC (Sigma) was also used for gradient establishment experiments.
Cells
Whole blood from healthy adult donors was obtained from the “Établissement Français du Sang”. Peripheral blood mononuclear cells (PBMCs) were recovered from the interface of a Ficoll-Paque PLUS (GE Healthcare, Pittsburgh, PA) gradient. Naïve lymphocytes were extracted with the Miltenyi Naive CD4+ T Cell Isolation Kit II. Neutrophils were extracted with the EasySep™ Direct Human Isolation Kit (STEMCELL Technologies), following manufacturer instructions. After purification, cells were kept in RPMI 1640 medium supplemented with penicillin 100 U/ml (Gibco, Carlsbad, CA), streptomycin 100 µg/ml (Gibco, Carlsbad, CA), 25 mM GlutaMax (Gibco, Carlsbad, CA), and 10% fetal calf serum (FCS; Lonza, Basel, Switzerland) in a 37°C incubator with 5% CO2, until use.
Flow control and valves operation
For the design with valves, the chip was glued to a petri dish with dental silicon (Rotec Picodent Twinsil Speed). Cells were loaded on one side of the central channel and an empty tubing was plugged to the other side, connected to a 1ml syringe. The source and sink channels were connected to a microfluidic pressure control system (Fluigent MFCS-EZ) while keeping the valves closed. Immediately after connection, the whole device was covered with culture media and a control movie was launched. The pressure was kept at the minimum value were flow (typically below 1µl/min) at both side channels was observed, while balancing them until vertical drift across the central chamber was abrogated. Only then the valves were opened and the cells in the central channel were replaced with fresh ones, by generating negative pressure with the 1ml syringe. Valves were closed back, and a new movie was started to record cell chemotaxis. Several rounds of valve-opening and cell-flushing were performed to increase data collection per experiment.
Imaging and data analysis
Experiments were performed on an inverted Zeiss Z1 automated microscope (Carl Zeiss, Germany) equipped with a CoolSnap HQ CCD camera (Photometrics) and piloted by µManager1.4. Plan-Apochromat 10x/0.3,
20x/0.8, and 63x/1.4 objectives were used for bright-field and fluorescent modes, while a Neofluar 63/1.25 antiflex was used for reflection interference contrast microscopy (RICM) mode, in combination with a narrow band-pass filter (λ=546 nm ± 12 nm). Bright-field and RICM images were taken every 10
s intervals, fluorescence images for gradient monitoring every 1 min. RICM images were processed as follows: first the illumination was corrected by substracting a background image, secondly the pixel values were inverted to convert dark signal into positive values, finally a rolling ball algorithm (25 pixel = 10um radius) was applied to flatten the image. Cells were tracked using the FIJI plugin Trackmate 54. Tracks were exported and further analysis and plots
were performed with a MATLAB custom-made script (MATLAB software, The MathWorks, Natick, MA, USA). Gradient dynamics were analyzed with a custom-made FIJI macro. Fluorescence intensity values were extracted for each timepoint along a line drawn in the direction of chemokine diffusion, 100 pixels in width to average camera noise, and normalized with the equation:
Eq. 1: 𝐼−𝐼𝑚𝑖𝑛
𝐼𝑚𝑎𝑥−𝐼𝑚𝑖𝑛 x [C]
Where 𝐼𝑚𝑖𝑛 is the average value recorded on the sink channel (background),
𝐼𝑚𝑎𝑥 is the average value recorded on the source channel, and [C] is the
chemokine concentration applied at the source.
Diffusion modeling
The concentration gradient was calculated in 3D using finite element model in COMSOL Multiphysics5.4. The normalized chemical concentration was
considered fixed at the inlet and the outlet of the device at C=1 and 0 respectively. The governing equation in the entire system was time-dependent diffusion equation, while the internal liquid flux was set to zero. The diffusion coefficient was taken from ref 55 and assumed to be the same in
gel and in media, given the linear concentration profile seen in Fig 1 C. The time evolution was calculated for 120 min with time steps of 0.30 minutes.
Conflicts of interest
“There are no conflicts to declare”.
Author contributions
LA, NGS and OT designed and optimized the devices, LA, VS, and OT fabricated the molds, NGS and LA performed the experiments, NGS wrote the scripts for analysis and analyzed the data, VT modelled chemokine diffusion, NGS and LA wrote the manuscript, MPV, MB, MBP and OT revised it. OT supervised the project.
Acknowledgements
This work was supported by Agence Nationale de la Recherche (grants RECRUTE AAP CE15 and INTERPOL ANR-14-CE11-0001); LABEX INFORM; Région PACA and the Turing Centre for Living systems. This project has also
ARTICLE
Journal Name
8 | J. Name., 2012, 00, 1-3 This journal is © The Royal Society of Chemistry 20xx received funding from the European Union’s Horizon 2020 research and
innovation programme under the Marie Skłodowska-Curie grant agreement No713750. Also, it has been carried out with the financial support of the Regional Council of Provence- Alpes-Côte d’Azur and with the financial support of the A*MIDEX (n° ANR- 11-IDEX-0001-02), funded by the Investissements d'Avenir project funded by the French Government, managed by the French National Research Agency (ANR).We are also grateful to Vincent Studer (IINS, Bordeaux) as well as Jean-Baptiste Salmon and Gerald Clisson (LOF, Bordeaux) for sharing protocols on microfluidic valves. We also thank Frederic Bedu, Igor Ozerov and Gérald Clisson for welcoming us at the microfabrication facilities of LOF (CNRS-Solvay, Bordeaux) and Planete Cinam (CNRS-AMU, Marseille), and Laurence Borge for welcoming us at the Cell Culture Platform facility (Luminy TPR2-INSERM, Marseille).