HAL Id: hal-02958634
https://hal.archives-ouvertes.fr/hal-02958634
Submitted on 25 Nov 2020HAL is a multi-disciplinary open access
archive for the deposit and dissemination of sci-entific research documents, whether they are pub-lished or not. The documents may come from teaching and research institutions in France or abroad, or from public or private research centers.
L’archive ouverte pluridisciplinaire HAL, est destinée au dépôt et à la diffusion de documents scientifiques de niveau recherche, publiés ou non, émanant des établissements d’enseignement et de recherche français ou étrangers, des laboratoires publics ou privés.
Fast In Vivo Imaging of SHG Nanoprobes with
Multiphoton Light-Sheet Microscopy
Guy Malkinson, Pierre Mahou, Élodie Chaudan, Thierry Gacoin, Ali Sonay,
Periklis Pantazis, Emmanuel Beaurepaire, Willy Supatto
To cite this version:
Guy Malkinson, Pierre Mahou, Élodie Chaudan, Thierry Gacoin, Ali Sonay, et al.. Fast In Vivo Imaging of SHG Nanoprobes with Multiphoton Light-Sheet Microscopy. ACS photonics, American Chemical Society„ 2020, 7 (4), pp.1036-1049. �10.1021/acsphotonics.9b01749�. �hal-02958634�
Fast
In Vivo Imaging of SHG Nanoprobes with Multiphoton
Light-Sheet Microscopy
Guy Malkinson,
⊥Pierre Mahou,
⊥Élodie Chaudan, Thierry Gacoin, Ali Y. Sonay, Periklis Pantazis,
Emmanuel Beaurepaire,
*
and Willy Supatto
*
Cite This:ACS Photonics 2020, 7, 1036−1049 Read Online
ACCESS
Metrics & More Article Recommendations*
sı Supporting InformationABSTRACT: Two-photon light-sheet microscopy (2P-SPIM) provides a unique combination of advantages for fast and deep fluorescence imaging in live tissues. Detecting coherent signals such as second-harmonic generation (SHG) in 2P-SPIM in addition tofluorescence would open further imaging opportunities. However, light-sheet microscopy involves an orthogonal configuration of illumination and detection that questions the ability to detect coherent signals. Indeed, coherent scattering from micron-sized structures occurs predominantly along the illumination beam. By contrast, point-like sources such as SHG nanocrystals can efficiently scatter light in multiple directions and be detected using the orthogonal geometry of a light-sheet microscope. This study investigates the suitability of SHG light-sheet microscopy (SHG-SPIM) for fast imaging of SHG nanoprobes. Parameters that govern the detection efficiency of KTiOPO4and BaTiO3nanocrystals using SHG-SPIM are investigated theoretically and experimentally. The effects of incident polarization, detection numerical aperture, nanocrystal rotational motion, and second-order susceptibility tensor symmetries on the detectability of SHG nanoprobes in this specific geometry are clarified. Guidelines for optimizing SHG-SPIM imaging are established, enabling fast in vivo light-sheet imaging combining SHG and two-photon excitedfluorescence. Finally, microangiography was achieved in live zebrafish embryos by SHG imaging at up to 180 frames per second and single-particle tracking of SHG nanoprobes in the bloodflow.
KEYWORDS: nanocrystal, nanoparticle, nonlinear microscopy, second-harmonic generation, single-plane illumination microscopy, zebrafish
L
ight-sheet fluorescence microscopy (or single-plane illumination microscopy, SPIM) holds unique advantages for fast and three-dimensional (3D) in vivo imaging with low photodamage.1−4 The introduction of multiphoton excitation in light-sheet microscopy has been shown to improve its imaging depth in scattering tissues.5,6 It also provided the opportunity to implement multimodal light-sheet imaging and combine two-photon excited fluorescence (2PEF) and other nonlinear contrast mechanisms, such as second-harmonic generation (SHG).5,7 However, detecting coherent signals in the orthogonal geometry of SPIM is not a trivial issue. Indeed, endogenous SHG signals obtained from, for example,fibrillar collagen,8 muscle fibers,9 or microtubules10 have been extensively studied in the context of point-scanningmicros-copy (PSM), which uses a collinear configuration of illumination and detection. In this case, coherent signals from micron-sized structures have been shown to be directional and generated mostly in the forward direction, in the same direction as the excitation beam propagates.8,11−15 This directionality results from the coherent buildup of harmonic waves necessary for endogenous SHG signals to be Received: December 11, 2019
Published: February 28, 2020
Article pubs.acs.org/journal/apchd5
Derivative Works (CC-BY-NC-ND) Attribution License, which permits copying and
redistribution of the article, and creation of adaptations, all for non-commercial purposes.
Downloaded via 86.238.153.56 on November 25, 2020 at 10:25:36 (UTC).
detectable and from the large phase mismatch in all directions except for the propagation axis. Although this mechanism is expected to hamper largely orthogonal detection of such signals, the situation is quite different in the case of point sources such as SHG nanoprobes.16−18 Indeed, if a coherent source has dimensions smaller than the wavelength (Rayleigh regime assumption), efficient scattering may occur in multiple directions,19−22although depending on the coupling between the incident laser polarization and the crystal properties.23
SHG nanoprobes have emerged as a promising tool for biological imaging applications.16−18 Several inorganic nano-crystals of noble metals or metal oxides with a non-centrosymmetric crystal structure have been used as nano-meter SHG sources in nonlinear microscopy (or PSM).16,24,25 Unlikefluorophores, SHG nanoprobes are achromatic and can be excited at any wavelength.25−28 In addition, the SHG radiation spectrum is narrow when using femtosecond laser sources, which facilitates their selective detection. Since SHG is based on nonlinear scattering of light, no light absorption process is involved. Therefore, SHG nanoprobes usually have a high damage threshold,29,30 and the number of photons they radiate is not limited by saturation or photobleaching.31,32 Finally, nanostructures can efficiently scatter SHG in multiple directions. For example, signals from SHG nanoprobes using PSM geometry have been detected in the backward direction.32
Despite these unique optical properties, the use of SHG nanocrystals as probes in a light-sheet microscope, i.e., with orthogonal illumination and detection, has never been investigated. In this study, we theoretically and experimentally establish the use of KTiOPO4 (KTP)33,34 and BaTiO3 (BT)32,35,36 nanocrystals as SHG nanoprobes for SHG-SPIM. We analyze SHG signal collection efficiency as a function of microscope geometry (collinear in PSM vs orthogonal in SPIM), polarization direction, crystal structure, particle rotational motion, and detection numerical aperture. Specifically, we address the following questions: can signals from SHG nanoprobes be efficiently detected in the orthogonal geometry? Are the illumination intensities and signal levels in SHG-SPIM suitable for in vivo imaging? How do SHG signals from nanocrystals compare to endogenous structures with respect to orthogonal detection? What is the effect of the illumination polarization, and how should it be set to maximize signal mean and minimize its spread? What is the effect of nanocrystal rotational motion during imaging? Do the nature of the nanocrystal and of its susceptibility tensor symmetries matter?
■
RESULTSEfficient Detection of SHG Nanoprobes Using the Orthogonal Geometry of Light-Sheet Microscopy. To select which SHG nanocrystals would be a good candidate for SPIM imaging, we considered the specificity of SPIM detection compared to PSM. Crystalline symmetries govern SHG radiation efficiency and directionality as a function of incident polarization.23 In PSM, the illumination polarization is generally linear and oriented in a plane that is orthogonal to the detection. By contrast, it should be realized that the illumination polarization can be oriented along the detection axis in SPIM. If the second-order susceptibility tensorχ(2)of the SHG nanocrystal used has only diagonal elements (d11, d22, d33 as introduced in ref 23 and in the Methods), SHG will propagate orthogonally to the detection axis and will not be
detected. As a consequence, we anticipated that nanocrystals with nondiagonal χ(2) elements, therefore producing SHG propagating along the direction of the illumination polar-ization, would be more adapted to the orthogonal detection geometry of SPIM. In this study, we investigate this effect by comparing SHG-SPIM signals from nanocrystals with or without diagonal elements in theirχ(2). Among the 21 crystal classes that lack inversion symmetry and can produce SHG, none have purely diagonal elements.23However, the diagonal elements can be significantly higher than the other nonzero elements, such as in the case of potassium titanyl phosphate, KTiOPO4 (mm2 class, biaxial orthorhombic crystal; see
Methods).23,37On the other hand, several crystals have low-value diagonal elements, such as barium titanate, BaTiO3 (4mm class, uniaxial tetragonal crystal; seeMethods).23,38To investigate SHG signal detection in the orthogonal geometry of SPIM, we then chose to work with KTP33,34 and BT32,35 nanocrystals, which have been shown to be biocompatible and efficient SHG sources in point-scanning microscopy32,33 and should exhibit different results when imaged with SPIM.
To establish that SHG nanoprobes can be detected with SPIM, KTP and BT nanocrystals with a mean diameter of 150 ± 100 nm33
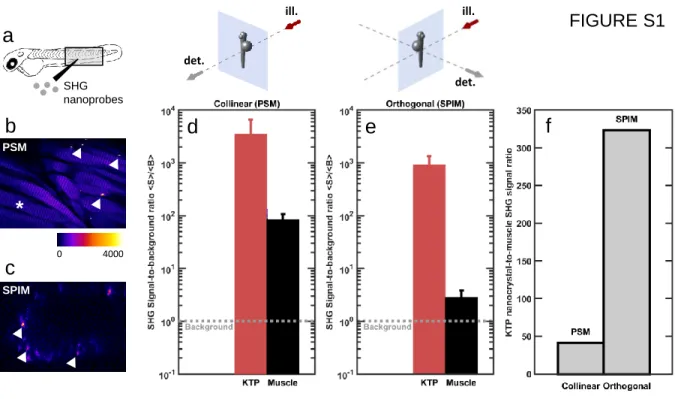
and 90± 30 nm,35respectively, were trapped in an agarose gel and mounted in a home-built multiphoton light-sheet microscope (Figure 1a,b). We recorded images with a linear incident polarization and experimental parameters similar to the ones previously used for biological 2P-SPIM imaging.39 Punctate signals were readily observed from the samples (Figure 1b−d) with good signal-to-noise ratio (Figure 1c,d). To confirm the nature of these signals, we confirmed that they exhibit SHG-specific properties. First, we verified that the intensity of the coherent signal generated by the nanocrystals was proportional to the square of the mean excitation power and did not saturate (Figure 1e,f). In addition, we confirmed that the signal spectrum was narrow and centered at half the excitation wavelength (Figure 1g). Finally, consistent with previous observations in PSM,34 we observed that the signal levels from individual nanocrystals exhibited large variations from one particle to another; this phenomenon can be explained by the sixth-power dependence of SHG with nanocrystal radius40 for subwavelength crystal sizes and by the various relative orientations between incident polarization and crystal axes41−43(Figure 1h, and see below). Since SHG signals generated by both nanocrystals and certain endogenous macromolecular assemblies such asfibrillar collagen, musclefibers, or polarized microtubule bundles have been detected using multiphoton point-scanning microsco-py,7−10,32 we compared the detection of SHG signals from nanocrystals and endogenous sources in the SPIM geometry to that in PSM. For that assay, we injected KTP nanocrystals to the trunk of zebrafish embryos, where skeletal muscles are an efficient source of endogenous SHG signals.32,44 We then measured the ratio of SHG signal levels between KTP and skeletal muscle in PSM and in SPIM (Figure S1). We found this ratio to be more than 1 order of magnitude stronger in SPIM than in PSM. This indicates that the orthogonal detection geometry does not allow efficient detection of endogenous SHG signals, while SHG nanoprobes are more efficiently detected. Together, these experiments show that, unlike in the case of endogenous sources of SHG, the SHG signals from nanocrystals can be efficiently detected in the orthogonal geometry using light-sheet microscopy.
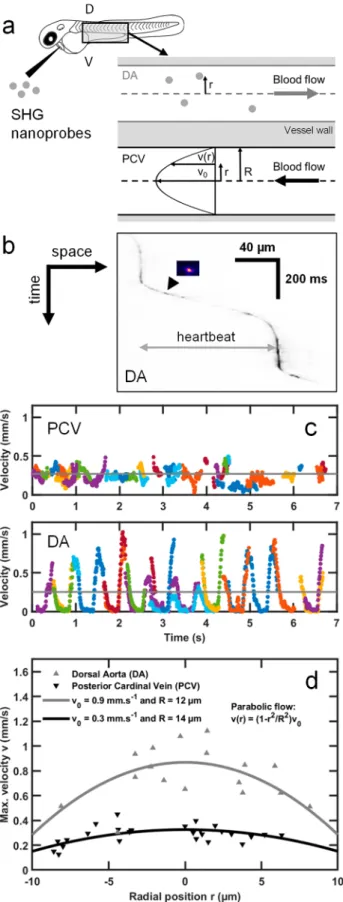
Application to Fast In Vivo Imaging of SHG Nanop-robes: From Microangiography to Multimodal Imaging in the Zebrafish Embryo. To demonstrate fast light-sheet-based SHG nanoprobe detection for biological imaging, we performed microangiography in zebrafish embryos. We seeded the bloodflow within the dorsal aorta (DA) and the posterior
cardinal vein (PCV) with SHG nanoprobes in 2 days postfertilization (dpf) embryos (see Methods). To measure the blood flow that is known to reach locally a ∼1 mm/s velocity45in zebrafish, we imaged individual SHG nanoprobes at 140 to 180 frames per second (fps) (Movie 1)flowing in the DA and the PCV of the embryo (Figure 2a,b and Movie 1). This frame rate corresponds to a 2−5 ms exposure time and up to 43 MHz pixel rate. We confirmed that the instantaneous velocity measured from single nanoprobes exhibited pulsatile profiles due to the heart beating (Figure 2c) in the DA.45By contrast, we detected a relatively steady flow with lower maximum velocities in the PCV (Figure 2c), as previously reported by tracking blood cells.45The relatively small size of SHG nanoprobes compared to the blood vessel diameter enabled us to resolve theflow velocity profile across the vessel section, i.e., along the radial position r (Figure 2a). To accomplish this, we extracted the maximum velocity of individual nanoprobes during a cardiac cycle depending on their radial position within the vessels (Figure 2d). We found that the radialflow profiles follow a parabolic curve, which is expected in the case of pulsatileflow with low Reynolds and Womersley numbers.46Indeed, they are smaller than 1 since the measured heartbeat frequency is <2 Hz, theflow velocity is <1 mm/s (Figure 2c), the vessel diameter is smaller than 30 μm, and the blood kinematic viscosity is ∼5 × 10⁻⁶ m2/s.45 Based on the radialflow profiles measured in the DA and PCV, this fluid mechanics model of laminar flow predicted vessel diameters of 24 and 28 μm, respectively (Figure 2d). These predicted values are consistent with measurements obtained for the same embryonic stage usingfluorescent labeling of the vessels.47Finally, we performed multimodal and multicolor in vivo imaging by combining the detection of green and red two-photon excitedfluorescence with SHG from nanoprobes. A 2.5 dpf zebrafish embryo expressing eGFP in its endothelial cells and dsRed in its red blood cells was injected with KTP nanocrystals and imaged at 47 fps using a single excitation wavelength (930 nm) with a multichannel spectral detection (Figure S2 and Movie 2). Since SHG nanoprobes are achromatic, multimodal imaging should be possible at any excitation wavelength and the most adapted to thefluorophore absorption can be selected. To illustrate this advantage, we used 1060 nm excitation to image the redfluorescent protein mCherry simultaneously with KTP nanoprobes seeding the blood flow in the embryo’s brain at 65 fps (Movie 3). Together, our results demonstrate that fast light-sheet imaging of SHG nanoprobes can be used as a reliable technique to resolve blood flow dynamics at micrometer scales in vivo. Moreover, it can be combined straightforwardly with two-photon excited fluorescence to perform multimodal and multicolor in vivo imaging.
No Toxicity or Photodamage Observed after In-jection of SHG Nanoprobes and during Fast In Vivo Imaging. To test whether the injection of KTP or BT nanocrystals into the zebrafish embryo circulation disrupts normal biological processes, we monitored the embryo development after injection performed at 2 or 3 dpf. Several physiological parameters were examined: developmental stages, overall morphology, swimming, and response to touch. We did not observe any abnormalities in injected embryos up to 5 dpf (N = 30 embryos; not shown). Likewise, KTP nanocrystal injection to fertilized zebrafish eggs did not result in developmental disruptions (N = 10 eggs; not shown), confirming previous reports in the case of BT nanocrystals.32 Figure 1. SHG signals from KTP and BT nanocrystals can be
detected using the orthogonal geometry of a multiphoton light-sheet microscope. (a) Multiphoton light-sheet microscope (SPIM) setup. (b) SHG nanoprobes were mounted in agarose gel and imaged in orthogonal geometry (SPIM) atλ = 930 nm. (c, d) Normalized SHG signal profiles depending on the horizontal distance to KTP (c, red) and BT (d, blue) nanocrystals selected fromFigure 1b images (insets in c and d and white boxes in b). (e, f) Quadratic dependence of normalized averaged SHG signal ⟨S⟩/⟨S⟩max on normalized
illumination power P/Pmaxis observed from both KTP (e, red) and
BT (f, blue). (g) Spectral selectivity of SHG nanoprobes is observed by measuring the mean SHG signal detected using a 448/20 bandpass detectionfilter depending on illumination wavelengths (λ = 860, 890, and 920 nm). (h) Comparison of SHG signal levels obtained from KTP and BT nanocrystals in similar imaging conditions. HWP, half waveplate; SL, scan lens; TL, tube lens; PBS, polarization beam splitter; SH, second harmonic; ill., illumination; det., detection. Scale bar is 50μm.
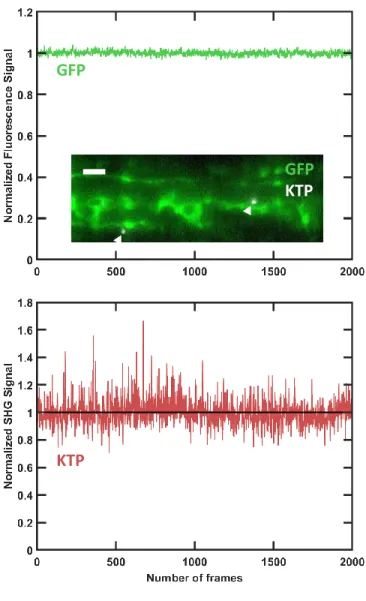
To investigate potential photodamage induced during in vivo imaging, we systematically monitored the heartbeat frequency of the live embryos during SPIM imaging sessions by directly imaging the heart or by extracting its beating frequency from the bloodflow pattern as shown above (Figure 2b). We found that even under the strongest illumination (150 mW and∼0.1 focusing numerical aperture, corresponding to 85 MW/cm2 peak irradiance, which is 2 orders of magnitude below the previously reported nonlinear photodamage threshold48), the heart was beating at frequencies within the normal range for 2−3 dpf embryos45,49(typically∼2 Hz at room temperature, N = 5). In addition, we investigated photobleaching of fluorescent proteins and photostability of SHG nanoprobes during multimodal imaging. We monitored GFP and KTP signals during high-speed in vivo SPIM imaging of blood vessels in fli1-eGFP transgenic embryos50 that were injected with KTP nanocrystals. We simultaneously imaged eGFP and KTP nanocrystals at∼70 fps, 930 nm illumination wavelength, and 150 mW mean power. Both 2PEF and SHG signals remained constant (within <5% variation in the case of 2PEF) after 2000 frames, corresponding to 30 s of constant imaging (Figure S2). Finally, we monitored the development of the embryos used in this study during the days following injection of KTP or BT nanocrystals and imaging with SPIM. We observed the physiological parameters listed above and noted that they stayed within normal ranges up to 5 dpf (N = 10 embryos; not shown). Together, these results confirm that no significant photobleaching of fluorescent protein or photo-damage by SHG nanoprobes was observed during in vivo image acquisition and that embryos injected with SHG nanoprobes and imaged with light-sheet microscopy developed normally.
SHG Signal Is Less Sensitive to Incident Polarization in the Case of BT than in the Case of KTP Nanocrystals. The large fluctuation of SHG signals we observed when imaging individual KTP nanocrystals in vivo made single-particle tracking difficult (Movie 1). To optimize SPIM Figure 2.Microangiography in zebrafish embryos using fast in vivo
SHG imaging and tracking of individual SHG nanoprobes seeding the bloodflow. (a) KTP nanocrystals were injected in the blood vessels of 2 dpf zebrafish embryos and were imaged in both the dorsal aorta (DA) and the posterior cardinal vein (PCV). Single nanoprobes were tracked along the blood vessel and trajectories were constructed for each particle. (b) Kymogram (space−time graph with inverted grayscale signals) of representative tracked SHG nanoprobe (inset
Figure2. continued
image) seeding the dorsal aorta and exhibiting a pulsatile movement. (c) Cumulative plot of KTP nanocrystal speeds during 12 heartbeats. Nineteen and 37 nanocrystals flowing in the DA and the PCV, respectively, were imaged in vivo at 140 fps and tracked. Their instantaneous velocities are drawn as a function of time. Different trajectories (in different colors) were used to construct the plotted profiles. The pulsatile nature of their movement in the DA, owing to the systole/diastole cycles, enables extracting the heartbeat frequency, which is∼2 Hz. The mean velocity is indicated with gray lines (250 ± 80 and 270 ± 20 μm/s, for DA and PCV, respectively). (d) Microangiography and in vivo tracking of individual SHG nanoprobes flowing in blood vessels demonstrates different velocities along the vessel’s diameter. Shown are two plots taken from the DA (gray, up-pointing triangles) and from the PCV (black, down-up-pointing triangle). The trajectories were drawn with respect to the position r of the trajectory along the diameter of the blood vessel (a), where the center was estimated as the average of the two most peripheral trajectories in the respective blood vessel. In general, particles were found to maintain their relative position along the vessel, with respect to their initial positions. The plots show that particles thatflow in the center exhibit an overall higher range of flow velocities (max. velocities correspond to the average of the 5% fastest time points during a track) compared to particles that are close to the vessel walls, as expected from a parabolic flow (gray and black lines, for artery and vein, respectively, represent parabolicfits).
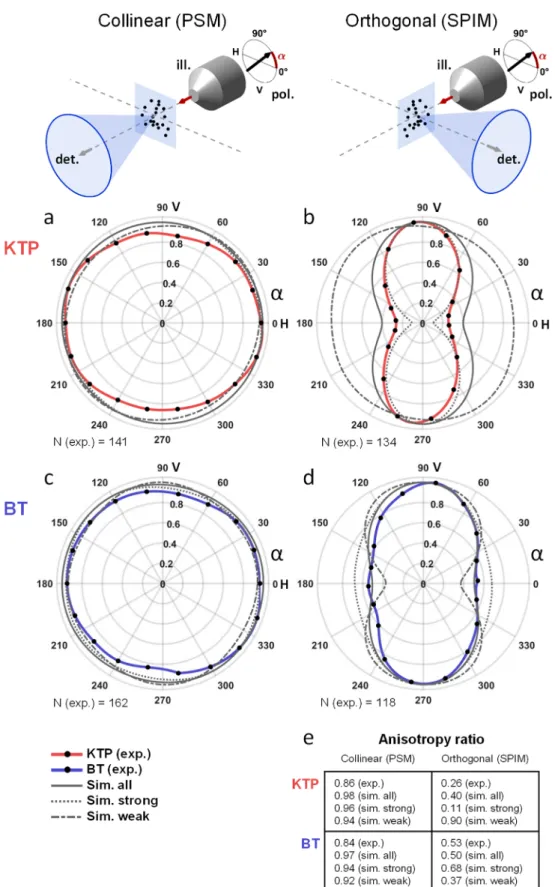
Figure 3.Mean detected SHG signals strongly depend on illumination polarization orientation in light-sheet microscopy. (a−d) Mean SHG signal detected (from N = 118 to 162 nanoprobes) as a function of the illumination linear polarization angle (black dots) for KTP (a and b) or BT (c and d) nanocrystals (spline interpolation in red and blue lines, respectively). Experiments were conducted using either a collinear (PSM, a and c) or an orthogonal (SPIM, b and d) geometry. Results of simulation (1000 SHG nanoprobes with random nanocrystal orientations) are indicated with plain gray lines, and signal means from 20% strongest or weakest nanocrystals are plotted with dotted or dashed gray line, respectively. Angles of 0° and 90° corresponds to horizontal (H) and vertical (V) polarizations that are oriented along and orthogonal to the detection axis in SPIM, respectively. (e) The anisotropy ratio corresponds to the minimum-to-maximum signal from results plotted in (a)−(d). ill., illumination; det., detection; sim., simulation; exp., experiment; V, vertical; H, horizontal, N, number of experimental nanocrystals used.
imaging of SHG nanoprobes for such biological application, we investigated whether these fluctuations could be due to the crystal nature and compared KTP and BT crystals. Since the nonlinear signal from SHG nanoprobes is known to depend on the incident polarization in PSM,43 we first explored the impact of linear polarization on average detected SHG signals depending on the nanocrystal nature and the microscope geometry. We performed numerical calculations of SHG signal detected as a function of incident polarization for 1000 simulated and randomly oriented nanocrystals of both KTP and BT types. The theory in this purpose is detailed in the
Methodssection. We then experimentally validated the results from numerical simulations by imaging KTP and BT nanocrystals trapped in agarose gel.
First, simulations in PSM confirmed that the average signal detected from randomly oriented SHG nanoprobes did not depend on the orientation of the linear polarization (plain gray lines in Figure 3a and c), even if the signal from individual nanocrystals was polarization-dependent. For both KTP and BT nanocrystals, the simulated anisotropy ratio was very close to 1 (Figure 3e). This result was confirmed experimentally by imaging 141 and 162 KTP and BT nanocrystals, respectively (red and blue lines inFigure 3a and c, anisotropy ratio >0.84). We note that the experimental design in PSM dictates that the linear polarization remains always oriented orthogonally to the detection axis, which explains this observation.
By contrast, the situation was much different in the orthogonal detection geometry of SPIM, as shown in Figure 3b and d. The average SHG signal from simulated nanoprobes was consistently strongest when using vertical (V) polarization and weakest when using horizontal (H) polarization, corresponding to a polarization orthogonal or parallel to the SPIM detection axis, respectively (plain gray lines inFigure 3b and d). In agreement with simulations, the average SHG signal from nanocrystals imaged in a gel was drastically reduced when the polarization was oriented along the SPIM detection axis (red and blue lines in Figure 3b and d, respectively). Interestingly, both simulations and experiments show that, in SPIM, SHG signals from BT nanocrystals exhibited a weaker dependence on polarization than in the case of KTP nanocrystals (Figure 3b and d). Indeed, the anisotropy ratio measured experimentally was 2-fold lower in the latter case (0.26 and 0.53, for KTP and BT nanocrystals, respectively). We note that this ratio is larger than the depolarization ratio obtained with hyper-Rayleigh scattering (0.36 for BT nano-crystals in ref 21, for instance) since SPIM imaging uses a significantly larger detection aperture.
Together, these data demonstrate that, unlike in PSM, average signal intensities from SHG nanoprobes in SPIM exhibit a large dependence on the orientation of the linear polarization of the illumination. The average SHG signal is significantly reduced when the polarization is oriented along the SPIM detection axis and is maximized when the polarization is oriented orthogonally to the detection axis. In addition, this polarization sensitivity depends on the nature of the nanocrystal. Indeed, signals from KTP nanocrystals exhibited a stronger sensitivity to the incident polarization than BT signals. More precisely, the KTP nanocrystals with the strongest detected signals exhibited the strongest sensitivity to incident polarization (seeSupporting Results 1). By contrast, the BT nanocrystals with the strongest detected signals were weakly sensitive to incident polarization. As we anticipated when choosing to compare KTP and BT nanocrystals, this
phenomenon can be explained by the structure of their χ(2) tensors. Since these results have important practical con-sequences for imaging applications, we further investigated how to optimize the detection of SHG nanoprobes in the SPIM geometry.
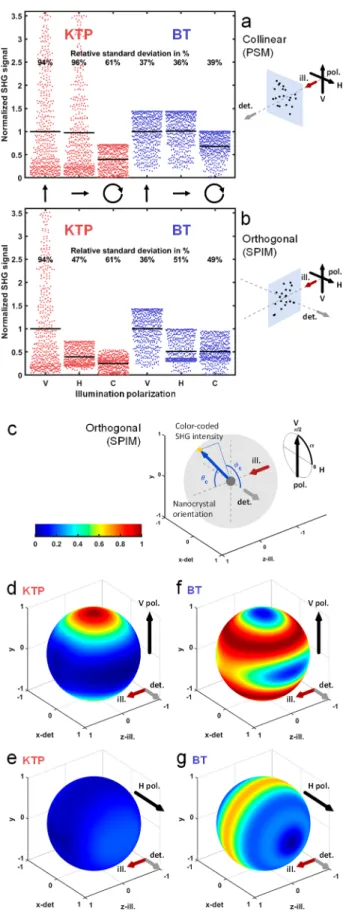
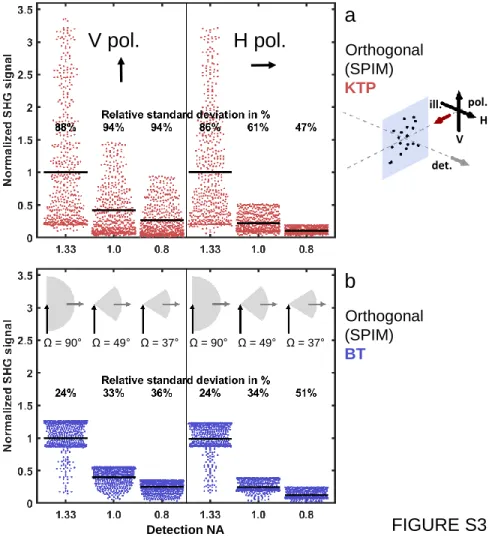
Polarization Orientation Modulates Both Distribu-tion Mean and Spread of SHG-SPIM Signals. To gain insights into the polarization sensitivity and the effect of nanocrystal orientation, we analyzed the distribution of simulated SHG signal levels from randomly oriented nano-crystals depending on the crystal nature and the microscope geometry (Figure 4a,b). To compare our results with previous observations on BT nanocrystals in PSM,43we used the same metric and estimated the relative standard deviation of the detected SHG signals (i.e., the standard deviation divided by the mean) to quantify the spread around the mean.
As expected, we observed no difference in the signal distribution between V- and H-polarizations in the case of PSM (Figure 4a, in red for KTP and in blue for BT, vertical and horizontal arrows). By contrast, the difference was pronounced in the case of SPIM orthogonal geometry (Figure 4b, in red for KTP and in blue for BT, vertical and horizontal arrows). Indeed, when the linear polarization was orthogonal to the detection axis, the SHG signal distribution was similar both in PSM and in SPIM (V-polarization in Figure 4a,b). However, in the case of a linear polarization parallel to the detection axis in SPIM, the resulting SHG signal distribution was significantly different in mean and spread (H-polarization inFigure 4a,b): the signal mean was 40% and 51% that of V-polarization for KTP and BT, respectively. Interestingly, this difference depends on the nanocrystal nature. While for both nanocrystals the signal mean decreased when using an H-compared to a V-polarization, the relative standard deviation decreased in the case of KTP (from 94% to 47%,Figure 4b) and increased in the case of BT (from 36% to 51%,Figure 4b). This implies that the use of a V-polarization in SPIM optimizes the signal mean level. However, its consequences on signal spread depend on the nanocrystal nature: while it significantly increased the signal spread in the case of KTP nanocrystals, it reduced this spread in the case of BT nanocrystals. These simulations explained the large fluctuation of SHG signals observed when tracking KTP nanoprobes experiencing rota-tional motion when seeding the blood flow (Figure 2 and
Movie 1). They also indicated that the mean and spread of SHG recorded from nanoprobes of different orientations depend on the detection NA in different manners for KTP and BT nanocrystals (Figure S3andSupporting Results 2).
Circularly Polarized Light Is Not Advantageous for SPIM Imaging of SHG Nanoprobes. In PSM for biological SHG imaging, circularly polarized light was shown to mitigate the spread of SHG signal intensities and equally excite all harmonophore orientations8,51even at the cost of reducing the average signal. In the case of BT nanocrystals imaged with PSM, it has been shown that the benefit of circular polarization is lost, since it reduces the average signal without reducing the relative standard deviation.43We reproduced this last result on BT nanocrystals with our simulations (Figure 4a in blue). We found however that circular polarization can still be a benefit for imaging KTP nanocrystals in PSM since it significantly reduces the relative standard deviation of the signals (from 94% to 61%,Figure 4a in red). By contrast, we did notfind any benefit of using a circularly polarized light in SPIM. Indeed, a stronger average signal with a lower signal spread could still be
obtained either when KTP nanocrystals were imaged with an H-polarization (Figure 4b in red) or when BT was imaged with a V-polarization (Figure 4b in blue). Altogether, these data show that the strategy of using a circularly polarized illumination is inefficient in SPIM imaging of SHG nanoprobes and that a linear polarization should be used instead.
The Nature of the Nanocrystals Plays a Critical Role in SPIM Imaging of SHG Nanoprobes. To confirm that the relative values of the nanocrystal χ(2) tensor elements are critical for efficient SHG-SPIM imaging, we simulated the detected signal intensity for all possible crystal orientations and investigated the effect of crystal nature and incident polar-ization (Figure 4c−g and Figure S4). Simulated data are represented on a unit sphere, where the position on the sphere corresponded to the 3D crystal orientation and the color corresponded to the signal intensity detected as shown in
Figure 4c. Figure 4d−g show the signal intensity detected in the orthogonal direction with a 0.8 numerical aperture objective in the KTP and BT cases, with V- or H-polarization. The detected signal was then decomposed into the total generated SHG (Figure S4a−d) and the SHG collection efficiency (Figure S4e−h). Simulations show that KTP nanocrystals behave as simple dipoles, resulting in a straightforward scattering pattern. As a result, a large signal can be obtained only when the KTP main axis is aligned with the incident polarization (Figure 4d). This behavior is described by the low value of nondiagonal elements in the KTP χ(2) tensor (see Methods) and is characterized by an absence of propagation along the direction of the incident polarization. It also revealed why for a uniform distribution of nanocrystal orientations the distribution of signal levels was shifted toward weak signals as observed inFigure 4b (red, V-polarization). When the illumination polarization was rotated toward the detection axis, the total SHG pattern rotated accordingly (Figure S4a,b). However, SHG was mainly generated in directions orthogonal to the detection axis and was poorly collected (Figure S4f). As a result, the detected signal was weak for all nanocrystal orientations (Figure 4e), explaining the observed signal distribution (Figure 4b, red, H-polarization). By contrast, BT was capable of polarization conversion during the SHG process, which was characterized by the presence of nondiagonal elements in itsχ(2) tensor38 (seeMethods). As a consequence, more scattering directions were allowed than in the case of KTP, and only a limited number of crystal orientations resulted in a weak detected Figure 4.Detected SHG signal distribution depending on nanocrystal
orientation and illumination polarization: theoretical investigation. (a, b) Simulation of SHG signal distributions from 500 KTP (red) and BT (blue) nanocrystals using linear vertical (V), linear horizontal (H), or circular (C) polarization of the illumination light in the collinear (a, PSM) or orthogonal (b, SPIM) geometry, using a 0.8 detection numerical aperture (NA). Random distribution of nano-crystal orientation results in spreading of signal levels around the
Figure4. continued
mean (black horizontal lines). Signal for each polarization is normalized to the vertical polarization case. Signal mean and relative standard deviation are indicated for 10 000 nanocrystals simulated with random orientations. (c−g) Signal intensity distribution for all possible nanocrystal orientations for KTP (d, e) and BT (f, g) nanocrystals using vertical (d and f) or horizontal (e and g) linear polarization in SPIM with a 0.8 detection NA. Results are represented on a unit sphere, where the position on the sphere corresponds to the nanocrystal orientation relative to the microscope reference frame as shown in (c), and color corresponds to the signal intensity detected. Red, gray, and black arrows correspond to the SPIM illumination axis, detection axis, and linear polarization orientation, respectively. Represented signal is a spline interpolation of signals from 4000 nanocrystals simulated with random orientations. The signal level is normalized to the maximum value in each case. ill., illumination; det., detection; V, vertical; H, horizontal.
signal (Figure 4f). Such behavior explains the observed signal distribution that is shifted toward large signals (Figure 4b, blue, V-polarization). Altogether, these results revealed how the structure of the crystal χ(2) tensor is responsible for the differences shown inFigures 3,4, andS4between KTP and BT nanocrystals. More generally, they demonstrate that the nature of the nanocrystals has a critical impact on the detected SHG signal distribution in light-sheet microscopy.
BT Is More Adapted than KTP for In Vivo Particle Tracking Using SHG-SPIM: An Experimental Validation. The strong dependence of detected SHG signal intensity on nanocrystal relative orientation has an important consequence for applications such as particle tracking using SHG-SPIM. Indeed, a tracked SHG nanoprobe will seemingly“blink” as it undergoes rotational motion during its movement (Figure 2b,
Movie 1). According to the above analyses, this effect should
be more pronounced in the case of KTP than in the case of BT Figure 5.Optimizing SHG signals detected from individual SHG nanoprobes experiencing rotational motion: experimental investigation. Analysis of SHG nanoprobe signal recorded in vivo shows that BT and KTP nanocrystals generate different patterns of dynamic ranges as they flow. (a, b) A solution containing SHG nanoprobes was injected to a zebrafish embryo and imaged at 140 fps and 5 ms exposure time using SPIM with vertical linear polarization of the excitation beam. Single nanoprobes were tracked off-line. Shown in (a) is a maximal projection of selected time points where the different locations of a single BT nanocrystal in the blood vessel of a zebrafish embryo can be seen (scale bar 20 μm). (c, d) Histograms depicting the signal levels of KTP (c) and BT (d) nanocrystals that were tracked in data sets such as the one presented in (a). For each of the particles that were tracked off-line, a trajectory of the particle’s path was constructed, and the intensities in the different positions were then normalized to the maximal value along that trajectory. The histograms depict the pooled data from all trajectories per particle type. Note that the BT histogram is more skewed to the right-hand side with respect to the KTP histogram, suggesting that while a BT nanocrystal isflowing and rotating, its range of generated SHG intensities is closer to the maximal intensity, compared to KTP. (e, f) Simulated histograms (Sim. 1) corresponding to the previous experimental cases (c, d) confirming the difference between KTP and BT nanocrystals: the histogram is skewed to low intensities in the case of KTP (e) and to high intensities in the case of BT (f). (g, h) By adding the random positioning of the nanocrystals through the z-thickness of the light-sheet to the simulation (Sim. 2), the resulting histograms are similar to experimental ones. sim., simulation; exp., experiment.
nanocrystals. To validate this prediction with in vivo experi-ments, we imaged SHG nanoprobes injected in the blood circulation of a zebrafish embryo with SPIM at typically 90 to 180 fps and 1 to 5 ms exposure time using a V-polarization (Figure 5a,b and Movies 1 and 4, for KTP and BT cases, respectively). We then tracked SHG nanoprobes and computed the histograms of normalized signal levels recorded along nanoprobe trajectories (Figure 5c,d and seeMethodsfor details) and compared them with simulations from randomly oriented nanocrystals (Figure 5e,f). As expected from our simulations (Figure 4b), the histograms from simulated KTP and BT nanocrystals exhibited opposite shapes with a shift toward weak signals in the case of KTP (35% of nanoprobes generating a signal below 10% of the maximum,Figure 5e) and toward large signals in the case of BT (0.1% of nanoprobes generating a signal below 10% of the maximum, Figure 5f). While this difference was also significant in experiments, it was not as pronounced as in ourfirst simulation (45% and 11% of generated signals below 10% of the maximum for KTP and BT, respectively, inFigure 5c,d). To better match the simulations with the experimental data, we took into account the movements of nanoprobes in and out of the light-sheet along each trajectory (Figure 5g,h and Methods). Altogether, these results demonstrate fast rotational motion of SHG nanoprobes circulating in a biologicalflow in vivo can result in large fluctuations of signal levels, which can hamper particle tracking. To mitigate this effect, the nature of the SHG nanocrystal is critical and BT is more adapted than KTP for this purpose.
■
DISCUSSIONDetection of Extended and Point Sources of SHG in SPIM. In this study, we report on the inefficient detection of endogenous SHG using the orthogonal geometry of SPIM compared to PSM. Indeed, we show that SHG signals from skeletal muscle in the zebrafish trunk are barely above the background level when using SPIM under standard imaging conditions. Essentially, detectable SHG signals arise from endogenous spatially extended sources, which results in a strong directionality of the SHG radiation in the collinear direction and a poor detection in the orthogonal geometry of SPIM. For this reason, the size of the crystal used for SHG-SPIM is critical: to behave as a point source and to radiate SHG signals in all directions of space, the crystals have to be significantly smaller than the illumination wavelength.
Guide through Parameters Governing SHG Signal Detection in SPIM Using Nanocrystals. Here, we analyzed the parameters governing signal detection level and distribu-tion when using SHG nanoprobes in SPIM, namely, the polarization of the incident light, the nature and orientation of the nanocrystals, and the detection aperture. We highlighted the difference between SPIM and PSM detection geometries. For instance, the ability to image SHG nanoprobes with a linear polarization that is parallel to the detection is specific to SPIM and has important consequences. Our analysis provides guidelines to optimize these parameters for SPIM imaging of SHG nanoprobes. For instance, we focused on a specific application: tracking SHG nanoprobes seeding the bloodflow in live zebrafish embryos (Figure 2). In this case, to achieve efficient detection and tracking of particles trapped in the flow that are experiencing rotational motion, it is better to mitigate the spread of SHG signals and maximize the signal mean level. For that purpose, our study demonstrates that BT nanocrystals
are more adapted than KTP and that a V-polarization of the illumination and a high-NA detection should be preferred (Figure 5). We anticipate that these recommendations are not adapted for all imaging applications. Indeed, the disadvantage of KTP regarding the particle tracking application could be considered as an advantage for other applications such as those based on the orientation tracking of the particles and the design of rheology andflow shear sensors, such as reported with other types of nanoprobes.52 In this case, using a lower detection aperture will be beneficial (Figure S3) to maximize the signal sensitivity to nanoprobe orientation, and using a KTP nanocrystal with a V-polarization or BT with a H-polarization will further maximize it (Figure 4b). Interestingly, the unique sensitivity to nanocrystal nature and rotational motion resulting from the orthogonal geometry of SHG-SPIM compared to standard imaging techniques could benefit such new applications in rheology and biologicalfluid dynamics.
Crystalline Nature of the Nanoprobe Used in SHG-SPIM. We showed that in addition to nanoprobes size their crystalline nature is also a critical parameter for SPIM imaging. In the literature, harmonic nanocrystals are usually selected based on the mean value of the χ(2) tensor coefficients.25 Indeed, the higher this value is, the larger the SHG signal becomes. We show here that the structure of this tensor also has stronger consequences in the case of orthogonal detection of SPIM than in the case of PSM (Figure 3 andFigure 4a,b). Indeed, KTP and BT nanocrystals, which have respectively high and low values of diagonal χ(2) elements, exhibited different sensitivity to the illumination polarization (Figure 3) and rotational motion (Figure 4and Figure S4). In addition, signal spread from KTP and BT exhibited opposite shapes and responses to light polarization or detection NA (Figure 4b and
Figure S3). More generally, the presence of nondiagonal elements in the χ(2) tensor of the nanocrystal used results in more SHG detected in the orthogonal direction and less sensitivity to nanoprobe rotational motion and illumination polarization. Since the distribution of SHG signals strongly depends on tensor structure and differs from one nanocrystal type to the other, it should drive the choice of the SHG nanoprobe for a specific application.
■
CONCLUSIONOur study establishes that SHG can be efficiently used as a contrast modality for in vivo multiphoton light-sheet imaging and provides guidelines for its optimization. (i) First, unlike in point-scanning microscopy, SHG should originate from a subwavelength structure to be efficiently detected in a direction orthogonal to the illumination. In practice, we showed SHG from exogenous nanoprobes is much stronger in this geometry than endogenous SHG from biological structures. (ii) The orthogonal detection in SPIM results in more pronounced incident polarization sensitivity than in the standard collinear geometry. To enhance the average detected signal in SHG-SPIM, an illumination beam with linear polarization orthogonal to the detection axis should be preferred to a linear polarization parallel to the detection axis or even circularly polarized illumination. (iii) Moreover, the detection numerical aperture has an important effect on both the mean and the spread of detected SHG signals. In particular, it should be maximized to limit signal spread andfluctuations when tracking single nanoprobes. (iv) In addition, the crystalline nature of the nanocrystal used as SHG nanoprobe is important, especially for in vivo tracking applications in
which nanoprobe rotational motion is involved. In this case, we provide evidence that crystalline materials exhibiting non-diagonal elements in their χ(2) tensor, such as BT, are advantageous over simpler materials such as KTP. (v) Finally, we showed that SPIM imaging of SHG nanoprobes is compatible with live imaging without inducing toxicity or photodamage: by imaging live zebrafish embryos at rates up to 180 fps, it is possible to perform microangiography and resolve the blood flow profile at micrometer scales in embryonic vessels. Together, these results show that while the orthogonal geometry of light-sheet microscopy allows for fast in vivo imaging of SHG nanoprobes, it also results in a distinctive sensitivity to nanocrystal nature and particle rotational motion compared to standard imaging techniques. More generally, this work opens the way to multimodal multiphoton light-sheet microscopy combining the simultaneous detection of multi-photon excitedfluorescence and coherent signals on separate channels of the same optical setup.
■
METHODSMultiphoton Optical Setups. The multiphoton light-sheet (SPIM) optical setup is described in Figure 1a. Pulse trains at 80 MHz repetition rate, at 830−960 nm wavelengths and with 150−180 fs pulse durations are obtained from a Ti:sapphire laser (Chameleon Ultra II, Coherent). Beam power is adjusted using half-wave plates and polarization beam splitters. Beam size and divergence are controlled with separate telescopes. The illumination arm consists of a low NA water immersion objective (10×, 0.30 NA, Nikon), a scan lens, and a tube lens. The illumination light sheet is produced using a galvanometer mirror (Y-Scanner, GSI Lumonics) scanning the beams in the y-direction at 500 Hz. The effective NA of illumination used to generate a ∼ 3 μm thick light-sheet is ∼0.1, as previously described.39
SHG and fluorescence from the illuminated plane are collected by a high NA water immersion objective (16×, 0.80 NA, Nikon). A KG3 filter is placed immediately after the detection objective, and three spectral channels are spatially split on an electron-multiplying charged coupled device camera (EMCCD, iXon3 885, Andor) with a spectral image splitter (OptoSplit III, Cairn Research) equipped with two dichroic mirrors (FF484-FDi01 and FF560-FDi01, Semrock). The objectives are mounted on translational stages for alignment. Sample is maintained in a chamberfilled with a water solution and positioned from the top of the chamber with a combination of a motorized stage (MP285, Sutter Instrument) for translation in x, y, and z directions and a rotation stage for rotation about the y-axis. Z-stack acquisition is obtained by moving the sample in the z direction across the light sheet. All peripheral devices, including motorized half-wave plates, motorized delay line, shutter, galvanometer mirror, EMCCD camera, and motorized sample stage, are controlled using custom-written LabVIEW (National Instru-ments) software. Image acquisitions were performed with 0.67 μm per pixel, at 930 or 1060 nm illumination wavelength, and a mean power of 10 to 150 mW at the sample. For in vivo imaging, EMCCD camera acquisition was set to 2 to 10 ms exposure time, corresponding to 180 to 47 fps. The home-built multiphoton point-scanning microscope used to compare with SPIM was previously described in ref53.
Zebrafish Lines and Embryo Preparation. The following zebrafish lines were used: wild-type TL and Tg(gata-1:dsRed),54provided by AMAGEN service facility at CNRS Gif-sur-Yvette (UMS 3504 CNRS/UMS 1374 INRA)
and Tg( f li-1:eGFP)50 crossed with Tg(gata-1:dsRed), kindly provided by the laboratories of Dr. Sophie Vriz (Collège de France, Paris) and Dr. Philippe Herbomel (Institut Pasteur, Paris). Embryos were raised at 28°C in the dark and treated with 1-phenyl-2-thiourea (Sigma-Aldrich) at 10 hpf to inhibit pigment formation. For injection or imaging, embryos were anesthetized with 0.01% (100 mg/L) Tricaine (Sigma-Aldrich) solution and embedded in 1% (10 g/L) low melting point agarose (Sigma-Aldrich) as previously described.5 All experi-ments were performed with zebrafish embryos before independent feeding larval forms and complied with the European directive 2010/63/UE.
Preparation of KTP and BT Nanocrystals. KTP nanocrystals are negatively charged and form very stable colloidal suspensions in water, which enables their long-term storage and facilitates the sample mounting procedure. They were prepared following the protocol described in ref 33. Briefly, two solutions of Ti(OBu)4in HCl and KH2PO4are mixed and aged for 4 h under ambient temperature. The solution is then neutralized up to pH 6.5 with K2CO3, and the precipitate is washed with water by centrifugation. After drying, a white powder is recovered and calcined at 700°C for 2 h. The obtained powder is then washed with water by centrifugation andfinally dispersed in pure water, leading to a colloidal suspension of KTP particles. Characterizations show that particles have an average size of about 150 nm and an excellent colloidal stability in water as expected from a measured zeta potential of −40 mV for pH between 6 and 8. BT nanocrystals were prepared as previously described35 and coated with polyethylene glycol to provide steric stabilization in water solution.35
Mounting and Analysis of SHG Nanoprobes in Agarose Gel. SHG nanocrystals were diluted ×100 from their native solutions and sonicated using a probe sonicator using 40% power for up to 30 s. Immediately after the sonication, sonicated particles were mixed 1:1 with 2% LMP agarose. A 20μL glass pipet was filled with the mixture, placed inside a custom-built holder,39and mounted on the setup via a mechanical arm coupled to a motorized stage. Image analysis was performed using Imaris (Bitplane Inc.) and custom-made scripts written in Matlab (The MathWorks Inc.).
Injection and Tracking of SHG Nanoprobes in Live Zebrafish Embryos. Microangiography55was used to deliver particles diluted as above to the zebrafish embryo circulation. To secure a consistent and harmless application of nanoprobes into the zebrafish embryo, we limited the administration of them to a single time point, since repetitive injections have been shown to be harmful to zebrafish vascular development.56 Dispensation was restricted to nanoliter volumes to prevent clogging of the small (i.e., micron-sized) injection needle that was suitable for the dimension of the zebrafish duct of Cuvier, the point of administration. Embryos were allowed 10 min to recover in normal embryo medium before being mounted for imaging as above. Imaging was performed in a chamberfilled with embryo medium with tricaine diluted to 0.01% (100 mg/ L) at ambient temperature. After the imaging, the embryo was recovered and raised in normal embryo medium at 28°C to follow its development. Image sequences were analyzed using Imaris (Bitplane Inc.) and custom-made Matlab (The MathWorks Inc.) scripts to perform particle tracking and analyses of SHG signals and particle velocity.
Numerical Simulations of SHG Signals Generated by Nanocrystals and Detected Using SPIM and PSM. The
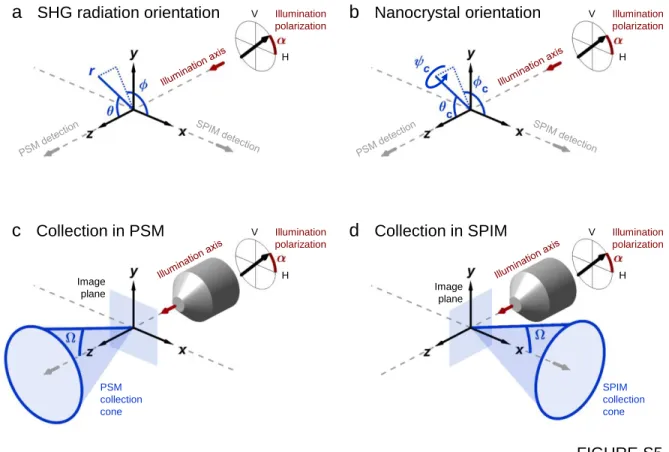
numerical simulations of SHG signals generated by nanocryst-als are based on the same theoretical framework as previously described to simulate PSM imaging of BT nanocrystals.43 It was extended to the case of KTP nanocrystals and to the orthogonal signal detection of SPIM. It relies on the following assumptions: the nanocrystals are spherical and of small size compared to the illumination wavelength; the amplitude and the phase of the electric field are uniform inside the nanocrystals and the spread inside them can be neglected. Hence, the field EL in the laboratory frame probed by a nanocrystal near the focus (r,θ, Φ) ≈ (0, 0, 0) as defined in
Figure S5a is approximated as a plane wave. For a linearly polarized illumination beam, thefield is given by
E E cos sin 0 L 0 i k jjjjj jjj y { zzzzz zzz α α ∝
and for a circularly polarized illumination beam, the field is given by E i E 1 2 2 0 L 0 i k jjjjj jjjjj jjjjj jjjj y { zzzzz zzzzz zzzzz zzzz ∝
whereα is the angle of the incoming polarization compared to the x-axis (Figure S5a) and E0the amplitude of thefield. For a nanocrystal whose orientation is rotated compared to the laboratory frame by the angles (ϕC, θC, ψC) as defined in
Figure S5b, thefield in the crystal frame ECis related to the field in the laboratory frame EL
by the Euler matrices M (ϕC), M(θC), and M(ψC): E E E M M M E E E ( ) ( ) ( ) X Y Z X Y Z C C C C C C L L L Ä Ç ÅÅÅÅÅ ÅÅÅÅÅ ÅÅÅÅÅ ÅÅÅÅ É Ö ÑÑÑÑÑ ÑÑÑÑÑ ÑÑÑÑÑ ÑÑÑÑ Ä Ç ÅÅÅÅÅ ÅÅÅÅÅ ÅÅÅÅÅ ÅÅÅÅ É Ö ÑÑÑÑÑ ÑÑÑÑÑ ÑÑÑÑÑ ÑÑÑÑ ψ θ ϕ = where M( ) cos sin 0 sin cos 0 0 0 1 C C C C C Ä Ç ÅÅÅÅÅ ÅÅÅÅÅ ÅÅÅÅÅ ÅÅ É Ö ÑÑÑÑÑ ÑÑÑÑÑ ÑÑÑÑÑ ÑÑ φ ϕ ϕ ϕ ϕ = − M( ) cos 0 sin 0 1 0 sin 0 cos C C C C C Ä Ç ÅÅÅÅÅ ÅÅÅÅÅ ÅÅÅÅÅ Å É Ö ÑÑÑÑÑ ÑÑÑÑÑ ÑÑÑÑÑ Ñ θ θ θ θ θ = − M( ) cos sin 0 sin cos 0 0 0 1 C C C C C Ä Ç ÅÅÅÅÅ ÅÅÅÅÅ ÅÅÅÅÅ Å É Ö ÑÑÑÑÑ ÑÑÑÑÑ ÑÑÑÑÑ Ñ ψ ψ ψ ψ ψ = −
As introduced in ref23, the second-order susceptibility tensor χ(2)can be represented in the crystal frame as a 3× 6 matrix:
d d d d d d d d d d d d d d d d d d d d d d d d d d d d d d d d d d d d 2 2
XXX XYY XZZ XYZ XXZ XXY
YXX YYY YZZ YYZ YXZ YXY
ZXX ZYY ZZZ ZYZ ZXZ ZXY
(2) 11 12 13 14 15 16 21 22 23 24 25 26 31 32 33 34 35 36 Ä Ç ÅÅÅÅÅ ÅÅÅÅÅ ÅÅÅÅÅ ÅÅ É Ö ÑÑÑÑÑ ÑÑÑÑÑ ÑÑÑÑÑ ÑÑ Ä Ç ÅÅÅÅÅ ÅÅÅÅÅ ÅÅÅÅÅ ÅÅ É Ö ÑÑÑÑÑ ÑÑÑÑÑ ÑÑÑÑÑ ÑÑ χ = =
For KTP nanocrystals (mm2 class), the second-order polar-ization in the crystal frame generated by the focusedfield is23,37
P r r r r r r r r r d d d d d E E E E E E E E E 2 0 0 0 0 0 0 0 0 0 0 0 0 0 ( , ) ( , ) ( , ) 2 ( , ) ( , ) 2 ( , ) ( , ) 2 ( , ) ( , ) k k k k k k k k k X Y Z Y Z X Z X Y 2 C 31 32 31 32 33 2 2 2 Ä Ç ÅÅÅÅÅ ÅÅÅÅÅ ÅÅÅÅÅ ÅÅ É Ö ÑÑÑÑÑ ÑÑÑÑÑ ÑÑÑÑÑ ÑÑ Ä Ç ÅÅÅÅÅ ÅÅÅÅÅ ÅÅÅÅÅ ÅÅÅÅÅ ÅÅÅÅÅ ÅÅÅÅÅ ÅÅÅÅÅ ÅÅÅÅ É Ö ÑÑÑÑÑ ÑÑÑÑÑ ÑÑÑÑÑ ÑÑÑÑÑ ÑÑÑÑÑ ÑÑÑÑÑ ÑÑÑÑÑ ÑÑÑÑ ω ω ω ω ω ω ω ω ω = ω
Whereω is the angular frequency of the electric field, rk the position within the excitation volume and d31= 2.1 pm/V, d33 = 15.4 pm/V and d33= 15.4 pm/V. In this case, the diagonal element d33is significantly larger than the others. In practice |E| = E0in the crystal volume and 0 everywhere else.
For BT nanocrystals, the second order polarization in the crystal frame generated by the focusedfield is38
P r r r r r r r r r d d d d d E E E E E E E E E 2 0 0 0 0 0 0 0 0 0 0 0 0 0 ( , ) ( , ) ( , ) 2 ( , ) ( , ) 2 ( , ) ( , ) 2 ( , ) ( , ) k k k k k k k k k X Y Z Y Z X Z X Y 2 C 15 15 31 31 33 2 2 2 Ä Ç ÅÅÅÅÅ ÅÅÅÅÅ ÅÅÅÅÅ ÅÅ É Ö ÑÑÑÑÑ ÑÑÑÑÑ ÑÑÑÑÑ ÑÑ Ä Ç ÅÅÅÅÅ ÅÅÅÅÅ ÅÅÅÅÅ ÅÅÅÅÅ ÅÅÅÅÅ ÅÅÅÅÅ ÅÅÅÅÅ ÅÅÅÅ É Ö ÑÑÑÑÑ ÑÑÑÑÑ ÑÑÑÑÑ ÑÑÑÑÑ ÑÑÑÑÑ ÑÑÑÑÑ ÑÑÑÑÑ ÑÑÑÑ ω ω ω ω ω ω ω ω ω = ω where d33= 6.7 pm/V, d31= 18 pm/V, and d15= 17.2 pm/V. In this case, the diagonal element d33is significantly lower than the others.
The second-order polarization in the laboratory frame is then calculated by using the inverse of the Euler rotation matrices: r r r r r r P P P M M M P P P ( ) ( ) ( ) ( ( ) ( ) ( )) ( ) ( ) ( ) k k k k k k X Y Z T X Y Z L L L C C C C C C Ä Ç ÅÅÅÅÅ ÅÅÅÅÅ ÅÅÅÅÅ ÅÅÅÅ É Ö ÑÑÑÑÑ ÑÑÑÑÑ ÑÑÑÑÑ ÑÑÑÑ Ä Ç ÅÅÅÅÅ ÅÅÅÅÅ ÅÅÅÅÅ ÅÅÅÅ É Ö ÑÑÑÑÑ ÑÑÑÑÑ ÑÑÑÑÑ ÑÑÑÑ ψ θ ϕ =
The harmonicfield originating from all the positions rkin the nanocrystal and propagating to a positionr = (r, θ, ϕ) is given by37,57 E r G r r r r r c V P P P ( ) (2 ) d ( , ) ( ) ( ) ( ) k k k k k X Y Z SHG 0 2 2 L L L Ä Ç ÅÅÅÅÅ ÅÅÅÅÅ ÅÅÅÅÅ ÅÅÅÅ É Ö ÑÑÑÑÑ ÑÑÑÑÑ ÑÑÑÑÑ ÑÑÑÑ
∭
ω = −where Vk is nanocrystal volume and G0 the far-field Green’s function:57 G r r ik r r r r ik r ( , ) exp( ) 4 exp
1 cos sin sin cos sin cos sin cos sin cos sin 1 sin sin sin sin cos cos sin cos sin sin cos sin
k k 0 2 2 2 2 2 2 2 2 2 i k jjj y{zzz Ä Ç ÅÅÅÅÅ ÅÅÅÅÅ ÅÅÅÅÅ ÅÅÅÅ É Ö ÑÑÑÑÑ ÑÑÑÑÑ ÑÑÑÑÑ ÑÑÑÑ π ϕ θ ϕ ϕ θ ϕ θ θ ϕ ϕ θ ϕ θ ϕ θ θ ϕ θ θ ϕ θ θ θ = − · × − − − − − − − − ω ω
Finally, the SHG power PSHG radiated by a nanocrystal and collected over the cone angleΩ (Figure S5c,d) in PSM is given by E r PSHG ( ) sin( ) d d 0 2 0 SHG 2
∫ ∫
θ θ ϕ = | | π Ωand in SPIM, it is given by
E r PSHG ( ) sin( ) d d 0 0 2 SHG 2
∫ ∫
θ θ ϕ = | | π ΩFor all numerical simulations, we used an excitation wavelengthλ = 930 nm, a particle diameter of one voxel set to 36.9 nm, and random crystal orientation angles ϕc andθc (uniformly distributed on a sphere). The detection numerical aperture was 0.8, 1.0, or 1.33, corresponding to angle
asin 37 , 49 , or 90
n NA Water
Ω = = ° ° °, respectively. The excitation polarization was linear or circular, and for each simulation, we computed the total collected SHG power for each excitation polarization for N randomly orientated nanocrystals.
Experimental Estimation of SHG Signal Levels Using Single-Particle Tracking. To compare the histograms of signal levels between experiments and simulations (Figure 5), we took into account the variability of nanocrystal sizes in the experiments. To remove the effect of nanocrystal size variability, we tracked individual nanoprobes. We selected only the nanoprobes that were detected at least 30 times during theirflow inside the blood vessel. Then, we normalized the signal to the maximal intensity found along each individual trajectory. The signals (between 0 and 1) from different nanoprobes were then used to plot the histograms ofFigure 5c,d (2693 and 767 values for KTP and BT nanocrystals, respectively). Such a histogram should be comparable to simulated histograms assuming along a track each nanoprobe reaches an orientation corresponding to a maximum of detected signal. To generate simulated histograms (Figure 5e,f), we estimated the distribution of signal detected from 10 000 nanocrystals with random (uniformly distributed) orientations in the SPIM geometry with a 0.8 detection NA. The signals were normalized to the maximum. To take into account the effect of the Gaussian light-sheet profile in the axial direction (Figure 5g,h), we multiplied the signal with a Gaussian before normalization. We adjusted the range of explored axial positions to obtain the best match between the experimental and the simulated histograms in the case of BT nanocrystals (Figure 5d and f, respectively). Its value corresponds to nanocrystals exploring ±7 μm around the center of a light-sheet of 4μm full width half-maximum, which is consistent with both the observed lateral movements of the nanocrystals along a track and the blood vessel diameters.
■
ASSOCIATED CONTENT*
sı Supporting InformationThe Supporting Information is available free of charge at
https://pubs.acs.org/doi/10.1021/acsphotonics.9b01749. Supporting movie 1 (AVI)
Supporting movie 2 (AVI) Supporting movie 3 (AVI) Supporting movie 4 (AVI)
Supportingfigures and supporting results (PDF)
■
AUTHOR INFORMATION Corresponding AuthorsEmmanuel Beaurepaire − Laboratory for Optics and Biosciences, Ecole Polytechnique, CNRS, INSERM, Université Paris-Saclay, 91128 Palaiseau Cedex, France; orcid.org/ 0000-0002-2082-8214; Email:emmanuel.beaurepaire@ polytechnique.edu
Willy Supatto − Laboratory for Optics and Biosciences, Ecole Polytechnique, CNRS, INSERM, Université Paris-Saclay, 91128 Palaiseau Cedex, France; orcid.org/0000-0002-4562-9166; Email:willy.supatto@polytechnique.edu
Authors
Guy Malkinson − Laboratory for Optics and Biosciences, Ecole Polytechnique, CNRS, INSERM, Université Paris-Saclay, 91128 Palaiseau Cedex, France; orcid.org/0000-0001-7339-3659
Pierre Mahou − Laboratory for Optics and Biosciences, Ecole Polytechnique, CNRS, INSERM, Université Paris-Saclay, 91128 Palaiseau Cedex, France; orcid.org/0000-0003-4452-1011
Élodie Chaudan − Laboratory of Condensed Matter Physics, Ecole Polytechnique, CNRS, Université Paris-Saclay, 91128 Palaiseau Cedex, France
Thierry Gacoin − Laboratory of Condensed Matter Physics, Ecole Polytechnique, CNRS, Université Paris-Saclay, 91128 Palaiseau Cedex, France; orcid.org/0000-0001-6774-3181
Ali Y. Sonay − Department of Biosystems Science and Engineering (D-BSSE), Eidgenössische Technische Hochschule (ETH) Zurich, 4058 Basel, Switzerland; orcid.org/0000-0002-2194-9958
Periklis Pantazis − Department of Biosystems Science and Engineering (D-BSSE), Eidgenössische Technische Hochschule (ETH) Zurich, 4058 Basel, Switzerland; Department of Bioengineering, Imperial College London, London SW7 2AZ, U.K.; orcid.org/0000-0002-8367-9332
Complete contact information is available at:
https://pubs.acs.org/10.1021/acsphotonics.9b01749
Author Contributions
Author Contributions
G.M., P.M., E.B., and W.S. conceived the project. G.M. and P.M. performed the experiments and simulations. E.C. and T.G. produced the KTP nanocrystal suspension. A.Y.S. and P.P. produced the BT nanocrystal suspension. G.M., P.M., and W.S. analyzed and processed the data. W.S. designed the figures. All authors contributed to the manuscript text and have given approval to thefinal version of the manuscript.
Notes
The authors declare no competingfinancial interest.
■
ACKNOWLEDGMENTSThis work was supported by Agence Nationale de la Recherche (ANR-11-EQPX-0029 Morphoscope2, ANR-2010-JCJC-1510-01, ANR-10-INBS-04 France BioImaging), by the European Union Seventh Framework Programme (Marie Curie Interna-tional Reintegration grant no. 268379), by Ecole Polytechni-que, and by Région Ile-de-France. Work in the lab of P.P. was supported by a Royal Society Wolfson Research Merit Award. We thank Lamiae Abdeladim, Marie-Claire Schanne-Klein, Joséphine Morizet, Chiara Stingari, and other LOB members for scientific discussions. We thank Emilie Menant for assistance with zebrafish husbandary. We thank the AMAGEN facility at CNRS Gif-sur-Yvette (UMS 3504 CNRS/UMS 1374 INRA), Dr. Sophie Vriz (Collège de France, Paris), and Dr. Philippe Herbomel (Institut Pasteur, Paris) for providing zebrafish embryos.
■
REFERENCES(1) Huisken, J.; Swoger, J.; Del Bene, F.; Wittbrodt, J.; Stelzer, E. H. Optical sectioning deep inside live embryos by selective plane illumination microscopy. Science 2004, 305 (5686), 1007−9.
(2) Keller, P. J.; Schmidt, A. D.; Wittbrodt, J.; Stelzer, E. H. Reconstruction of zebrafish early embryonic development by scanned light sheet microscopy. Science 2008, 322 (5904), 1065−9.
(3) Mertz, J. Optical sectioning microscopy with planar or structured illumination. Nat. Methods 2011, 8, 811.
(4) Pantazis, P.; Supatto, W. Advances in whole-embryo imaging: a quantitative transition is underway. Nat. Rev. Mol. Cell Biol. 2014, 15 (5), 327−39.
(5) Truong, T. V.; Supatto, W.; Koos, D. S.; Choi, J. M.; Fraser, S. E. Deep and fast live imaging with two-photon scanned light-sheet microscopy. Nat. Methods 2011, 8 (9), 757−760.
(6) Supatto, W.; Truong, T. V.; Débarre, D.; Beaurepaire, E. Advances in multiphoton microscopy for imaging embryos. Curr. Opin. Genet. Dev. 2011, 21 (5), 538−48.
(7) Pavone, F. S.; Campagnola, P. J. Second Harmonic Generation Imaging; CRC Press, 2016; p 476.
(8) Chen, X.; Nadiarynkh, O.; Plotnikov, S.; Campagnola, P. J. Second harmonic generation microscopy for quantitative analysis of collagen fibrillar structure. Nat. Protoc. 2012, 7, 654.
(9) Boulesteix, T.; Beaurepaire, E.; Sauviat, M. P.; Schanne-Klein, M. C. Second-harmonic microscopy of unstained living cardiac myocytes: measurements of sarcomere length with 20-nm accuracy. Opt. Lett. 2004, 29 (17), 2031−2033.
(10) Dombeck, D. A.; Kasischke, K. A.; Vishwasrao, H. D.; Ingelsson, M.; Hyman, B. T.; Webb, W. W. Uniform polarity microtubule assemblies imaged in native brain tissue by second-harmonic generation microscopy. Proc. Natl. Acad. Sci. U. S. A. 2003, 100 (12), 7081−7086.
(11) Moreaux, L.; Sandre, O.; Charpak, S.; Blanchard-Desce, M.; Mertz, J. Coherent scattering in multi-harmonic light microscopy. Biophys. J. 2001, 80 (3), 1568−1574.
(12) Zipfel, W. R.; Williams, R. M.; Webb, W. W. Nonlinear magic: multiphoton microscopy in the biosciences. Nat. Biotechnol. 2003, 21, 1369.
(13) Rouede, D.; Bellanger, J. J.; Schaub, E.; Recher, G.; Tiaho, F. Theoretical and Experimental SHG Angular Intensity Patterns from Healthy and Proteolysed Muscles. Biophys. J. 2013, 104 (9), 1959− 1968.
(14) Gusachenko, I.; Schanne-Klein, M. C. Numerical simulation of polarization-resolved second-harmonic microscopy in birefringent media. Phys. Rev. A: At., Mol., Opt. Phys. 2013, 88 (5), 15.
(15) Houle, M. A.; Couture, C. A.; Bancelin, S.; Van der Kolk, J.; Auger, E.; Brown, C.; Popov, K.; Ramunno, L.; Legare, F. Analysis of forward and backward Second Harmonic Generation images to probe the nanoscale structure of collagen within bone and cartilage. J. Biophotonics 2015, 8 (11−12), 993−1001.
(16) Dempsey, W. P.; Fraser, S. E.; Pantazis, P. SHG nanoprobes: Advancing harmonic imaging in biology. BioEssays 2012, 34 (5), 351−360.
(17) Staedler, D.; Magouroux, T.; Hadji, R.; Joulaud, C. c.; Extermann, J. r. m.; Schwung, S.; Passemard, S. n.; Kasparian, C.; Clarke, G.; Gerrmann, M.; Dantec, R. L.; Mugnier, Y.; Rytz, D.; Ciepielewski, D.; Galez, C.; Gerber-Lemaire, S.; Juillerat-Jeanneret, L.; Bonacina, L.; Wolf, J.-P. Harmonic Nanocrystals for Biolabeling: A Survey of Optical Properties and Biocompatibility. ACS Nano 2012, 6 (3), 2542−2549.
(18) Magouroux, T.; Extermann, J.; Hoffmann, P.; Mugnier, Y.; Le Dantec, R.; Jaconi, M. E.; Kasparian, C.; Ciepielewski, D.; Bonacina, L.; Wolf, J.-P. High-Speed Tracking of Murine Cardiac Stem Cells by Harmonic Nanodoublers. Small 2012, 8 (17), 2752−2756.
(19) Debarre, D.; Olivier, N.; Beaurepaire, E. Signal epidetection in third-harmonic generation microscopy of turbid media. Opt. Express 2007, 15 (14), 8913−24.
(20) Cheng, J. X.; Jia, Y. K.; Zheng, G.; Xie, X. S. Laser-scanning coherent anti-Stokes Raman scattering microscopy and applications to cell biology. Biophys. J. 2002, 83 (1), 502−9.
(21) Le Dantec, R.; Mugnier, Y.; Djanta, G.; Bonacina, L.; Extermann, J.; Badie, L.; Joulaud, C.; Gerrmann, M.; Rytz, D.; Wolf, J. P.; Galez, C. Ensemble and Individual Characterization of the Nonlinear Optical Properties of ZnO and BaTiO3 Nanocrystals. J. Phys. Chem. C 2011, 115 (31), 15140−15146.
(22) Joulaud, C.; Mugnier, Y.; Djanta, G.; Dubled, M.; Marty, J.-C.; Galez, C.; Wolf, J.-P.; Bonacina, L.; Le Dantec, R. Characterization of the nonlinear optical properties of nanocrystals by Hyper Rayleigh Scattering. J. Nanobiotechnol. 2013, 11 (1), S8.
(23) Boyd, R. W. Chapter 1 - The Nonlinear Optical Susceptibility. In Nonlinear Optics, second ed.; Academic Press: San Diego, 2003; pp 1−65, DOI: 10.1016/B978-012121682-5/50002-X.
(24) Brasselet, S.; Zyss, J. Nano-Crystals for Quadratic Nonlinear Imaging: Characterization and Applications. In Nanotechnology and Nanomaterials“Nanocrystals”; Masuda, Y., Ed.; Sciyo, 2010.
(25) Rogov, A.; Mugnier, Y.; Bonacina, L. Harmonic nanoparticles: noncentrosymmetric metal oxides for nonlinear optics. J. Opt. 2015, 17 (3), 033001.
(26) Nakayama, Y.; Pauzauskie, P. J.; Radenovic, A.; Onorato, R. M.; Saykally, R. J.; Liphardt, J.; Yang, P. Tunable nanowire nonlinear optical probe. Nature 2007, 447 (7148), 1098−1101.
(27) Extermann, J.; Bonacina, L.; Cuøa, E.; Kasparian, C.; Mugnier, Y.; Feurer, T.; Wolf, J.-P. Nanodoublers as deep imaging markers for multi-photon microscopy. Opt. Express 2009, 17 (17), 15342−15349. (28) Pu, Y.; Hsieh, C.-L.; Grange, R.; Yang, X.; Papadopoulos, I.; Choi, J.-W.; Psaltis, D. Second harmonic nanoparticles in imaging applications. Proc. SPIE 2011, 8095, 80950E−80950E-9.
(29) Ahmed, F. Laser damage threshold of KTiOPO4. Appl. Opt. 1989, 28, 119−122.
(30) Hildenbrand, a.; Wagner, F. R.; Akhouayri, H.; Natoli, J.-Y.; Commandré, M.; Théodore, F.; Albrecht, H. Laser-induced damage investigation at 1064 nm in KTiOPO4 crystals and its analogy with RbTiOPO4. Appl. Opt. 2009, 48, 4263−4269.
(31) Le Xuan, L.; Zhou, C.; Slablab, A.; Chauvat, D.; Tard, C.; Perruchas, S.; Gacoin, T.; Villeval, P.; Roch, J.-F. Photostable Second-Harmonic Generation from a Single KTiOPO4 Nanocrystal for Nonlinear Microscopy. Small 2008, 4 (9), 1332−1336.