HAL Id: hal-03004535
https://hal.archives-ouvertes.fr/hal-03004535
Submitted on 13 Nov 2020
HAL is a multi-disciplinary open access archive for the deposit and dissemination of sci-entific research documents, whether they are pub-lished or not. The documents may come from teaching and research institutions in France or abroad, or from public or private research centers.
L’archive ouverte pluridisciplinaire HAL, est destinée au dépôt et à la diffusion de documents scientifiques de niveau recherche, publiés ou non, émanant des établissements d’enseignement et de recherche français ou étrangers, des laboratoires publics ou privés.
The Use of Digital for Public Service Provision in
Sub-Saharan Africa
Joël Cariolle, David Carroll
To cite this version:
Joël Cariolle, David Carroll. The Use of Digital for Public Service Provision in Sub-Saharan Africa. [Research Report] FERDI. 2020. �hal-03004535�
fondation pour les études et recherches sur le développement international
LA FERDI EST UNE FOND
ATION REC ONNUE D ’UTILITÉ PUBLIQUE . ELLE ME T EN ŒUVRE A VEC L ’IDDRI L ’INITIA TIVE POUR LE DÉ VEL OPPEMENT E
T LA GOUVERNANCE MONDIALE (IDGM).
ELLE C
OORDONNE LE LABEX IDGM+ QUI L
’ASSOCIE A
U CERDI E
T À L
’IDDRI.
The Use of Digital for Public
Service Provision in
Sub-Saharan Africa
Chair “Digital Trust”
Digital for Development Research Initiative
Joël CARIOLLE, Research Officer, foundation for international
development study and research (Ferdi), Clermont-Ferrand, France.
Email: joel.cariolle@ferdi.fr.
With the research assistance of:
David A. CARROLL, PhD student, Friedman School of Nutrition
Science and Policy, Tuft University, Boston, USA.
Email: David.Carroll@tufts.edu
Chair “Digital Trust”
Digital for Development Research Initiative
The Use of Digital for Public Service Provision in
Sub-Saharan Africa
Friday, September 11, 2020.
Joël Cariolle, Research Officer, foundation for international development study and research (Ferdi), Clermont-Ferrand, France. Email: joel.cariolle@ferdi.fr.
With the research assistance of:
David A. Carroll, PhD student, Friedman School of Nutrition Science and Policy, Tuft University, Boston, USA. Email: David.Carroll@tufts.edu
Table of contents
Executive summary ... 5
1.
Introduction ... 8
2.
Digitization and public services provision in Sub-Saharan African economies: general
background ... 9
2.1. Digital technologies, cost reduction and market failures in public service provision ... 9
2.1.1. Digital technologies and information search costs reduction. ... 9
2.1.2. Digital technologies and replication cost ... 10
2.1.3. Digital technologies and distance-related costs ... 10
2.1.4. Digital technologies and tracking, targeting, and verification costs ... 11
2.2. Where does the digitization of Sub-Saharan and West Africa stand? ... 11
2.2.1. The Internet divide in SSA ... 12
2.2.2. A multi-dimensional digital divide ... 15
2.3. ICT diffusion in selected West African countries ... 20
2.3.1. Access to ICTs in a Sahelian landlocked country: insights from Niger ... 20
2.3.2. Access to ICTs in an industrializing West African coastal country: insights from Ghana ... 22
2.4. Main lessons ... 24
3.
Digital initiatives and public services delivery in Sub-Saharan Africa: what do
evidence-based studies tell us? ... 24
3.1. Information technologies and agricultural sector development ... 25
3.1.1. Mobile phone access and grain market efficiency in Niger ... 27
3.1.2. ICT-based information provision and farmer behavior in Ghana ... 30
3.1.3. Main lessons ... 32
3.2. Information technologies and educational outcomes ... 36
3.2.1. School e-learning programs: mixed evidence from developing countries, few African initiatives. 36 3.2.2. School e-monitoring programs: evidence from Uganda ... 37
3.2.3. ICTs and adult learning: evidence from Niger and Burkina Faso ... 39
3.2.4. Main lessons ... 41
3.3. Information technologies and health outcomes ... 46
3.3.1. MHealth for vulnerable groups in West Africa... 46
3.3.2. MHealth for frontline health worker decision support ... 48
3.3.3. Main lessons ... 49
3.4. Mobile money and poverty reduction ... 52
3.4.1. The M-Pesa revolution and the unbanked in Kenya ... 53
3.4.2. From mobile money to mobile banking ... 54
3.4.3. MM and social protection programs ... 59
3.4.4. Mobile money and cash transfers on education ... 60
3.4.5. Mobile money and salary payment ... 62
3.4.6. Main lessons ... 63
4.
Discussion: lessons learned and implication for design of future interventions ... 66
REFERENCES ... 68
List of Tables
TABLE 1.THE INTERNET DIVIDE IN NIGER 21
TABLE 2.THE MOBILE DIVIDE IN NIGER 21
TABLE 3.THE SPATIAL INCOME GAP IN NIGER 22 TABLE 4.THE SPATIAL INCOME GAP IN GHANA 22 TABLE 5.THE INTERNET DIVIDE IN GHANA 23
TABLE 6.THE MOBILE DIVIDE IN GHANA 23
TABLE 7.INFORMATION AND COMMUNICATIONS TECHNOLOGIES AND AGRICULTURAL MARKET FUNCTIONING 28
List of Figures
FIGURE 1.YOUTH POPULATION (6 TO 11 YEARS-OLD) PROJECTION,AFRICA VS REST OF THE WORLD 12 FIGURE 2.INTERNATIONAL CONNECTIVITY AND INTERNET PENETRATION IN SSA. 12 FIGURE 3.MOBILE PHONE PENETRATION IN WEST AFRICA AND SSA 13 FIGURE 4.INTERNET PENETRATION RATES AND BANDWIDTH PER USER IN 2016 ACROSS DEVELOPING REGIONS. 13 FIGURE 5.SPEED AND AFFORDABILITY OF BROADBAND INTERNET,SSA VERSUS OTHER DEVELOPING REGIONS. 14 FIGURE 6.FREQUENCY OF INTERNET AND MOBILE PHONE USAGE IN SSA. 15 FIGURE 7.FREQUENCY OF INTERNET AND MOBILE PHONE USAGE IN WEST AFRICA. 15 FIGURE 8.THE SPATIAL DIGITAL DIVIDE, URBAN VERSUS RURAL POPULATIONS. 16 FIGURE 9.THE SPATIAL DIGITAL DIVIDE AND GEOGRAPHICAL ISOLATION. 17 FIGURE 10.THE SPATIAL DIGITAL DIVIDE AND ENERGY DEPRIVATION. 17 FIGURE 11.EDUCATION LEVEL AND THE INTERNET DIVIDE 18 FIGURE 12.EDUCATION LEVEL AND THE MOBILE DIVIDE 18 FIGURE 13.CASH INCOME AND THE INTERNET DIVIDE 19 FIGURE 14.CASH INCOME AND THE MOBILE DIVIDE 19 FIGURE 15.DIGITAL DIVIDE AND THE GENDER GAP 20 FIGURE 16.DIGITAL INNOVATION MULTIPLICATION IN WEST AFRICA. 25 FIGURE 17.INFORMATION NEEDS ALONG THE AGRICULTURAL PRODUCTION CYCLE 26 FIGURE 18.EAGRI DEPLOYMENT IN SSA, BY INFORMATION AND TECHNOLOGY TYPE. 26 FIGURE 19.NUMBER OF MOBILE MONEY SYSTEMS IN SSA AND THE REST OF THE WORLD. 52 FIGURE 20.NUMBER OF MOBILE MONEY SYSTEMS IN SUB-SAHARAN,WEST, AND EAST AFRICA. 52 FIGURE 21.MM SYSTEM DEPLOYMENT IN SSA, BY SERVICE PROVIDED. 53
List of maps
MAP 1.INTERNET PENETRATION RATES IN SUB-SAHARAN AFRICA,2015. 14 MAP 2.BACKBONE INFRASTRUCTURE DEPLOYMENT AND POPULATION DENSITIES IN WEST AFRICA, IN 2015. 16 MAP 3.MOBILE AND INTERNET INFRASTRUCTURE ROLLOUT IN NIGER,2019. 22 MAP 4.MOBILE AND INTERNET INFRASTRUCTURE ROLLOUT IN GHANA,2019. 24
List of Boxes
BOX 1.DIGITAL FOR AGRICULTURAL EXTENSION PROTOTYPE IN SIERRA LEONE. 34 BOX 2.EXPLORING THE ADOPTION OF DRONES IN AGRICULTURE IN BENIN. 35 BOX 3. IMLANGO, DIGITAL EDUCATION SERVICES FOR RURAL AND SEMI-URBAN KENYAN SCHOOLS 43 BOX 4.BBCJANALA –A CROSS-MEDIA ENGLISH LANGUAGE LEARNING PROGRAM IN BANGLADESH 44 BOX 5.IFADEM–AFRANCOPHONE INITIATIVE FOR OPEN-DISTANCE TEACHER TRAINING 45 BOX 6.COMMCARE FOR MHEALTH APPLICATIONS IN SSA AND BEYOND 51 BOX 7.MOBILE MONEY ROLLOUT AND THE AGRICULTURAL SECTOR: INSIGHTS FROM CÔTE D’IVOIRE 57 BOX 8.THE NIGERIAN AND KENYAN MOBILE MONEY EXPERIENCES: A COMPARATIVE ANALYSIS 58 BOX 9.IMPLEMENTATION STEPS FOR THE PRÊT-À-PAYER SCHOOL FEE DIGITAL PAYMENT PLATFORM IN BENIN 64
Executive summary
The objective of this report is to provide an in-depth review of the digitization of public service provision in Sub-Saharan Africa in general and West Africa in particular by highlighting both the opportunities and the challenges faced by digital initiatives multiplication in the region. The first section is an introduction with contextual information related to the need for digital solutions where market failures have created gaps in public services. The second section provides a general background explaining the mechanisms by which digital initiatives can improve public service delivery and paints a picture of the current state of digitization in the region. This first step is necessary to understand where SSA is starting from in terms of digitization, and what conditions are necessary for digital technologies to be able to spur the region to catch up in access to public services. In the third section, once the global picture of the information and communication technology (ICT)-public service nexus in Africa is given, the report goes into the details of selected digital initiatives by proposing a review of evidence-based analyses of African digital interventions that aims to unravel the reasons for their success or failure. The fourth section synthetizes the findings of the report and draws some policy implications.
Goldfarb and Tucker (2019) define digital technologies as “the representation of information in bits […] rather than atoms”, which “reduces the cost of storage, computation and transmission of data”. This definition depicts digital technologies as a type of ICTs with a strong cost-reduction potential. This capacity to reduce various types of cost – information, travel, tracking, and replications costs – makes digital technologies “enabling technologies” (Bresnahan & Trajtenberg, 1995), offering solutions when the provision of public services is undermined by market failures (Aker, 2017). Digital technologies have the potential to leapfrog infrastructures, processes, administrations, institutions that have been put in place and gradually evolved in industrialized countries to reduce market failures, but which are missing or failing in low-income countries. This potential, however, greatly depends on ICT adoption and diffusion throughout the population.
In SSA, populations excluded from public service provision are usually the same populations that are deprived from access to ICTs; consequently, ICT-based public service provision interventions which fail to account for the various dimensions of the digital divide may miss their intended target populations. In other words, such interventions, in order to maximize their development impact, should be designed to target rural populations located far from available broadband infrastructure networks, often characterized by limited literacy and numeracy rates and low average household income, and to address gender inequality. Moreover, despite the rapid uptake of mobile phones and the multiplication of digital innovations across the region, Internet provider network coverage is still limited compared to other developing areas. An environment more conducive to the adoption internet-related technologies could certainly improve the digital dividends for public service delivery, employment, economic diversification, and private sector development in economies of SSA (Ndulu, 2006; Schumann & Kende, 2013). However, interventions promoting digital public service provision through simple mobile phone use should benefit from a better adoption throughout the population, especially in rural areas.
The uptake of mobile phone technology has facilitated the multiplication of digital innovations throughout the region. In West Africa, this uptake of ICTs has enabled the implementation of more than 400 operational digital initiatives in 2019 (Briter Bridges, 2019) across a wide range of sectors and countries. Fintech, Ed-Tech, Health-tech, Agro-Tech, E-commerce and Job platforms represent the sectors most affected by the expansion of digital initiatives. However, only four countries – Nigeria, Ghana, Senegal and Côte d’Ivoire, in decreasing order – contain more than 75% of these initiatives. Therefore, the digital innovation process is unequally distributed throughout the region, mostly benefitting the four biggest economies of SSA.
Studies conducted in rural areas of Niger and Ghana confirm that the adoption of communication technologies like mobile phones can increase agricultural market efficiency through multiple mechanisms. For example, it can improve farmers’ production and selling decisions, the coordination of input and output supply chains, and farmer bargaining power with traders as well as foster the adoption of efficient or innovative production technologies (Aker, 2011; Aker et al, 2016). However, as pointed out by Aker et al (2016), to be effective, ICT-based applications for the agricultural sector have to take into consideration various contextual factors. Such factors include the type of informational asymmetry incurred (price risk reduction, increased geographic extent of price information searches, information on agricultural techniques, etc.), the existence of market failures in related markets (e.g. insurance or credit markets), the type of crops cultivated and sold in markets, or the sociodemographic characteristics of farmers.
Moreover, ICTs will empower farmers vis-à-vis other market agents inasmuch they can provide them with trustworthy information. In a decentralized private information setting, the reliability of market information depends on the size of the farmer’s information network, i.e. the number of information connections from which famers can extract information. In a centralized public information setting, including those promoted by agricultural extension programs such as a centralized Market Information System, the reliability of information seems to depend on ICT penetration but also on the degree of adherence to the extension program. Ultimately, mobile phone adoption by farmers can serve as a platform for electronic money storage and transfers (mobile money), thereby providing access to insurance and savings mechanisms, which is a critical step towards financial inclusion of unbanked farmers.
The implementation of digital technologies in the education sector, when intervention designs consider them as monitoring technologies, are found to enhance teacher performance and school administration efficiency. They have also demonstrated their effectiveness in e-learning adult education programs, more particularly when digital technologies are used as out-of-school learning-by-doing engines, whose basic communication functions (writing messages, making phone calls, making money transfers) can improve learners’ numeracy and literacy skills. However, they stress the limited or mixed impact of e-learning initiatives for children, based on more sophisticated technologies such as computers or tablets, due to their low uptake in the population and the poor familiarization of intended beneficiaries with them. Some reasons for this include that these technologies are more expensive, more vulnerable to climatic conditions, and more prone to theft. The resulting low uptake in the population therefore represents a critical constraint for the scaling up of such initiatives, where they have not proven their relative effectiveness compared to traditional in-class teaching.
In the health sector, African mobile health (mHealth) projects under study benefitted from a high level of take-up and adherence among patients, health workers and staff. The authors identified the following recurring positive outcomes of these projects: better patient access to basic health services such as medical appointments, reduced delays in communication between patients and health staff, improved data collection and reporting, reduced patient travel costs, better health worker compliance to treatment guidelines, and improved patient sensitization and medication outcomes. Among other things, the authors point out that questions of health staff training in use of mobile technology, monitoring and evaluation of technologies, and setting adequate incentives are central for the success of mHealth project management. They also stress the importance of integrating such projects into the healthcare system, into the local context (for instance, by making the mHealth application available in local languages), and of promoting partnerships with public or private entities such as NGOs, universities, research institutes, and hospitals.
Lastly, various studies on the impact of using mobile money for private-to-private transfers and government-to-private transfers stress that such digital technology can be a very effective means of
improving household financial inclusion and resilience to shocks, and ultimately of moving people out of poverty. These benefits are more pronounced for women and female-headed households, which suggests that financial inclusion through mobile money might be particularly effective at fostering women’s socioeconomic empowerment. One last lesson that can be drawn from these studies is that the size and coverage of the MM agent network, especially in rural areas where travel costs are highest, is a critical determinant of MM adoption, diffusion, and impacts.
1.
Introduction
Public services1 play an important role in a country’s productivity, growth and development. Yet there
is widespread variation in the quantity and quality of public services provided, in part due to information asymmetries, high transaction costs, and weak institutions.
In light of these challenges, one promising trend over the past two decades has been the growth in the coverage and adoption of digital technologies, in particular information and communication technologies2 (ICTs), especially in remote rural areas (Aker and Mbiti, 2010; Aker 2011; Aker 2017).
ICTs, more particularly broadband Internet and mobile technologies have the potential to become general-purpose technologies (Bresnahan & Trajtenberg, 1995) called upon to play an increasing role in the development process in Sub-Saharan Africa (SSA), including West Africa. By contributing to the emergence and dissemination of innovations in various sectors such as education, health, utilities, agricultural extension, financial services, and other sectors, the bourgeoning digitization of economies in SSA has raised the prospects of growth, employment and poverty reduction in the region (Aker & Mbiti, 2010; Andrianaivo & Kpodar, 2011; World Bank, 2016; Aker, 2017; Hjort & Poulsen, 2019). In particular, the spread of mobile phone technology offers new opportunities for rural households to realize a variety of broader development goals. In the area of public service provision, digital technology has the potential to increase individuals’ and firms’ access to public and private information, improve coordination amongst buyers and sellers, facilitate data collection to better allocate public goods, and improve access to financial services, especially via mobile money (Aker, 2017).
However, throughout Sub-Saharan Africa as a whole and in West Africa in particular, the expected dividends of digital technologies have been slow to materialize and have fallen short of benefitting the whole population (World Bank, 2016). These low digital dividends are explained by a large multidimensional digital divide, induced by the poor spatial coverage of telecommunications and energy infrastructures, especially in rural areas, by low literacy and numeracy rates in many communities, and by the unaffordability of Internet-related services for the majority of the population. Yet, despite these obstacles to ICT penetration, numerous digital public service initiatives – including mobile money – have built on the large adoption of the mobile phone and have spread over the region. In 2017, amongst the approximately 400 digital initiatives deployed worldwide, more than half were located in SSA (GSMA, 2019a; Briter Bridges, 2019). While these initiatives span a variety of countries, sectors and digital technologies, the majority of these initiatives in developing and emerging countries have been in the agriculture, education, and health sectors and in social protection (Aker, 2011, 2017; Aker & Blumenstock, 2014).
A small but growing number of economic assessments conducted on these initiatives suggest that their impacts are mixed. In particular, research suggests that such initiatives have primarily been successful in improving the efficiency of public service provision – in other words, providing a public service of a given quality and quantity at a lower cost. However, such systems often imply substantial fixed costs to build necessary digital infrastructures for delivering the service. In sectors like agriculture, digital public service provision such as digital agricultural extension programs have seemed to improve the efficiency of agricultural markets. Results are more mixed, however, in the areas of education and health, despite
1 Broadly is defined as the provision of services to promote economic, social and environmental sustainability.
2 Information and communication technologies (ICTs) encompass the different types of platforms by which information flows
and communications are made (mobile phones, smartphones, computers, tablets, radios, pagers/beepers, etc.), the different functions enabled by these platforms (communications, information dissemination, information collection, information processing), and the various types of content transmitted through them (calls, text messages, emails, websites, videos, radio broadcasts, radio messages, etc.).
the relatively large number of initiatives in these sectors. Overall, although many digital innovations have been successfully deployed in SSA, there are structural obstacles to scaling up, which as of yet have precluded digital technologies from playing their intended role of “engines of growth” (Bresnahan & Trajtenberg, 1995).
The objective of this report is to promote a deeper understanding of the process of digitization of public service provision in SSA in general and West Africa in particular by highlighting the opportunities and challenges faced by digital initiatives multiplication across the region. The next section of this report provides a general background explaining the mechanisms by which public services delivery can be improved, painting a picture of the current state of digitization across SSA. This first step is necessary to understand where SSA is starting from in terms of digitization, and what is needed for digital technologies to spur the region to catch up in providing access to public services. In the third section, once the global picture of the ICT-public service nexus in Sub-Saharan Africa is given, the report goes into the details of selected digital initiatives by proposing a review of evidence-based analyses of African digital interventions that aims to unravel the reasons for their success or failure. The fourth section synthesizes the main report’s findings and draws some policy implications.
2.
Digitization and public services provision in Sub-Saharan African economies:
general background
Goldfarb and Tucker (2019) define digital technologies as “the representation of information in bits […] rather than atoms”, which “reduces the cost of storage, computation and transmission of data” (p.3). This definition depicts digital technologies as a type of ICTs with a strong cost-reduction potential. This capacity to reduce various types of cost – information, travel, tracking, and replication costs – makes digital technologies “enabling technologies” (Bresnahan & Trajtenberg, 1995), offering solutions when public services provision is undermined by market failures (Aker, 2017).3 This section maps out the
expected benefits of improved public services delivery in West Africa and compares expected benefits to the reality of the digitization process in the region. The first subsection describes the mechanisms by which digital technologies can leverage public service provision, while the second section assesses the state of ICT coverage in Sub-Saharan and West Africa.
2.1.
Digital technologies, cost reduction and market failures in public service
provision
Following Aker (2017), and Goldfarb and Tucker (2019), it is possible to identify four interrelated areas of cost reduction induced by digital technologies adoption: information search costs, replication costs, transportation costs, and tracking and verification costs.
2.1.1.
Digital technologies and information search costs reduction.
High information search costs translate into informational asymmetries between economic agents – individuals, households, the private sector, government, administrations – which explains why markets may fail in the delivery of public services in SSA (Finan et al, 2015; Aker, 2017). Imperfect information undermines the monitoring of public service provision, which may lead to situations of corruption, absenteeism, shirking, or clientelism. Imperfect information may also lead to allocative inefficiency and suboptimal taxation or pricing of public goods when public service providers have excessive market powers or are unable to observe preferences or willingness-to-pay of public services beneficiaries (Aker,
2017; Bjorkegren, 2019). Regarding beneficiaries, information asymmetries also translate into insufficient knowledge regarding location, quality, and conditions (eligibility) of public services delivery (World Bank, 2016).
The digitization of information and communication has considerably reduced the monetary and opportunity costs of information searching, since digitized information is generally quickly made public, centralized and easily accessible. This reduction in information search costs associated with digital technologies adoption enlarges the scope, quality, and timeliness of information searching. Information digitization therefore has direct impacts on informational asymmetries between economic agents, reducing price dispersion and improving matching of buyers and sellers (Jensen, 2007; Aker, 2010; Aker & Fafchamps, 2014), increasing the variety of goods and services (Aker & Ksoll, 2015; Suri, 2017; Aron, 2018; Bjorkengren & Grissen, 2018), and reinforcing the monitoring of public administrations (Cilliers et al, 2018; Adida et al, 2018; McNabb et al, 2018). Information cost reduction is therefore one powerful channel through which digital technologies can improve public service provision.
2.1.2.
Digital technologies and replication cost
Digital technologies create public goods (Goldfarb & Tucker, 2019). In fact, one important consequence of digitization for public services delivery is the zero-marginal cost associated with the production of digital goods, implying that such goods are non-rival4. This feature has important consequences for
public services provision when the service to be delivered can be dematerialized, replicated at zero cost, and then disseminated to its intended beneficiaries. In the education sector, public posting of digitized pedagogical materials, together with the improved access of populations to low-cost digital platforms such as the XO tablet, has opened new perspectives for improving access to and quality of educational services (Menascé & Clément, 2017). The non-rivalry of digitized public information has also revolutionized agricultural extension programs by facilitating access to agricultural market information and the spread of agricultural technologies (Aker, 2011; Aker et al, 2016; Courtois & Subervie, 2014). The same process is observable in the health sector, as health workers can easily and remotely send health reminders and advice through communication technologies (Yé et al, 2018).
2.1.3.
Digital technologies and distance-related costs
A corollary of the zero-replication cost of digital goods is the drastic reduction in transportation costs of digital content, such as electronic money or information, from one place to another.5 In many
low-income countries, communication through mobile phones has replaced expensive, time-consuming personal travel that was once necessary for many transactions, including patient follow-up in the health sector, extension agent field visits in the agricultural sector, borrower monitoring in the financial sector, etc. Combined with the information search costs as described in section 2.1.1, the reduction in information transportation costs was expected to diminish the role of physical distance in economic transactions (Cairncross, 2002), since distant parties involved in a transaction can have easy access to information on their counterpart and on the product/service exchanged through digital technologies. In support of this assertion, Lendle et al (2016) have shown that the effect of distance was 65% smaller for e-Bay purchases compared to international trade flows. In a study conducted in Niger, Aker (2010) finds that the reduction of commodity price dispersion resulting from access to mobile phone technology is stronger when agricultural markets are distant, or when the road infrastructure quality is poorer. In the same context, Tack and Aker (2014) have stressed that mobile phone adoption has extended the geographical perimeter of farmers’ market information search. The reduced virtual distance between
4 “A key distinction between goods made of atoms and goods made of bits is that bits are non-rival, meaning that they can be
consumed by one person without reducing the amount or quality available to others” (Goldfarb & Tucker, 2019).
economic agents equipped with mobile technologies enabling electronic payments also increased interpersonal transfers and risk-sharing through mobile money in Kenya (Jack et al, 2013; Jack & Suri, 2014; Riley, 2018). In the education sector, Adida et al (2018) study the benefits of a digital platform facilitating electronic school fee payments by their remote relatives. In the health sector, various mobile applications enable remote follow-up of patients (McNabb et al, 2015).
2.1.4.
Digital technologies and tracking, targeting, and verification costs
In relation to previous costs reduction, the digitization of information has enabled the centralization and storage of information, thereby reducing the costs of collecting and processing information on market conditions, public service users or administrations (Aker, 2017). Digital data collection can take several forms, from phone calls or SMS-based surveys to mobile-money transactions data or “digital footprints left behind in the transaction logs of mobile phones” (Blumenstock, 2016). Putting aside the important privacy issues stemming from the exploitation of personal information made available by DT usage (Blumenstock, 2016), digitization of information can be beneficial to public goods provision, when providers can obtain better information on citizen’s preferences and can better target public good recipients (McNabb et al, 2015), or when citizens can monitor government administrations and make public goods providers more accountable (Aker & Blumentsock, 2014; Aker, 2017). Digital technologies could therefore be instrumental to state interventions by driving the modernization of public administrations in low-income countries, as highlighted by Liu and Yuan (2015). This centralization of information through digital technologies has also reduced the need for costly verification and facilitated trust in economic exchanges by improving the reliability of information collected and processed by economic agents (Zanello et al, 2014).6
Overall, digital technologies have the potential to leapfrog infrastructures, processes, administrations, and institutions that have been put in place in industrialized countries to reduce market failures, but which are missing or failing in low-income countries. This potential however greatly depends on ICT adoption and diffusion in the population. The next subsection looks more closely at the state of digitization in SSA and West Africa.
2.2.
Where does the digitization of Sub-Saharan and West Africa stand?
In Africa, expectations of the digital economy to take-off, to create jobs, and to offer satisfying living conditions to populations are particularly important. According to the United Nations, demographic forecasts for the entire SSA region project an increase in the population size from 1.3 billion inhabitants in 2020 to 2.5 billion in 2050, meaning that the African population will represent around a quarter of the world’s total population within 30 years. West Africa follows the same trend, as its population is projected to grow from 402 million in 2020 to 796.5 million in 2050, representing around one-third of the project African population in 2050. UN projections of the world population of 6-11 year-old children suggest that almost half of the world’s youth population will be Africa in 2100 (Figure 1). It is therefore in this region that economic and social transformations induced by digital technology dissemination could be the deepest.
6 Keeping in mind that digital technologies also facilitate the circulation of false information such as rumors and bot-induced
FIGURE 1. YOUTH POPULATION (6 TO 11 YEARS-OLD) PROJECTION, AFRICA VS REST OF THE WORLD
Source: UN Population Division (2017 revision), based on the median fertility scenario. https://ourworldindata.org/.
2.2.1.
The Internet divide in SSA
In a recent paper, Cariolle (2020) stresses that the laying of telecommunications submarine cables in 2009-2010 along African coasts has brought broadband Internet and has accelerated the uptake of Internet in populations throughout the region, yielding a 3-5 average percentage point increase in Internet penetration rates in SSA (Figure 2). This positive relationship between broadband arrival and Internet adoption is independent of the trend of continuous diffusion of mobile phones throughout the region since 2000 (Figure 3). As shown in Figure 3, the diffusion of mobile devices throughout the population has been exponential since 2000, that is, prior to the quantum leap in international Internet bandwidth capacity; there has also been an exponential decrease in the median charge for mobile prepaid connections and the increase in the share of the population covered by mobile networks. As pointed out by Aker and Mbiti (2010), the mobile phone has leapfrogged missing landline infrastructures, especially in rural areas, so that mobile phone devices represent the principal digital service delivery platform. As shown in Figure 3, mobile penetration and coverage in West Africa followed a slightly higher pace of progression than the rest of SSA, despite a later decline in mobile phone prepaid tariffs. Overall, in 2016, more than 80% of the population across the region was covered by a mobile network, almost all Africans owned a mobile phone device, and the median mobile prepaid connection charge was below $1.00 US.
FIGURE 2. INTERNATIONAL CONNECTIVITY AND INTERNET PENETRATION IN SSA.
FIGURE 3. MOBILE PHONE PENETRATION IN WEST AFRICA AND SSA
West Africa Rest of SSA
Source: Authors, from ITU dataset. West Africa encompasses ECOWAS countries.
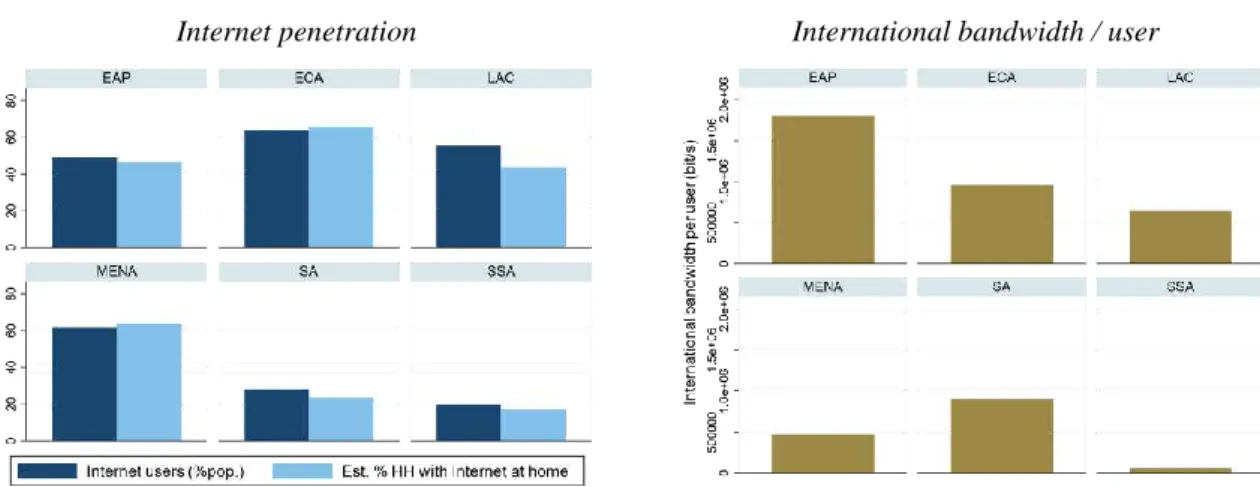
Digital initiatives that have benefitted from a large diffusion in the population are generally based on simple communications technologies (phone calls, text messages) or on mobile money, and do not rely on Internet access nor require owning a sophisticated communications device (Aker & Blumenstock, 2014). The simplicity in the access and use of digital technologies is indeed probably a precondition for unleashing its leapfrogging potential. In addition, the rise in African digital innovations has to be examined in light of another reality: in 2016, only 20% of the African population (including West Africans) had used the Internet and less than 20% of households had an Internet connection at home (Figure 4). To illustrate this concern, Mothobi and Grzybowski (2017) find that in 11 SSA countries, people remote from physical infrastructures are more inclined to use their mobile phone to make financial transactions (mobile money) than people with access to such infrastructures.
The potential for rollout of the newest generation of information technologies in SSA – i.e. blockchain technologies, artificial intelligence, cloud computing, etc. – therefore faces a serious barrier in terms of the Internet divide in the population. Beyond the low Internet penetration rates that are characteristic of the region, this Internet divide is also striking in terms of broadband capacity and affordability. Despite the rapid progression of the international bandwidth per user induced by the recent laying of submarine cables, SSA lags very far behind other developing areas (Figure 4), while the speed and cost of access to broadband Internet remains highly prohibitive in a number of African countries compared to other regions (Figure 5).
FIGURE 4. INTERNET PENETRATION RATES AND BANDWIDTH PER USER IN 2016 ACROSS DEVELOPING REGIONS.
Internet penetration International bandwidth / user
Source: Authors, from ITU database. EAP: East Asia and Pacific region. ECA: Eastern and Central Europe. LAC: Latin America and the Caribbean. MENA: Middle East and North Africa. SA: South Asia. SSA: Sub-Saharan Africa.
FIGURE 5. SPEED AND AFFORDABILITY OF BROADBAND INTERNET, SSA VERSUS OTHER DEVELOPING REGIONS.
Fixed broadband speed, 2016 Fixed broadband monthly subs. charge (USD), 2014
Source: Authors, from ITU database. EAP: East Asia and Pacific region. ECA: Eastern and Central Europe. LAC: Latin America and Caribbean. MENA: Middle East and North Africa. SA: South Asia. SSA: Sub-Saharan Africa.
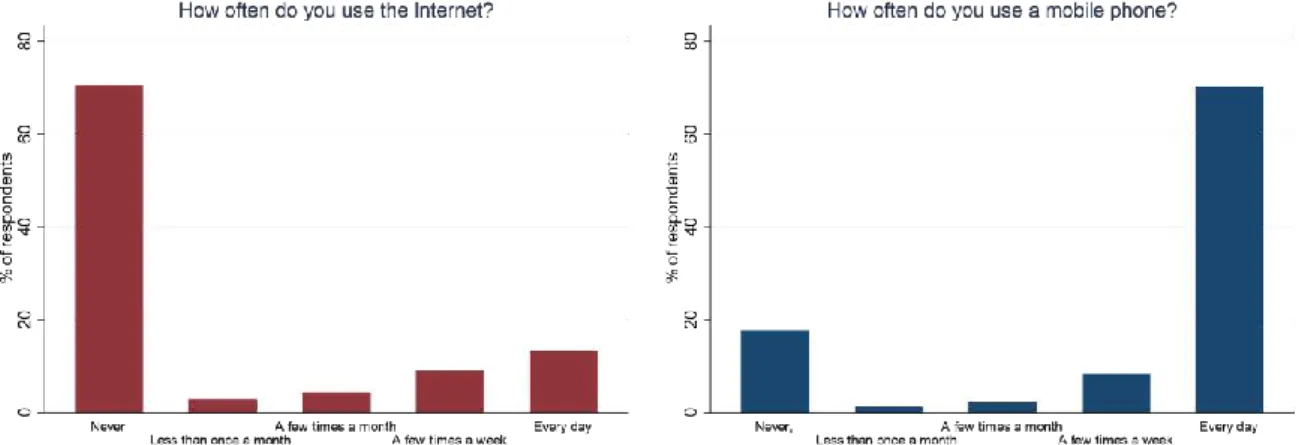
Within SSA, Internet penetration rates did not exceed 54.3% of the population in 2015 (see Map 1). South Africa, Kenya, Angola, Sudan, Nigeria and Ghana were in the highest penetration rate quintile, with Internet penetration rates lying between 21% and 54% percent of the population. However, Internet penetration in Francophone landlocked countries did not exceed 7%; and among West African countries, Niger, Sierra-Leone, Guinea, and Guinea-Bissau had penetration rates lower than 3.6 percent of the population. Looking at Internet and mobile phone adoption behaviors within the African population, Afrobarometer surveys conducted over a sample of some 50,000 African citizens in 2014 and 2015 in 32 SSA countries stress that the pattern of frequency in Internet use is the exact opposite of mobile phone use (Figure 6). In fact, while 70% of respondents reported never having used the Internet, only 13% of the same respondents reported never having used a mobile phone. By contrast, only 18% of respondents reported using the Internet on a daily basis, while 70% of them declared using a mobile phone every day. These patterns are similar when surveys are confined to West African countries (Figure 7). In the next subsection, we show that these patterns differ according to gender, geography, revenue, and education.
MAP 1.INTERNET PENETRATION RATES IN SUB-SAHARAN AFRICA,2015.
FIGURE 6. FREQUENCY OF INTERNET AND MOBILE PHONE USAGE IN SSA.
Source: Afrobarometer, 6th round. Sample: 48,283/48.966 respondents (left/right-side graphs). Surveys conducted in 32 SSA
countries between 2014 and 2015. Sample weights are applied.
FIGURE 7. FREQUENCY OF INTERNET AND MOBILE PHONE USAGE IN WEST AFRICA.
Source: Afrobarometer, 6th round. Sample: 17,750/17,912 respondents (left/right-side graphs).West African countries: Benin,
Burkina Faso, Cape Verde, Côte d’Ivoire, Ghana, Guinea, Liberia, Mali, Niger, Nigeria, Senegal, Sierra Leone, Togo. Surveys conducted between 2014 and 2015. Sample weights are applied.
2.2.2.
A multi-dimensional digital divide
In SSA, important differences in access to digital technologies can be observed among and across populations. This heterogeneity is explained by demand-side factors, including literacy and numeracy skills necessary to use digital technologies, but also supply-side factors, such as mobile or fiber infrastructure coverage. As a result, the digital divide is multidimensional, differing according to economic status (rich versus poor), geography (urban versus rural areas), gender (male versus female), and education level (educated versus uneducated). Taking into account the different dimensions that condition the adoption of mobile telephone and/or Internet services is necessary to realize the expected dividends of digitization. We emphasize below four key dimensions of the digital divide.
The spatial digital divide
According to ITU (2019), in 2017, only 65% percent of the population had access to the 3G network. Coverage was even lower in West African countries, reaching only 56% of the population (against 68% in the rest of SSA), illustrated by the unequal distribution of the fiber backbone infrastructure, serving
only major demographic centers in some countries such as Nigeria, Côte d’Ivoire, and Burkina Faso, or totally absent in others like Guinea and Sierra-Leone (Map 2).
MAP 2.BACKBONE INFRASTRUCTURE DEPLOYMENT AND POPULATION DENSITIES IN WEST AFRICA, IN 2015.
Source: Authors. Data from Telegeography, Peering DB, Packet Clearing House databases.
Despite the rapid catch-up of mobile network extension in recent years (Figure 3), the geographical coverage of fiber and mobile Internet infrastructure in SSA remains uneven between rural and urban areas. This spatial digital divide is striking when looking at Internet adoption, as 80% of Afrobarometer respondents located in rural areas declared never having used the Internet, against half of the population surveyed in urban areas (Figure 8). However, this divide is also evident if we look at the adoption of basic communication technologies such as the mobile phone. In fact, only 60% of rural respondents declared using a mobile phone on a daily basis, against more than 80% of urban respondents.
FIGURE 8. THE SPATIAL DIGITAL DIVIDE, URBAN VERSUS RURAL POPULATIONS.
How often do you use the Internet? How often do you use a mobile phone?
Source: Afrobarometer, 6th round. Sample: 17,750/17,912 respondents (left/right-side graphs). Sample weights are applied.
The geography of the digital divide is also strongly related to other critical infrastructure, such as road or energy infrastructure, so that digital and physical isolation of populations remote from urban centers have a compounding effect. Figure 9 below illustrates the gap in Internet and mobile phone use between populations with and without access to paved roads. Again, the divide is striking, as 80% of Afrobarometer respondents without access to paved roads declared having never used the Internet, and only 60% of these same respondents declared using a mobile phone every day. By contrast, only 60% of respondents with access to paved roads declared having never used the Internet and 80% of them declared using a mobile phone every day.
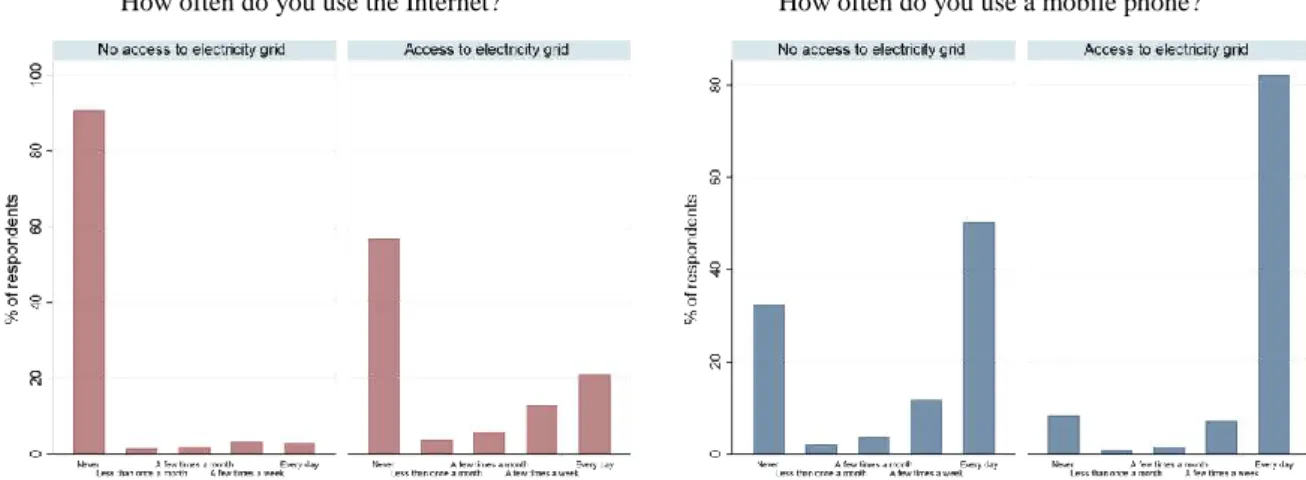
The contrast becomes even clearer when considering populations’ access to the electricity infrastructure, as in Figure 10. This figure shows that some 90% of respondents without access to the electrical grid have never used the Internet, against less than 60% of respondents with electricity access. Moreover, around 30% of respondents without electricity access declared having never used a mobile phone, which is significantly higher than the less than 10% of populations with electricity access.
FIGURE 9. THE SPATIAL DIGITAL DIVIDE AND GEOGRAPHICAL ISOLATION.
How often do you use the Internet? How often do you use a mobile phone?
Source: Afrobarometer, 6th round. Sample: 17,750/17,912 respondents (left/right-side graphs). Sample weights are applied. FIGURE 10. THE SPATIAL DIGITAL DIVIDE AND ENERGY DEPRIVATION.
How often do you use the Internet? How often do you use a mobile phone?
Source: Afrobarometer, 6th round. Sample: 17,734/17,896 respondents (left/right-side graphs). Sample weights are applied.
The educational digital divide.
The unequal coverage of Internet infrastructure often overlaps with the uneven spatial distribution of road and energy infrastructures, but also of educational infrastructure. Consequently, in addition to physical isolation and energy deprivation driving poor access to ICTs among rural populations, they also often lack the minimum literacy and numeracy skills necessary to adopt them. In fact, the digital divide is also educational, as clearly evidenced by Figures 11 and 12. In Figure 11, the Internet divide is striking among low-educated populations, as more than 80% of respondents with primary school level or less have never used the Internet. The share of people who have never used the Internet sharply declines at intermediate education levels, but a truly high occurrence of Internet use is only observable at the highest level of education (university or postgraduate education). In Figure 12, the mobile adoption gap is observable through the low share of less-educated people (primary schooling or less) declaring using a mobile phone on a daily basis. By contrast, the share of respondents declaring using a mobile phone every day reaches at least 80% in populations with secondary schooling or higher.
FIGURE 11. EDUCATION LEVEL AND THE INTERNET DIVIDE
How often do you use the Internet?
Source: Afrobarometer, 6th round. Sample: 17,701 respondents. 0=Never, 1=Less than once a month, 2=A few times a month,
3=A few times a week, 4=Every day. The question on education level was: “What is your highest level of education?”.
FIGURE 12. EDUCATION LEVEL AND THE MOBILE DIVIDE
How often do you use a mobile phone?
Source: Afrobarometer, 6th round. Sample: 17,861 respondents. 0=Never, 1=Less than once a month, 2=A few times a month,
3=A few times a week, 4=Every day. The question on education level was: “What is your highest level of education?”. The digital divide and the income gap
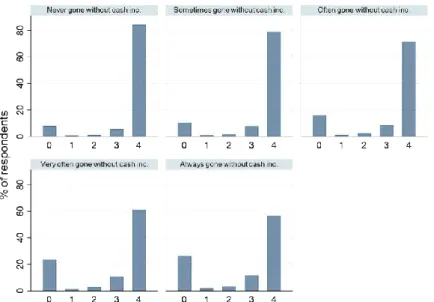
The multidimensional nature of the digital divide, illustrated in earlier subsections, combined with the high telecommunication tariffs charged by African operators and Internet Service Providers (Figure 5), makes income level a key determinant of ICT access. While information on income earned by individuals is not provided by Afrobarometer surveys, the survey does provide information on the frequency of cash income earnings. Figures 14 and 15 compare the frequency of Internet or mobile phone use with the frequency of cash income earning within households. Figure 13 stresses that the share of respondents declaring having never used the Internet strongly increases when the frequency of
earning cash lowers. In Figure 14, we observe that the share of respondents using a mobile phone on a daily basis strictly decreases when cash flows become scarcer. Therefore, the digital divide is also reflected by the income gap.
FIGURE 13. CASH INCOME AND THE INTERNET DIVIDE
How often do you use the Internet?
Source: Afrobarometer, 6th round. Sample: 17,694/17,855 respondents (left/right-side graphs). 0=Never, 1=Less than once a
month, 2=A few times a month, 3=A few times a week, 4=Every day. The question on cash income flow was: “Over the past year, how often have you or your family gone without a cash income?”
FIGURE 14. CASH INCOME AND THE MOBILE DIVIDE
How often do you use a mobile phone?
Source: Afrobarometer, 6th round. Sample: 17,694/17,855 respondents (left/right-side graphs). 0=Never, 1=Less than once a
month, 2=A few times a month, 3=A few times a week, 4=Every day. The question on cash income flow was: “Over the past year, how often, have you or your family gone without a cash income?”
The gender digital divide
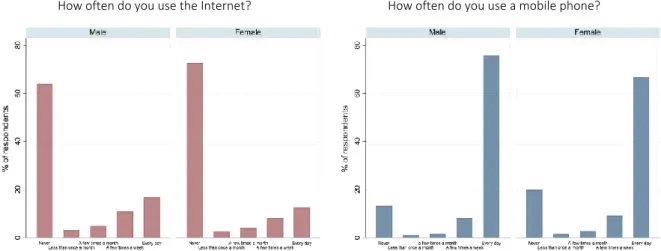
One last logical dimension stemming from all other dimensions of the digital divide is the gender digital gap. Discrimination in access to education, health, within-household resources, or financial services often experienced by women is indeed also a significant factor in terms of access to ICTs. In fact, Figure 15 below shows that the share of women who declared never having used the Internet is high at 80% of respondents when compared to the percentage of male respondents at 60%. Regarding mobile phone usage, the share of women declaring having never used a mobile phone is 20%, compared to 13% of male respondents, while the share of women declaring using a mobile phone every day is 67%, compared to 76% of male respondents. Therefore, the digital gender gap is an additional dimension of gender inequalities existing in the region. However, Suri and Jack (2016) support that ICT interventions, and in particular mobile money interventions, targeted to women not only increase their welfare (in terms of occupational choice) but also have a greater poverty-reducing effect.
FIGURE 15. DIGITAL DIVIDE AND THE GENDER GAP
How often do you use the Internet? How often do you use a mobile phone?
Source: Afrobarometer, 6th round. Sample: 17,694/17,855 respondents (left/right-hand side graphs).
2.3.
ICT diffusion in selected West African countries
This subsection provides background details on the specific contexts of various evidenced-based intervention analyses that will be presented in Section 3. First, we describe the case of Niger, a low-income, rural, landlocked, francophone West-African country, has received various mobile-based interventions in multiple areas of public service provision, including agricultural extension, education, and anti-poverty programs. Second, we focus on Ghana, a fast-growing coastal anglophone country with one of the highest GDPs per capita in West Africa, where digital technologies have multiplied in recent years (Figure 4) and which has also received attention from researchers.
2.3.1.
Access to ICTs in a Sahelian landlocked country: insights from Niger
According to the ITU (2019), 92% of the Nigerien population had access to the mobile network in 2017, but only 24% was covered by the 3G network and was therefore able to use the Internet through their mobile device. As shown in Table 1, using the Internet in Niger is very uncommon, especially in rural areas where 98% of respondents declare having never connected to the Internet. Internet adoption in urban centers does not seem to be easy either, as more than 80% of urban respondents declare using the Internet at most a few times per month (77% of them have never used it). Interventions aimed at improving access to public services through Internet technologies are therefore likely to face low take-up and as of yet have no grounds for scaling-take-up. Regarding mobile money adoption, only 9% of respondents of the Findex survey in Niger declared having a mobile money account in 2017, with this
figure probably much lower in rural areas, which is very far from the 77% mobile money account ownership among the Kenyan population (Demirgüç-Kunt et al, 2017). Again, despite evidence highlighting the benefits of public transfers using mobile money technology for rural populations in Niger presented in Section 3 (Aker et al, 2016b), this low penetration is a serious impediment to the scaling of such interventions.
TABLE 1.THE INTERNET DIVIDE IN NIGER
How often do you use the Internet? % of total % of urban % of rural
Never 94.27 77.02 97.61
Less than once a month 0.58 1.35 0.43 A few times a month 1.12 3.60 0.64 A few times a week 1.75 7.77 0.58
Every day 2.28 10.25 0.74
Data: Afrobarometer, 6th round. Survey conducted in 2014-2015. Sample:
1,192 respondents. Sample weights applied.
However, mobile phone-based public service interventions are much more likely to succeed with higher rates of mobile phone adoption among urban as well as rural populations (Table 2). Mobile phone services started to become operational only in some parts of Niger as of October 2001. Mobile coverage has since been deployed gradually, in priority in urban centers and locations close to international borders, and then extended to rural areas (Aker, 2010; Tack & Aker, 2014). Still, some populated areas in Niger (in the North of Niamey and Zinder) do not benefit from even 2G coverage, with almost no 3G coverage (see the Map 3 below). As a result, contrary to Internet use, 55% of respondents declared using a mobile phone every day (50% of rural respondents) in 2014-2015, and 60% of them owned a mobile phone (55% in rural areas) (Afrobarometer, 2016).
TABLE 2.THE MOBILE DIVIDE IN NIGER
How often do you use a mobile phone? % of total % of urban % of rural
Never 26.98 3.45 31.52
Less than once a month 4.63 2.13 5.12 A few times a month 3.38 1.23 3.80 A few times a week 9.88 9.21 10.01 Every day 55.13 83.98 49.56
Data: Afrobarometer, 6th round. Survey conducted in 2014-2015. Sample:
1,200 respondents. Sample weights applied.
Moreover, the potential of communications technologies such as mobile phones to move many Nigeriens out of poverty is probably very strong, given the various structural handicaps faced by Nigeriens that could be overcome through digital public services delivery (Aker, 2017). In fact, 44.5% of the population in Niger lives with less than less than $1.90 a day (World Bank, 2020). A large bulk of the poor is located in rural areas (Table 3), works in the agriculture sector, does not have access to effective and affordable communications technologies, but incurs large travel and opportunity costs related to the poor state of transportation infrastructure coverage.7
7 In 2014, the road density was very low, equal to 0.69 km of roads per 1,000 km2, and in 2016, only 20.4% of the road network
TABLE 3.THE SPATIAL INCOME GAP IN NIGER Do you have a job that pays a cash income?
% of total % of urban % of rural No, not looking for 59.67 51.04 61.31 No, looking for 23.33 15.63 24.80 Yes, part time 8.42 11.46 7.84 Yes full time 8.58 21.88 6.05
Data: Afrobarometer, 6th round. Survey conducted in 2014-2015. Sample:
1,200 respondents. Sample weights applied.
MAP 3.MOBILE AND INTERNET INFRASTRUCTURE ROLLOUT IN NIGER,2019.
Source: ITU Interactive map, https://www.itu.int/itu-d/tnd-map-public/.
2.3.2.
Access to ICTs in an industrializing West African coastal country: insights from Ghana
Unlike Niger or other landlocked West-African countries, Ghana is a coastal country, where 56% of the population lives in urban areas (World Bank, 2020), benefitting from dynamic agricultural and industrial sectors and from stable agricultural and GDP growth during the last two decades. The share of the GDP contributed by the Ghanaian agricultural sector has been declining over the years, representing only 19% of the GDP in 2018, but this sector still represents approximately 35% of total employment. Ghana faces a much less severe poverty rate than Niger, as 14% of the population lives on less than $1.90 a day. However, the rural population, mostly employed in the agricultural sector, is more exposed to poverty than its urban counterpart: in 2014-2015, 62% of Afrobarometer’s respondents in rural Ghana declared not having a regular source of cash income against 46% in urban areas (Table 4).
TABLE 4.THE SPATIAL INCOME GAP IN GHANA
Do you have a job that pays a cash income?
% of total % of urban % of rural
No, not looking for 42.19 33.94 49.09
No, looking for 12.21 11.75 12.60
Yes, part time 23.09 25.55 21.03
Yes full time 15.41 18.33 12.97
Data: Afrobarometer, 6th round. Survey conducted in 2014-2015. Sample:
1,200 respondents. Sample weights applied.
According to the ITU (2019), 98% of the Ghanaian population had access to a mobile network in 2017, and 80% was covered by the 3G network, with the great majority of urban areas covered (Map 4), so that contrary to Niger, a large share of the population is able to access the Internet through their mobile
device. As shown in Table 5, using the Internet in Ghana is more common than in Niger, as almost 18% of Afrobarometer respondents and a quarter of those located in urban centers declare using it few times a week or every day. Still, a large part of the population has never used it, especially in rural areas where 88% of respondents declare having never used the Internet, compared to 67% in urban areas. Unsurprisingly, mobile money adoption is much larger in Ghana, as 43% of Findex survey respondents declared owning a mobile money account in 2017, which is still much lower than in Kenya but similar to Uganda (44%) and Tanzania (53%) (Demirgüç-Kunt et al, 2017). Despite an urban environment favorable to digital technologies take-up, rural populations remain excluded from this dynamic and face the same constraints as their Nigerien counterparts. In fact, evidence from Ghana presented in Section 3 (Courtois & Subervie, 2014; Zanello et al, 2014) stresses that rural farmers face the same market failures and derive the same benefits from using basic ICTs as do rural Nigerien rural.
TABLE 5.THE INTERNET DIVIDE IN GHANA
How often do you use the Internet? % of total % of urban % of rural
Never 76.40 66.96 87.66
Less than once a month 1.99 2.49 1.40 A few times a month 3.87 5.25 2.24 A few times a week 5.89 7.86 3.55 Every day 11.84 17.45 5.15
Data: Afrobarometer, 6th round. Survey conducted in 2014-2015. Sample: 2,351
respondents. Sample weights applied.
The potential for scaling ICT-based interventions aimed at improving public service provision in rural areas could therefore be large if the intervention builds on simple mobile phone technologies. Map 4 below shows that the telecommunications infrastructure network in Ghana is denser and has a wider coverage and a greater capacity to carry telecommunications than that of Niger. Moreover, Table 6 shows that Ghana displays a much higher proportion of people using mobile phones on a daily basis than does Niger, whether they live in urban (89%) or in rural (63%) areas. The proportion of mobile phone ownership is also large, as 82% of respondents declared owning a mobile phone (91% in urban centers against 71% in rural areas). But still, almost one quarter of rural respondents declared having never used a mobile phone and 28% of the same respondents do not own a mobile phone (Afrobarometer, 2016).
TABLE 6.THE MOBILE DIVIDE IN GHANA
How often do you use a mobile phone? % of total % of urban % of rural
Never 14.01 6.02 23.60
Less than once a month 1.10 0.89 1.34 A few times a month 1.91 0.89 3.13 A few times a week 5.75 3.23 8.77
Every day 77.23 88.97 63.16
MAP 4.MOBILE AND INTERNET INFRASTRUCTURE ROLLOUT IN GHANA,2019.
Source: ITU Interactive map, https://www.itu.int/itu-d/tnd-map-public/.
2.4.
Main lessons
To sum this subsection up, populations excluded from public service provision are usually the same as those which are deprived from access to ICTs, so that ICT-based public service provision interventions that do not take into account the various dimensions of the digital divide as previously emphasized may fall short of achieving their intended purpose. In other words, such interventions, in order to maximize their development impact, should be designed to target rural populations remote from broadband infrastructures, characterized by low average literacy and numeracy rates and earning small income, and to address gender inequality. Moreover, despite the rapid uptake of mobile phones and multiplication of digital innovations in SSA, Internet penetration is still low compared to other developing areas. An environment more conducive to the adoption of internet-related technologies could certainly improve the digital dividends for public services delivery, employment, economic diversification, and private sector development in SSA economies (Ndulu, 2006; Schumann & Kende, 2013). However, interventions promoting digital public service provision through simple mobile phone use should benefit from a greater level of adoption among the population, especially in rural areas. As a result, most evidence-based studies of digital public service interventions presented in the next section highlight the potential of interventions based on a basic information and communications platform, the mobile phone.
3.
Digital initiatives and public services delivery in Sub-Saharan Africa: what do
evidence-based studies tell us?
The uptake of mobile phone technology has facilitated the multiplication of digital innovations throughout the SSA. In West Africa, this uptake of ICTs has enabled the implementation of more than 400 operational digital initiatives (Briter Bridges, 2019) in 2019 across a wide range of sectors and countries (Figure 4). Fintech, Ed-Tech, health tech (mHealth), Agro-Tech, E-commerce and job platforms represent the sectors most affected by digital initiative expansion. However, only four countries – Nigeria, Ghana, Senegal and Côte d’Ivoire by decreasing order – contain more than 75% of
these initiatives. Therefore, the digital innovation process is unequally distributed throughout the region, mostly benefitting the four biggest economies of the area.
FIGURE 16. DIGITAL INNOVATION MULTIPLICATION IN WEST AFRICA.
Source: Briter Bridges, innovation maps, 2019. https://briterbridges.com/innovation-maps. Note: 442 digital innovations recorded. Some innovations have been simultaneously implemented in various West African countries. Among them, some are reported under the term “multi.” Numbers in this figure are representative, not exhaustive, of the digital economy’s expansion.
While this rise in digital innovations figures well for mobile and Internet technologies uptake and their contribution to the digital technologies takeoff in SSA and West Africa, their impact on public services provision and welfare depends on context, technology type, and the nature of the market failures they are intended to address (Aker & Blumenstock, 2014). We propose in this section a review of evidence-based studies conducted in West Africa and abroad that have emphasized a wide range of digital interventions in four areas of public service provision: agriculture, education, health, and financial services.
3.1.
Information technologies and agricultural sector development
The agricultural sector’s development and contribution to economic growth in SSA, including West Africa, is hampered by multiple structural constraints. These constraints include harsh climatic conditions, limited infrastructure coverage, rural and sparsely populated regions and markets, low literacy rates among adult populations, and the poor diffusion of agricultural market information and technologies (Aker, 2011; Aker et al, 2016a). Figure 17 below, drawn from Aker (2011) and reproduced from Mittal et al (2010), displays the different information needs associated with each stage of the agricultural production function, and the different areas of action of agricultural extension programs.8
Figure 17 and Table 7 below synthesize how different types of ICTs may respond to informational needs and support agricultural market functioning, from crop planning to sales of produce in agricultural markets. Figure 18 provides information on 81 digital agricultural extension programs (Eagri) currently deployed in SSA (GSMA, 2019a) and stresses that most of these programs provide farmers with information on agricultural prices through text messages or the Internet. Appendix A reports examples of African extension programs identified by Aker (2011).
8 Agricultural extension is defined as “the delivery of information inputs to farmers” (Anderson & Feder, 2007). Agricultural
extension programs have been put in place to improve farmer access to agricultural market information and learning about agricultural techniques (Aker, 2011).
FIGURE 17. INFORMATION NEEDS ALONG THE AGRICULTURAL PRODUCTION CYCLE
Source: Aker (2011), reproduced from Mittal et al (2010).
FIGURE 18. EAGRI DEPLOYMENT IN SSA, BY INFORMATION AND TECHNOLOGY TYPE. (A) INFORMATION TYPE (B) TECHNOLOGY TYPE
Source: GSMA Agritech deployment tracker, 2019a.
Aker (2011) and Aker and Mbiti (2010) point out the limits of traditional means of gathering information on African agricultural markets, generally based on personal travel, radios, newspapers or landline phone calls. Their effectiveness is indeed strongly limited by the size of the rural population, low adult literacy rates (especially in rural areas), and poor coverage of paved primary roads and telecommunications landline infrastructures. They also stress the constraints on Internet-based technology diffusion due to the low uptake of computers and smartphones and to the limited geographic coverage of 3G technology.
However, Aker (2011) identifies six levers by which basic mobile phone technologies, largely available throughout the African population, can improve access to agricultural market information. First, farmers can use mobile phones to obtain access to information on agricultural prices and technologies at low cost through their private social networks. Second, mobile-based communications technologies, such as
SMS, can increase the cost-efficiency of agricultural extension programs. This technology reduces the number of visits required by agricultural extension agents to transmit agricultural market information, increases the timeliness of information transmission, and enlarges the agricultural extension system’s geographical outreach at low marginal cost (see Box 1). Third, mobile phone usage can reduce communication costs between farmers and buyers and farmers and traders, thereby fostering technology upgrading, reductions in price uncertainty, and improved input management and crop allocation across markets. This includes the use of technologies such as drones to obtain spatially explicit information on crop health and make precision applications of inputs such as fertilizer (see Box 2). Fourth, mobile phone technology can serve as a vehicle for the delivery of services that are complementary to agricultural activities. In particular, mobile phone diffusion among farmers facilitates the adoption of mobile money services (see section 3.4 on mobile money), which can in turn help them obtain insurance against weather or health shocks or to gain access to credit and saving services. Fifth, mobile phones can be used to improve the collection of information on farmers and extension agents, which can in turn increase the timeliness of market information exchanges and the accountability of extension agents. Lastly, mobile phones can help enhance the coordination between agricultural market actors, namely farmers, traders, extension agents, and research centers. In the following subsection, we review evidenced-based studies, focused on Niger and Ghana, which highlight the potential and the limits of mobile phone-based information systems for agricultural development.
3.1.1.
Mobile phone access and grain market efficiency in Niger
Access to price information in landlocked and rural countries like Niger is often hindered by a lack of infrastructure and the long distances separating agricultural marketplaces. Such obstacles in communications induce important information costs, with serious consequences on producer and consumer behaviors and on agricultural market efficiency overall. Direct consequences of such market failures include spatial and time dispersion in commodity prices, reflecting supply and demand misallocation on commodity markets, which can sometimes lead to shortages that can have dramatic consequences on the welfare of rural populations. A better diffusion of ICTs could help farmers reduce information and transport costs and leapfrog missing transport infrastructures. We review below four related papers that illustrate how the adoption of basic ICTs such as mobile phones, and simple usage such as phone calls, may significantly improve the functioning of agricultural markets in Niger and the wellbeing of rural populations.
First, interesting evidence on the effect of mobile phone access on commodity producer behavior can be found in studies conducted by Aker (2010) and Aker and Fafchamps (2014). These studies provide evidence on the impact of mobile phone coverage on price dispersion across agricultural markets. In these markets, farmers produce, sell, and buy grains and transact with traders (retailers, intermediaries, semi-wholesalers, and wholesalers), and their produce is sent to various markets by transporters. Distances between markets considered in their study can vary substantially, from eight to more than 1,200 kilometers (Aker, 2010), inducing large transport costs and therefore large information costs. In a study on the impact of mobile phone coverage on grain price dispersion between markets, Aker (2010) estimates that the average price dispersion after a pair of markets benefits from mobile phone coverage decreased by approximately 10%, corresponding to a reduction of 2.5-3.5 CFA/kg. Aker (2010) also highlights that this effect is stronger when markets are remote from each other, and when they are connected by unpaved road infrastructures, thereby supporting the theory that the benefits of ICTs are larger in isolated areas.