The Cryosphere, 13, 2977–3005, 2019 https://doi.org/10.5194/tc-13-2977-2019
© Author(s) 2019. This work is distributed under the Creative Commons Attribution 4.0 License.
Recent glacier and lake changes in High Mountain Asia and their
relation to precipitation changes
Désirée Treichler1, Andreas Kääb1, Nadine Salzmann2, and Chong-Yu Xu1
1Department of Geosciences, University of Oslo, Sem Sælands vei 1, 0371 Oslo, Norway
2Department of Geosciences, University of Fribourg, Chemin du Musée 4, 1700 Fribourg, Switzerland
Correspondence: Désirée Treichler ([email protected]) Received: 31 October 2018 – Discussion started: 12 November 2018
Revised: 16 August 2019 – Accepted: 5 September 2019 – Published: 13 November 2019
Abstract. We present an updated, spatially resolved esti-mate of 2003–2008 glacier surface elevation changes for the entire region of High Mountain Asia (HMA) from ICE-Sat laser altimetry data. The results reveal a diverse pattern that is caused by spatially greatly varying glacier sensitiv-ity, in particular to precipitation availability and changes. We introduce a spatially resolved zonation where ICESat samples are grouped into units of similar glacier behaviour, glacier type and topographic settings. In several regions, our new zonation reveals local differences and anomalies that have not been described previously. Glaciers in the Eastern Pamirs, Kunlun Shan and central TP were thickening by 0.1– 0.7 m a−1, and the thickening anomaly has a crisp boundary in the Eastern Pamirs that continues just north of the cen-tral Karakoram. Glaciers in the south and east of the TP were thinning, with increasing rates towards southeast. We attribute the glacier thickening signal to a stepwise increase in precipitation around ∼ 1997–2000 on the Tibetan Plateau (TP). The precipitation change is reflected by growth of en-dorheic lakes in particular in the northern and eastern TP. We estimate lake volume changes through a combination of re-peat lake extents from Landsat data and shoreline elevations from ICESat and the Shuttle Radar Topography Mission (SRTM) digital elevation model (DEM) for over 1300 lakes. The rise in water volume contained in the lakes corresponds to 4–25 mm a−1, when distributed over entire catchments, for the areas where we see glacier thickening. The precipita-tion increase is also visible in sparse in situ measurements and MERRA-2 climate reanalysis data but less visible in ERA-Interim reanalysis data. Taking into account evapora-tion loss, the difference between average annual precipita-tion during the 1990s and 2000s suggested by these datasets
is 34–100 mm a−1, depending on region, which can fully ex-plain both lake growth and glacier thickening (Kunlun Shan) or glacier geometry changes such as thinning tongues while upper glacier areas were thickening or stable (eastern TP). The precipitation increase reflected in these glacier changes possibly extended to the northern slopes of the Tarim Basin, where glaciers were nearly in balance in 2003–2008. Along the entire Himalaya, glaciers on the first orographic ridge, which are exposed to abundant precipitation, were thinning less than glaciers in the dryer climate of the inner ranges. Thinning rates in the Tien Shan vary spatially but are rather stronger than in other parts of HMA.
1 Introduction
High Mountain Asia (HMA) is a large and remote region hosting a range of topographic and climatic regimes (Palazzi et al., 2013). Some areas, like the Himalaya or Karako-ram, are characterised by steep orographic gradients (Bolch et al., 2012). Glacier landscape and shapes, climate, eleva-tion, and consequently glacier behaviour and response to cli-mate change vary strongly throughout the region (e.g. Scher-ler et al., 2011; Fujita and Nuimura, 2011; Bolch et al., 2012; Brun et al., 2017; Sakai and Fujita, 2017). Throughout the recent decades, most glaciers in the region seem to have lost mass and retreated (e.g. Bolch et al., 2012; Kääb et al., 2012; Brun et al., 2017). However, there are some exceptions, most prominently the so-called Karakoram or Pamir–Karakoram anomaly (e.g. Hewitt, 2005; Quincey et al., 2011; Kääb et al., 2012; Gardelle et al., 2013; Kapnick et al., 2014), and posi-tive mass balances are reported for some glaciers on the
Ti-betan Plateau (TP) and Kunlun Shan (Yao et al., 2012; Kääb et al., 2015; Brun et al., 2017).
At the same time, a number of studies report expansion of endorheic lakes on the TP starting around the begin-ning of this century (e.g. Zhang et al., 2017). For these lake systems, additional lake water masses either stem from in-creased lake inflow, i.e. mainly inin-creased precipitation or en-hanced glacier melt, or from reduced water loss, i.e. mainly decreased evaporation. However, in situ meteorological data, which could shed light on precipitation and evaporation changes and their spatial patterns, are barely available for the HMA (Kang et al., 2010) and lacking in particular for the re-mote areas on the TP and Kunlun Shan with suggested recent positive glacier mass balances. In addition, in situ measure-ments at high altitude, in particular for precipitation, are in general subject to challenges (Salzmann et al., 2014). This scarceness and the problems associated with in situ measure-ments likely also affect the accuracy and reliability of reanal-ysis data over some zones of HMA, leaving thus an overall limited understanding of glacier changes and associated cli-mate changes over significant areas of HMA.
HMA region-wide assessments of glacier changes have been derived either from (i) interpolating the sparse in situ measurements (Cogley, 2011; Bolch et al., 2012; Yao et al., 2012), (ii) digital elevation model (DEM) differencing (Gardelle et al., 2013; Brun et al., 2017), (iii) GRACE (Grav-ity Recovery and Climate Experiment) gravimetry data (Mat-suo and Heki, 2010; Jacob et al., 2012; Gardner et al., 2013) or (iv) ICESat satellite laser altimetry (Kääb et al., 2012, 2015; Gardner et al., 2013; Neckel et al., 2014; Phan et al., 2017; Brun et al., 2017). Of these, only Brun et al. (2017), Gardner et al. (2013) and the coarse-resolution GRACE stud-ies cover the entire region of HMA, including the Tien Shan, TP and Qilian Shan. For some regions, the differences be-tween the studies are considerable, even if they address the same time period (Cogley, 2012; Kääb et al., 2015). All four method principles listed above have their specific advantages and disadvantages. A challenge with GRACE data, for in-stance, is the separation of mass changes due to glacier mass loss and other influences, such as changes in lake and ground water storage (e.g. Baumann, 2012; Yi and Sun, 2014). For some DEM differencing studies in the region, a major source of uncertainties is the Shuttle Radar Topography Mission (SRTM) DEM. The SRTM DEM is based on C-band radar that can penetrate up to several metres into snow and ice, depending on the local snow and ice conditions during the SRTM data acquisition in February 2000 (Gardelle et al., 2012b; Kääb et al., 2015). The recent study of Brun et al. (2017) is not affected by radar penetration as it is exclusively based on time series from ASTER optical stereo DEMs. While their new dataset of time-averaged geodetic glacier mass balances is spatially of unprecedented extent and detail, ASTER DEMs suffer from limitations such as sensor shak-ing (jitter) (Girod et al., 2017), biased errors/voids in par-ticular in featureless accumulation areas (Wang and Kääb,
2015; McNabb et al., 2019), and spatio-temporal variations in image acquisitions (Berthier et al., 2016; Brun et al., 2017) that cause the studied time periods to vary throughout the area. The study of Brun et al. (2017) includes a comparison to ICESat 2003–2008 surface elevation changes, although using large spatial regions and ASTER DEMs from 2000 to 2008 as ASTER DEM stacks were too noisy for shorter time spans. With in situ measurements and ICESat laser data, the uncertainty lies in the representativeness of the spatial sampling. Both are not spatially continuous but sample only some glaciers, although ICESat has a higher density of foot-prints than in situ measurements. Direct mass balance mea-surements are only available for a few glaciers (WGMS, 2016, Fig. 1), and the overall mass balance signal they sug-gest is possibly biased towards glaciers at low elevations be-cause these are easier to access (Wagnon et al., 2013).
From recent glacier studies involving ICESat data over HMA, Kääb et al. (2015) suggest that results are sensitive to zone delineation, in particular in areas with strong spa-tial variability of glacier thickness changes. Studies stress the importance of sampling the glacier hypsometry correctly, i.e. that the number of data points per elevation reflects the glacierised area at each elevation. Kääb et al. (2012, 2015) and Treichler and Kääb (2016) found that hypsometries of in-dividual years of ICESat samples may not fit the glacier hyp-sometry, even if the total sample base from the entire studied period reflects the glacier elevation distribution accurately. This can alter the results in cases where there is a consis-tent elevation trend in sampling elevations; i.e. the average sampling elevation increases or decreases over the studied time period. Correct and up-to-date glacier outlines turn out to be very important for deriving ICESat elevation changes. Inclusion of non-glacier elevation measurements, where sur-face elevation is stable, reduces the glacier elevation change retrieved from ICESat. The effect of snow cover, and thus the choice of whether including ICESat winter campaigns or not, plays a role – also for the autumn 2008 ICESat campaign that was completed in December 2008 only due to technical problems (Kääb et al., 2012; Gardner et al., 2013; Treich-ler and Kääb, 2016). Spatially varying vertical biases from DEMs used as reference can considerably increase trend un-certainty (Treichler and Kääb, 2016). All ICESat studies in HMA so far rely on the SRTM DEM, where spatially vary-ing penetration could be a source of such biases.
The present study has two objectives. First, we aim to ex-tend the ICESat-based work of Kääb et al. (2012, 2015) to the entire region of HMA, including the Tibetan Plateau, Qil-ian Shan and Tien Shan, and under special consideration of the issues addressed above and the recent method improve-ments by Treichler and Kääb (2016). In particular, we present a new elevation change zonation into spatial units that con-sider glacier topo-climatic setting, behaviour and type rather than relying on a regular grid or Randolph Glacier Inven-tory (RGI, RGI Consortium, 2017) regions. Second, we in-vestigate the possible cause of the positive glacier volume
D. Treichler et al.: HMA glacier, lake and precipitation changes 2979 changes in the TP and Kunlun Shan regions with the
hy-pothesis of a precipitation increase in this area. For the lat-ter purpose, we quantify the walat-ter volume changes in en-dorheic lakes on the TP, their timing and spatial pattern, and we set them in relation to the independent ICESat-derived glacier surface elevation changes as well as precipitation es-timates from climate reanalyses and sparse in situ measure-ments from meteorological stations.
2 Study region
The HMA glacier region is covered by about 100 000 km2 of glacier area (RGI Consortium, 2017). Temperature rise due to global climate change is especially pronounced on the TP and increasing with elevation (Liu and Chen, 2000; Qin et al., 2009; Ran et al., 2018). Glaciers are found on all large mountain ranges around the TP at > 4000 m a.s.l. but mostly to the south and west, where the steep eleva-tion gradient from the Indian planes acts as a barrier for moisture that is advected by the Indian monsoon (Himalaya, Karakoram, eastern Nyainqêntanglha Shan) and westerlies (Hindu Kush, Karakoram, Pamir Mountains), respectively (Yao et al., 2012; Bolch et al., 2012; Mukhopadhyay and Khan, 2014). On the very dry TP, glaciers occur only on the sparsely spread small mountain ranges.
In interplay with the Siberian High further north (Narama et al., 2010; Böhner, 2006), the westerlies are the domi-nant source of moisture for the mountains surrounding the dry Tarim Basin (at ca. 1000 m a.s.l.) – the Tien Shan to the north and the Kunlun Shan to the south (Ke et al., 2015; Yao et al., 2012). The mountain ranges at the east-ern margins of the TP (Qilian Shan, Hengduan Shan, Minya Gongga) are also influenced by the East Asian Monsoon (Yao et al., 2012; Li et al., 2015). In both the monsoonal and westerly regimes, precipitation decreases northward (Bolch et al., 2012). Depending on the regionally dominant source of moisture, glacier accumulation happens at different times of the year (Bolch et al., 2012; Maussion et al., 2014; Yao et al., 2012; Sakai et al., 2015). From the Eastern Himalaya and southern/eastern TP to the northwest of HMA, there is a transition from predominant spring/summer accumulation to winter accumulation in the Hindu Kush and the western parts of the Tien Shan (Palazzi et al., 2013; Bookhagen and Burbank, 2010; Rasmussen, 2013). Mountains in between, such as the Karakoram and Western Himalaya, receive mois-ture from both sources (Kuhle, 1990; Bolch et al., 2012). The Kunlun Mountains, on the other hand, receive most precipi-tation around May (Maussion et al., 2014).
For the HMA glaciers with predominant spring/summer accumulation, glacier accumulation and ablation happen at the same time. Besides rising temperatures, recent studies suggest that climate change and altered circulation patterns affect radiation regimes and thus also glacier ablation in HMA through, e.g. changes in evapotranspiration or cloud
cover (Forsythe et al., 2017; de Kok et al., 2018). The sea-sonal timing of snow accumulation on glaciers thus likely plays an important role for glacier sensitivity to a warming climate (Fujita, 2008; Mölg et al., 2012; Sakai and Fujita, 2017). Another important factor is total precipitation which depends on continentality (Shi and Liu, 2000; Kuhle, 1990) and, on smaller spatial scale, on glacier location on or behind a mountain range that acts as a primary orographic barrier or causes orographic convection. Wagnon et al. (2013) and Sherpa et al. (2016) found indications of steep horizontal pre-cipitation gradients within only a few kilometres on the out-ermost ridge of the Great Himalayas in the Khumbu region in Nepal. Vertical precipitation gradients at high altitude are still poorly understood. It is suggested that precipitation in-creases from dry mountain valley bottoms to an elevation of 4000–6000 m a.s.l. and subsequently decreases again at even higher elevations (e.g. Immerzeel et al., 2014, 2015).
Many glaciers in HMA are debris-covered in their ablation areas, and the percentage of debris-covered ice varies greatly between different regions (Scherler et al., 2011; Gardelle et al., 2013; Kraaijenbrink et al., 2017, Supplement). Recent studies have found that although debris-covered glaciers in HMA have stable front positions (Scherler et al., 2011), they melt on average just as fast as clean ice glaciers (Kääb et al., 2012; Gardelle et al., 2012b; Pellicciotti et al., 2015). Thus, in this study, we do not explicitly distinguish between debris-covered and debris-free glacier tongues.
3 Data and methods
In this section we give a short overview of the data and meth-ods used. Details can be found in the Appendix.
3.1 Data
For deriving repeat elevations on glaciers and lakes, we use data from the NASA Geoscience Laser Altimeter System (GLAS) aboard the Ice, Cloud and land Elevation Satellite (ICESat) that measured the Earth’s surface elevations in two to three campaigns per year from 2003 to 2009 (Zwally et al., 2012, GLAH14). The campaigns were flown in northern au-tumn (∼ October–November), winter (∼ March) and early summer (∼ June). (Appendix A1).
As the reference DEM for our ICESat processing and to derive lake shoreline elevations, we use the DEM from the Shuttle Radar Topography Mission (SRTM, Farr et al., 2007; Farr and Kobrick, 2000). We used the C-band, non-void-filled SRTM DEM version at 3 arcsec resolution (SRTM3). As an alternative elevation reference, we used also the SRTM DEM at 1 arcsec resolution (SRTM1). (Appendix A2).
As an estimate for regional and temporal precipitation pat-terns for the years 1980–2015 we use data from the reanalysis products MERRA-2 (Gelaro et al., 2017) and ERA-Interim (Dee et al., 2011). We use monthly summarised values of the
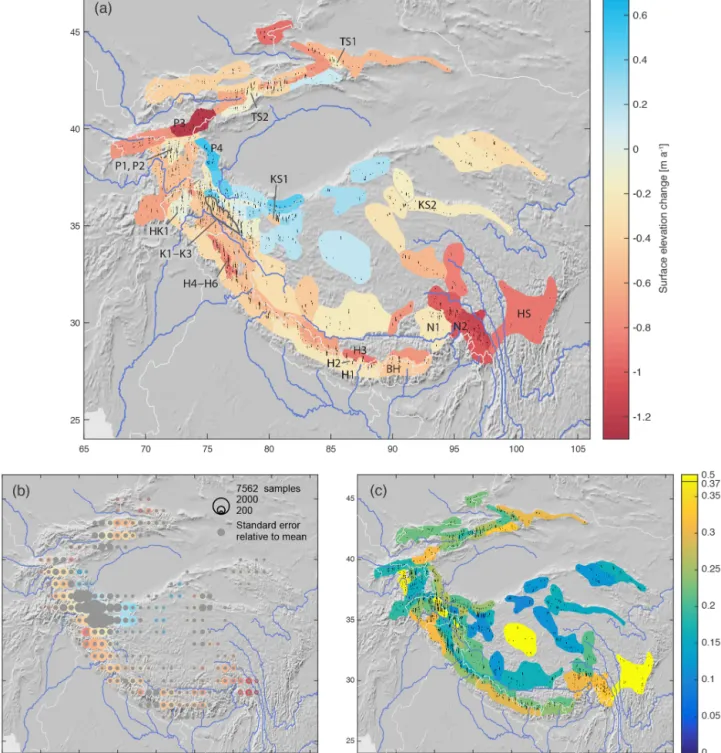
Figure 1. Mountain ranges and major rivers in High Mountain Asia, with meteorological stations (triangles), lakes on the TP and in the Qaidam Basin (dark blue) and ICESat glacier samples (black dots) used in this study. Dark grey squares show all in situ glacier mass balance measurements done at some point during the last decades (WGMS, 2016), and RGI glaciers are coloured according to their mean elevation.
variables total precipitation, snowfall and evaporation. The two chosen reanalysis products have previously been found to model precipitation comparatively well in our study area (Chen et al., 2019; Cuo and Zhang, 2017; Sun et al., 2018). (Appendix A3). We did not use the recently released, higher-resolution ERA5 data since the data assimilation scheme be-hind that product includes less forcing data relevant for mod-elling precipitation at high elevations (above 1500 m a.s.l.) – i.e. the entire region of HMA – compared to the older ERA-Interim (Orsolini et al., 2019).
Further, we use in situ data from the five westernmost me-teorological stations on the TP and Kunlun Shan (Fig. 1), provided by the China Meteorological Science Data Sharing Service Network. The data include daily measurements of precipitation, mean air temperature, and for the four stations on the southwestern TP also evaporation.
We extract repeat lake coverage from the Global Surface Water dataset (Pekel et al., 2016) that is a classification of the entire Landsat archive into monthly and annual maps of surface water. The data are available within Google Earth
Engine. Spatial coverage is nearly complete (> 98 %) start-ing from 2000 but considerably worse for some years of the 1990s (Appendix A4).
3.2 Methods for glacier volume change
We use surface elevation measurements from ICESat data points on glaciers and surrounding stable terrain and follow the double-differencing method explained in further detail in Kääb et al. (2012) and Treichler and Kääb (2016), with special consideration of issues mentioned in the above intro-duction (Appendix B). The difference between ICESat and SRTM elevations is further referred to as dh. Double dif-ferencing, i.e. fitting a linear trend through dh from several years, reveals how much the surface elevation has changed on average over the time period studied. We used only sam-ples from ICESat’s 2003–2008 autumn campaigns, the sea-son with least snow cover in the entire region of HMA, to avoid bias from temporal variations in snow depths (see in-troduction). After filtering, 74 938 glacier samples and about
D. Treichler et al.: HMA glacier, lake and precipitation changes 2981 10 times as many off-glacier samples remain. ICESat data
need to be grouped into spatial units to receive surface el-evation changes. The samples within each spatial unit need to reflect the glaciers in a representative way – which means that the spatial units need to be chosen such that they group glaciers that are similar to each other in terms of climatic and topographical attributes, including their 2003–2008 mass balances and variations thereof. Previous studies have used regular grids, the RGI regions or their own arbitrary zona-tion. These do not necessarily fulfil the above requirements. We considered automated clustering methods to receive spa-tial units from ICESat dh directly but were not successful. We therefore preferred to delineate spatial units manually, con-sidering the topographic and climatic setting, elevation, vi-sual glacier appearance, and input from literature and discus-sions with experts (Appendix B1). In particular, we paid at-tention to orographic barriers. The zonation we present here is thus the result of an iterative manual process of redefining spatial units until they satisfied these criteria. After comput-ing linear regressions on glacier dh, we split or merged some of the previously drawn units such that the final zonation yielded statistically stable and robust glacier surface change estimates. While the procedure is based on carefully applied expert knowledge, we are fully aware that our zonation is eventually a subjective one and certainly open to discussion. As a control approach, we applied the same gridding method as Kääb et al. (2012, 2015) to the entire region of HMA.
It is very important to ensure ICESat’s elevation sampling is consistent through time and representative for glacier hyp-sometry (see introduction). We apply four different ways of correcting hypsometry mismatches of ICESat sampling (Ap-pendix B2). Per spatial unit, we estimate glacier surface ele-vation change by fitting a robust linear regression through in-dividual dh (which minimises an iteratively weighted sum of squares) and also compute a t fit (Treichler and Kääb, 2016) and a non-parametric Theil–Sen linear regression (Theil, 1950; Sen, 1968). Our standard method for the final glacier elevation change estimates corresponds to the average of all hypsometry-correcting methods and linear regression meth-ods. Additionally, we also compute elevation change for only the upper/lower 50 % glacier elevations as from RGI hyp-sometries (samples above/below the median RGI glacier el-evation of each individual glacier) for each spatial unit. The latter analysis violates mass conservation and should thus not be interpreted in terms of mass balance, but rather, for in-stance, for changes in glacier elevation gradients (e.g. Brun et al., 2017; Kääb et al., 2018). To allow comparison with other glacier studies and changes in lake and precipitation water masses, we use RGI glacier areas to convert our surface elevation change rates to volume/mass changes (Sect. S2).
Glacier dh may be subject to vertical bias from elevation differences that are caused by reasons other than glacier sur-face elevation change, i.e. from bias in the local reference elevation (the SRTM DEM) or snowfall. We compute cor-rections for these biases (Appendix B3). Local vertical bias
may result from inconsistent reference DEM age or produc-tion, tiling and tile/scene misregistraproduc-tion, or locally varying radar penetration (in case of the SRTM DEM). To remove this bias, we compute a per-glacier elevation correction cG, corresponding to the median dh for each glacier, according to the method described in Treichler and Kääb (2016). Treich-ler and Kääb (2016, 2017) found that ICESat clearly records the onset of winter snowfall in Norway during the split au-tumn 2008 campaign (stopped half way in mid-October and completed only in December). Analogous to Treichler and Kääb (2016), we estimate December 2008 snow bias from a linear regression of October/December 2008 off-glacier dh on elevation and time.
3.3 Methods for lake volume change
We derive the volume changes of lakes on the endorheic TP in order to relate glacier changes and precipitation changes on the Tibetan Plateau to each other. In particular, we want to investigate whether precipitation increases could be a rea-son for the positive glacier mass balances found in parts of the region. For endorheic lake systems, additional lake wa-ter masses either stem from increased lake inflow (mainly increased precipitation and enhanced glacier melt, possibly also thawing permafrost and changes in groundwater stor-age) or from reduced water loss (mainly changes in evap-oration). This section provides a summary of the methods; details can be found in Appendix C.
We compute annual water volume change of the Tibetan lakes by multiplying annual lake areas with water level changes from repeat water surface elevations for each year over the period 1990–2015. Maximum annual lake extents are obtained directly from the Global Surface Water dataset. We retrieve the corresponding lake surface elevations in two ways: (a) from SRTM DEM elevations of the lake shore by computing the median of interpolated DEM elevations for lake shore cells for each areal extent, and (b) directly from ICESat footprint elevations on the lake areas for those lakes where ICESat data are available. The two datasets used have different strengths: ICESat-derived lake surface elevations are far more accurate but available only for about a tenth of all lakes. To extend the lake elevation time series from method (b) beyond the ICESat period of 2003–2009, we compute the area–surface-elevation relationship for each lake by robust linear regression and apply this function to the areal extents of the years before and after the ICESat period, both for annual time series and individual ICESat campaigns. The so-extrapolated surface elevation values generate complete 1990–2015 time series for both areal extent and lake levels from SRTM and ICESat data, respectively. Our method is in parts similar to the methods used by previous studies (e.g. Zhang et al., 2017), but the inclusion of a DEM for deriving shoreline elevations, and thus lake water levels in addition to altimetry data, enabled us to produce volume change time
series for 1 order of magnitude more lakes (> 1300) than de-rived previously.
To minimise the effect of uncertainties in or erroneous es-timates for individual years, we analyse time series in a sum-marised way through regression over time and as decadal averages, and we apply a range of filters. (Appendix C1). To estimate the lake water volume change in a way that can be related to glacier mass balances and precipitation changes (i.e. mm w.e. per m2), we summarise and spatially distribute the water volume changes of all lakes within spatially con-fined basins aggregated from the endorheic catchments of the USGS HydroSHEDS dataset (Lehner and Döll, 2004) (Ap-pendix C2).
4 Results
4.1 Glacier thinning and thickening
Figure 2a shows the 100 spatial units of glacier surface el-evation change that result from the iterative manual zone delineation process. Spatial units needed to be large on the TP where glacier density is low and could be rather small in the Karakoram, which is intensely glacierised. Along major ridges such as the Himalaya, the units were designed to be narrow and along ridge orientation in order to group glaciers under similar temperature and precipitation regimes rather than across orographic barriers.
Surface elevation change for the new spatial units and the 2◦×2◦grid in Fig. 2b are derived using the standard method except for 34 units with hypsometry mis-sampling or eleva-tion bias (Appendix B). The error values given in Fig. 2c and in the text conservatively include, where applicable, uncer-tainties from off-glacier elevation trends, the deviation from the standard method (greatly increased errors, units showing up in yellow in Fig. 2c) and the December 2008 snowfall correction (Sect. S1 in the Supplement). In areas with snow-rich winters, the latter may contribute up to 40 % of the error budget. In Fig. 2b, the size of the circles corresponds to the number of samples (minimum 200) while the overlaid, grey circles show the trend error (at 1σ ) in relation to the trend slope; i.e. elevation changes are not statistically significantly different from zero where the grey circles fully cover the un-derlying coloured circle.
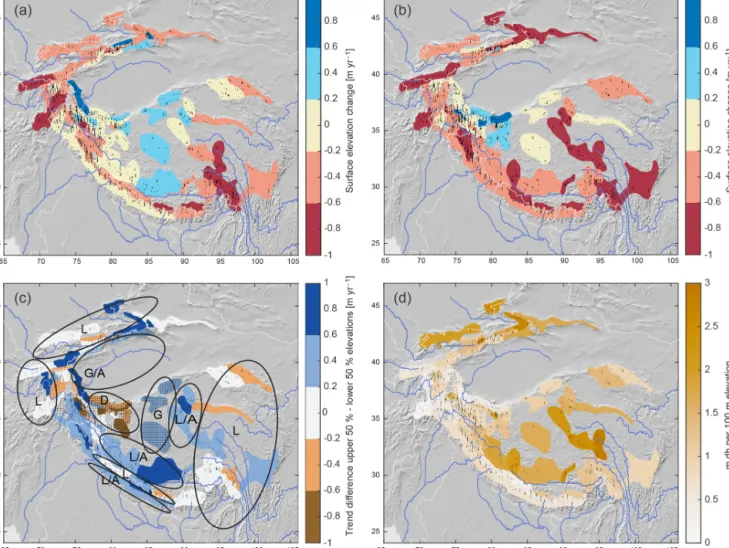
The overall pattern of elevation change is the same for both spatial zonation approaches: positive glacier elevation change in the Kunlun Shan and the inner TP, and spatially varying but modest glacier surface lowering in most ar-eas except for very negative values in the Nyainqêntanglha Shan/Hengduan Shan and parts of the Tien Shan. Most of HMA’s glaciers seem to experience thinning both in their ab-lation and accumuab-lation areas, as shown in Fig. 3a and b (up-per and lower 50 % of glacier area, respectively). Exceptions to these are the areas with positive glacier changes plus parts
of the Himalayas and the mountains surrounding the Tarim Basin, where upper glacier elevations seem relatively stable. While the grid zonation (and also the smaller grid cells of Brun et al., 2017) shows smooth transitions between ar-eas of positive or negative glacier evolution, our zoned map suggests rather greater spatial variability and sharper bound-aries of clusters of similar elevation change. The regular grid size is too small to reach minimum sample numbers in ar-eas with sparse glacier coverage (TP, outer Hengduan Shan, parts of the Tien Shan), and the signal from grid cells with few samples is spatially less consistent than what the man-ually delineated, larger units suggest. The small units in the Karakoram and Kunlun Shan, on the other hand, reveal lo-cally varying signals that are averaged out or not significant in the coarser grid zonation (e.g. units K1–K3 and KS1 in Fig. 2a). Our new zonation, surface elevation changes and corresponding glacier mass changes in Gt a−1 (using RGI glacier areas, Sect. S2) are available as a data Supplement.
In the Himalaya, the manual zone delineation shows a clear transition from moderately negative elevation change on the first, southern orographic ridge (−0.15 to −0.34 m a−1, maximum trend error: 0.31 m a−1) compared to glaciers located further back to the north and on the edge of the TP (−0.33 ± 0.22 to −0.85 ± 0.14 m a−1). This pattern (e.g. units H1, H2, H3) is consistent along the entire range except for the Bhutanese Himalaya, where ICESat’s sam-pling pattern required grouping of several orographic ridges which together show stronger surface lowering (unit BH, −0.40 ± 0.24 m a−1). In the gridded zonation, the pattern be-comes smoothed out and is thus not visible.
Glaciers in the inner Hindu Kush (HK1, 0.03±0.24 m a−1) and the highest regions of the Pamir Mountains (P1 −0.07 ± 0.23, P2 −0.03 ± 0.16 m a−1) were close to balance during 2003–2008, while all surrounding units in the area show stronger glacier surface lowering. Similarly, the glaciers around Lhasa (Goikarla Rigyu, unit N1) lowered their sur-face by only −0.18 ± 0.31 m a−1, which is considerably less than the surrounding units and in particular the very negative values in the eastern Nyainqêntanglha Shan/Hengduan Shan (−0.96 to −1.14 ± 0.33 m a−1).
Further towards the inner TP and in the Qilian Shan, sur-face lowering decreases to −0.1 and to −0.3 ± 0.16 m a−1. In the central and northern parts of the TP and the Kunlun Shan it turns positive – for nearly all units > 0.25 m a−1, to as much as 0.79 ± 0.26 m a−1in the Eastern Pamirs/Kongur Shan (P4). The boundary between positive and negative sur-face elevation change seems to be formed by the Muji basin, upper Gez river and Tashkurgan valley. All units to the north of the central Karakoram range were in balance or thicken-ing. The glaciers of the central Karakoram range and south-west of it showed moderate thinning (−0.22 to −0.47 ± 0.43 m a−1). In the western Kunlun Shan region, surface ele-vation changes of the lower 50 % eleele-vations are more positive than those of the upper 50 % elevations (Fig. 3a and b). This behaviour is visible for 13 units centred around KS1.
D. Treichler et al.: HMA glacier, lake and precipitation changes 2983
Figure 2. The 2003–2008 glacier elevation change rates for (a) manually delineated zones and (b) overlapping 2◦×2◦degree grid cells with 1◦spacing. Colour bar (b) as in (a). Circles in (b) are scaled according to sample numbers. The overlaid grey circles show the standard error in relation to the slope of the linear fit; i.e. elevation change is not significantly different from zero (at 1σ ) where the coloured circles are fully covered. (c) Error for (a) at 1σ , including uncertainties from deviations from the standard method, December 2008 snowfall correction, and trends in off-glacier samples. The four bright yellow units have uncertainties between 0.43 and 0.50 m a−1.
Interestingly, glaciers on the northern edge of the Tarim Basin also seem to be closer to balance (−0.3 ± 0.26 to +0.21 ± 0.33 m a−1) than those in more central or north-ern ridges of the Tien Shan. In the Tien Shan, most spatial units indicate glacier surface lowering between −0.35 and
−0.8 ± 0.25 m a−1, but two units with higher glacier eleva-tions stick out due to their more moderate surface lowering – TS1: −0.1 ± 0.21 m a−1, and TS2: −0.18 ± 0.18 m a−1. Sev-eral other units right next to these have considerably more negative values. At the transition between the Pamir
Moun-tains and Tien Shan (P3), glacier surface elevation decreased by as much as −1.23 ± 0.31 m a−1– despite the thickening signal just south and east of this unit.
4.2 Biasing influences from the dh–elevation gradient and December 2008 snowfall
The dh–elevation gradients are in some units very steep (Fig. 3d). This means that the surface elevation differences between ICESat and the SRTM DEM are very negative on glacier tongues but very small or even strongly positive in the upper accumulation areas. Steep dh–elevation gradients can result from the altitudinal dependency of radar penetra-tion or glacier geometry changes between SRTM and ICESat surface elevation acquisitions. The steeper the dh–elevation gradients are, the stronger the biasing influence from glacier hypsometry mis-sampling is. On the TP and in the northern and eastern ranges of the Tien Shan, the gradients range be-tween 1.5 and 2.5 m per 100 m elevation. Glaciers in these areas typically occur within an elevation range of ca. 1000 m. In the Nyainqêntanglha Shan/Hengduan Shan, western Kun-lun Shan, Karakoram, southwestern Tien Shan and the high-est Pamir Mountains, dh–elevation gradient values are 1– 1.5 m per 100 m elevation. The gradients are moderate (< 1 m per 100 m elevation) in the Himalaya and eastern Kun-lun Shan, lower in the Pamir Mountains and lowest in the Hindu Kush (0.14 m per 100 m). Our method ensures that any bias from inconsistent sampling of glacier elevations for indi-vidual ICESat campaigns is corrected. Neglecting the effect of glacier hypsometry mis-sampling or a trend in sampled glacier elevations would result in considerable bias: on aver-age ±0.13 m a−1but up to > ±0.3 m a−1for three units each in the Tien Shan and Karakoram.
Correcting dh retrieved from the December 2008 cam-paign for the effect of increasing snow cover has an unex-pectedly large influence on glacier surface elevation change rates (Fig. S1c in the Supplement). Elevation changes from corrected dh are on average 0.088 m a−1more negative/less positive. The maximum effect of the December 2008 correc-tion is as much as −0.25 m a−1(in unit N2; for off-glacier samples: −0.11 m a−1 in unit H2), which is a considerable difference given that it is caused by only ca. 10 % of all sam-ples (half of one of six campaigns). The potential biasing ef-fect is in fact greatest in areas where MERRA-2 data suggest snowfall during October, November and December 2008 and where off-glacier samples suggest a positive surface change trend (Sect. S1 in the Supplement). However, in 20 out of 100 units we were not able to compute the potential biasing effect of December 2008 snow cover (e.g. due to lack of off-glacier samples). To ensure a consistent approach, we therefore did not apply this correction to the results presented above but instead added the difference due to bias correction to the er-ror budget (Fig. 2c). The corrected glacier surface elevation change rates are included in the data Supplement. A
discus-sion of the effect of this and other corrections and biasing influences is provided in Appendix D.
4.3 Lake changes on the TP
We receive valid (according to our filter procedures) water volume change time series for 89 % of the median lake area (74 % of all endorheic lakes) on the TP: 1009 lakes with SRTM-based lake surface elevations, of which 103 also have ICESat-based lake surface elevations (59 % of the lake area). Extrapolated lake levels based on annual or campaign ICE-Sat data (Appendix C) yield the same results, but ICEICE-Sat- ICESat-based lake level change is on average 1.55 times larger than SRTM-based values. The reason for this difference is likely the greater uncertainty of SRTM DEM elevations and pre-2000 SRTM lake levels (Appendix C1). Multiplied with areal changes to receive volume changes, the relative difference is reduced to 1.09 times. The average 1990–2015 water level increase corresponds to 0.14 m a−1(SRTM) and 0.18 m a−1 (ICESat) in lake-level change per year (Fig. 4a, robust linear regression of dV). All except a handful of lakes predomi-nantly in the very south of the TP grew during the studied time period, and growth of individual lakes is largest in the northern and eastern part of the TP. Figure 5 shows relative lake volume growth (based on SRTM lake levels) for indi-vidual lakes and regional medians over time for six regions: the southwestern (SW), eastern (E), central (C), northeastern (NE), and northwestern (NW) TP and Qaidam Basin/Qilian Shan (QQ), indicated in Fig. 4a. (Note that Fig. 5 shows the timing of the volume change and not changes in abso-lute lake volumes; these are unknown.) Rather than grow-ing steadily, most lakes seem to have undergone a phase of sudden and rapid growth starting between 1995 and 2000 and gradually slowing down until ∼ 2009, with rather stable conditions before and after this period. (Note that lake time series are median-filtered due to data scarcity for the years 1995–1999. There is thus some uncertainty on the exact tim-ing of the onset of lake growth.) Relative lake volume change was most sudden and rapid for the northeastern, northwest-ern, central and eastern TP (the former three corresponding to areas with 2003–2008 glacier thickening). Lakes in the southern and southwestern part of the TP showed more vary-ing and overall less growth, with a tendency to decrease after 2010. Endorheic lakes in the Qaidam Basin/Qilian Shan re-gion further northeast also show a different and more varying evolution with slower growth that started only around 2004 but continued until ∼ 2012. The latter effect is also visible for the adjacent lakes on the northeastern TP (eastern Kun-lun Shan).
Figure 4b shows the corresponding specific water vol-ume change per endorheic catchment as the decadal differ-ence between 1990–1999 and 2000–2009 average lake vol-umes (based on SRTM lake levels). In other words, the fig-ure shows the accumulated additional water volumes evenly spread across the entire catchment areas. The pattern of
pre-D. Treichler et al.: HMA glacier, lake and precipitation changes 2985
Figure 3. Glacier accumulation and ablation areas indicate regionally different, distinct glacier evolution: glacier surface elevation change for the (a) upper 50 % and (b) lower 50 % of glacier hypsometry, and (c) the difference between the two (upper minus lower). Shaded regions denote areas with overall thickening; L denotes thickness loss on the entire glacier, G denotes thickness gain, A denotes adjustment of glacier geometry with thinning ablation areas, D denotes dynamic adjustment of glacier geometry with thickening ablation areas. (d) Gradients of dh (ICESat–SRTM surface elevation) with elevation. Steep dh–elevation gradients may be caused by high SRTM penetration depths in dry, cold accumulation areas and/or from glaciers adjusting their geometry.
dominant water volume increase especially in the northern and eastern TP compares well to the results in Fig. 4a. Lake volume growth on the eastern TP is accentuated due to con-siderably larger lake areas and lake density compared to the mostly small lakes further north/west. Table 1 shows the ad-ditional water volumes accumulated between the 2 decades as in Fig. 4a for the same regions as above (corresponding mass changes in gigatonnes are provided in Sect. S2). To yield values comparable to precipitation changes, the reader has to divide the total decadal differences dV given in the table by the number of years during which the additional wa-ter was accumulated. Assuming the change happened rather gradually during the entire decade, the specific annual water change would correspond to 1/10 of the values in Table 1. For instance, water volumes using SRTM-based lake levels are 25 ± 3 mm a−1 for the eastern TP, 4 ± 1 mm a−1for the
southwestern TP, 6–7 ± 1 mm a−1for the central and north-ern TP, and 0.1 ± 0.5 mm a−1for the Qaidam Basin/Qilian Shan region. Notably, there are considerable differences be-tween catchments within each region (range for SRTM-based estimates: −5 ± 1 to +35 ± 6 mm a−1, excluding one out-lier of 163 ± 7 mm a−1for the catchment centred at 34.3◦N, 88.8◦E). The estimates based on SRTM and ICESat lake lev-els aggregated for the six regions nevertheless agree very closely. The above annual values have to be doubled, or the dV values given in the table multiplied by 1/5, for instance, if one prefers to assume that the water volume increase hap-pened during 5 years only, with stable conditions before and after – an assumption which also is plausible from Fig. 5.
Figure 4. Lake volume changes on the Tibetan Plateau. (a) Normalised 1990–2015 lake volume change for individual lakes. Colours show the average annual 1990–2015 lake level change in metres (volume changes, dV, divided by median lake areas to receive comparable values for lakes of different sizes). Circle areas are scaled relative to lake areas. (b) Specific water change per endorheic catchment for the decadal difference between 1990–1999 and 2000–2009 lake volumes. Values correspond to the sum of individual lake water volume changes (average changes assumed for lakes with missing data) divided by catchment area to make their units comparable to precipitation sums. Red lake outlines: lacking plausible data; purple lake outlines: lakes excluded due to human influence on lake levels/extent. Squares: meteorological stations. Labelled regions with black outlines are referred to in the text.
4.4 Precipitation increase on the TP
A change in precipitation could explain both lake growth and glacier mass balance (if dominated by precipitation rather than temperature/melt). When subtracting the part that is lost through evaporation, the precipitation change should yield numbers that are directly scalable in relation to glacier mass balance and endorheic catchment water volume (when ne-glecting changes in subsurface water transport).
Annual precipitation sums on the TP from meteorological stations range from as little as 50–100 mm a−1 (Shiquanhe
and Tashkurgan stations, southwestern TP and western Kun-lun Shan) to 500–900 mm a−1(Nielaer station, southern TP). Reanalysis values of both products used, MERRA-2 and ERA-Interim, lie in between. All datasets record the major-ity of precipitation (> 70 %) during the monsoon-influenced summer months (May–September), except for Pulan and Nielaer, the two southernmost stations close to the Himalaya (only ca. 50 % precipitation in summer). On the data-sparse TP, both station data and reanalysis products may contain bias due to the stations not being representative for a larger
D. Treichler et al.: HMA glacier, lake and precipitation changes 2987
Figure 5. Relative lake volume change for individual lakes on the Tibetan Plateau, coloured by region. Volume changes (dV) are normalised by the 1990–2015 mean dV for comparability; annual values are median-filtered (7 years window size). Thick lines indicate the median for each region. The regions northeast, northwest and central correspond to areas with observed 2003–2008 glacier thickening.
Figure 6. Annual precipitation (P , blue line), pan evaporation (pan E, red line) and summer precipitation (dotted lines) for five stations on the southern and western TP (Fig. 4b).
Figure 7. Time series for (a) ERA-Interim and (b) MERRA-2 of annual total precipitation (P ), evaporation (E), the difference between the two (P − E), summer precipitation (Ps, May–Sept) and their respective decadal averages, for reanalysis grid points within the six lake
change regions on the TP: southwestern (SW), eastern (E), central (C), northwestern (NW), northeastern (NE) TP and Qaidam Basin/Qilian Shan (QQ).
Table 1. Precipitation/lake water volume changes between decadal averages of the 1990s and the 2000s per basin region (dP and dV), and annual glacier mass balance of adjacent glacierised areas for 2003–2008 (last column). dV: total decadal lake water volume difference in millimetres per square metre (mm m−2), dP: annual precipitation difference in millimetres per quare metre per year (mm m−2a−1), station order in the southwestern TP: Shiquanhe, Gaize, Pulan, Nielaer. Glacier surface elevation changes are converted to mm w.eq. a−1assuming a density of 850 kg m−3.
Region dV SRTM dV ICESat dP MERRA-2 dP ERA-Interim dP stations Glacier mass balance Southwestern TP 39 ± 11 59 ± 16 81 ± 33 15 ± 31 −1 ± 14, 42 ± 17, −33 ± 11 to −10 ± 14 19 ± 16, 60 ± 50 Eastern TP 252±33 275 ± 37 100 ± 18 30 ± 14 −17 ± 10 to −8 ± 14 Central TP 69 ± 10 71 ± 11 56 ± 5 25 ± 8 21 ± 38 Northwestern TP 62 ± 14 70 ± 15 34 ± 11 −33 ± 11 16 ± 72 29 ± 10 to 31 ± 9 Northeastern TP 60 ± 12 54 ± 9 85 ± 13 −2 ± 22 13 ± 11 to 50 ± 21 Qaidam/Qilian 1 ± 5 1 ± 4 87 ± 14 24 ± 17 −25 ± 14 to −13 ± 10
area and the lack of observational forcing data for reanal-ysis products, respectively. We thus use the data in a sum-marised way and focus on relative changes rather than rely-ing on absolute numbers to detect/confirm temporal changes and large-scale spatial patterns.
Of the five meteorological stations available, Shiquanhe and Pulan in particular show little change in precipitation and pan evaporation (Fig. 6). The Gaize station, located most centrally on the TP but still more south than our correspond-ing glacier unit, indicates a stepwise precipitation increase around the year 2000, but data from only one station need
D. Treichler et al.: HMA glacier, lake and precipitation changes 2989
Figure 8. Difference between decadal averages of (a) ERA-Interim and (b) MERRA-2 summer precipitation (May–September) in 2000– 2009 and 1990–1999. MERRA-2 suggests a considerable increase on the TP and in the Kunlun Shan, compared to a negligible increase on the TP and decreasing precipitation in the Kunlun Shan for ERA-Interim.
to be interpreted with care due to potential local effects and changes to the station. A more gradual increase is visible in the Tashkurgan data. Differences in decadal average pre-cipitation range from −1 (Shiqanhe) to +60 mm (Nielaer) within 10 years, notably with the greatest relative change for the Gaize station (+42 mm per decade, a 25 % increase) and Tashkurgan station (+16 mm or +22 % per decade). Decadal differences are mostly (Nielaer, Tashkurgan) or exclusively (other stations) caused by an increase in precipitation during summer months. Pan evaporation reaches 2-fold to 10-fold the precipitation sums.
The two reanalyses used here differ considerably both in precipitation evolution and in estimated evaporation (Fig. 7), and also the spatial patterns of precipitation changes differ (Fig. 8). Figure 7a (ERA-Interim) and 7b (MERRA-2) show regional averaged annual sums for total precipitation, evap-oration and the difference between the two, for grid points within the TP lake catchment regions defined above. Notably, ERA-Interim suggests considerably higher evaporation val-ues than MERRA-2, in particular for the southwestern TP (SW) and the three northern regions (NE, NW, QQ), result-ing in much lower suggested net water availability in the areas where we see glacier thickening than is the case for MERRA-2. Both reanalyses show an increase in precipita-tion starting from ca. 1995, but for ERA-Interim, the evolu-tion only lasts until ca. 2000, after which precipitaevolu-tion sums decrease. Also, the short-term precipitation increase is not visible for the northern parts of the TP. Figure 8a shows the spatial distribution of the decadal difference between average summer precipitation in 1990–1999 vs. 2000–2009. ERA-Interim data suggest only a marginal precipitation increase on the TP and a considerable decrease in decadal average precipitation for the Kunlun Shan area (−33 ± 11 mm for the northwestern TP, Table 1).
MERRA-2, on the other hand, instead suggests a stepwise precipitation increase (Fig. 7b) with continuously higher
pre-cipitation sums until ca. 2010 for the entire TP, and even a continuous increase through 2015 for the northern part of the TP. For all six regions, this results in a total increase in precipitation of 34 ± 11 mm (northwestern TP, Table 1) to 100 ± 18 mm (eastern TP) within 10 years. Except for the Qilian Shan region, the change is exclusively driven by in-creasing summer precipitation. Winter precipitation did not change noticeably (−9 to −2 mm decadal change for the five TP regions, +8 mm for the Qilian Shan). Figure 8b shows the spatial distribution of summer precipitation change (dif-ference between decadal averages). Compared to the same map with ERA-Interim data, MERRA-2 suggests a consider-ably stronger precipitation increase on the TP and increasing precipitation also in the Kunlun Shan area. For both reanaly-ses, the spatial patterns are the same for annual precipitation rather than summer precipitation only (not shown).
The two reanalysis products agree somewhat better when precipitation numbers are corrected with estimates of ac-tual evaporation to assess the total decadal increase in wa-ter availability. For MERRA-2, the decadal difference is then reduced to 6 ± 11 mm (central TP) and to 68 ± 13 mm (north-eastern TP). However, the evaporation-corrected increase is greater when looking at summer months only (31 ± 7 to 77 ± 11 mm per decade, compared to a decrease in water availability during winter months of −27 ± 4 to −6 ± 3 mm, not shown). The corresponding ERA-Interim increase in an-nual water availability is 14 ± 32 to 38 ± 12 mm (summer: −19 ± 11 mm in the Kunlun area to 38 ± 13 mm, winter: −16 ± 6 to 5 ± 4 mm). Both datasets suggest that 30 %–60 % (MERRA-2) or 13 %–50 % (ERA-Interim) of precipitation on the TP falls as snow during the summer months and that the proportion of snowfall did not change noticeably between the decades (not shown).
The regions where MERRA-2 indicates increased summer precipitation correspond well with those areas on the TP and in the eastern Kunlun Shan with moderately negative to
pos-itive surface elevation change and/or endorheic lake growth. ERA-Interim data indicate a similar pattern, but the lower (TP) precipitation increase and, particularly, the decrease for the Kunlun Shan region (Fig. 8a) do not fit well with the re-sults from our lake and glacier data.
Our above results on precipitation changes relate to decadal means in order to enable systematic comparison to other data. It is however important to note that these results vary if other time periods are chosen for aggregation. Kääb et al. (2018), for instance, summarise total annual precipi-tation amounts estimated from ERA-Interim reanalysis over the Aru region, northwestern TP, over 1979–1995 and 1995– 2008 to suggest a 33 % increase between the periods.
5 Discussion
The 2003–2008 ICESat surface elevation changes paint a spatially diverse picture of glacier changes in HMA. The general pattern – glacier volume gain in the Kunlun Shan and the inner TP and glacier volume loss elsewhere – appears ro-bust, regardless of whether we aggregate the samples in a regular grid or manually delineated units. The more distinct spatial pattern agrees with the ICESat studies of Kääb et al. (2012, 2015), the ASTER-based geodetic mass balances of Brun et al. (2017) and with the overall picture drawn by the previous regional studies of Neckel et al. (2014), Gardner et al. (2013) and Farinotti et al. (2015) based on data from ICESat, GRACE and modelling. The pattern found is also robust against small changes in reference elevations (such as from using the 1 arcsec SRTM DEM) or sample composi-tion, and it can also be reproduced using the most recent RGI glacier outlines – which have clearly become much more ac-curate since the study of Gardner et al. (2013).
On a local scale, and in contrast to the above regional view, there are considerable differences to previous findings in glacier changes, including the ones based on the same ICE-Sat data. Compared to a visualisation of our results in a regu-lar grid, we find that spatial aggregation matters: even within our study, only the manual zonation brings forward finer spa-tial differences, e.g. from the topographic–orographic set-ting. Our results also suggest that inconsistent sampling hyp-sometry, snow cover, and local vertical biases and elevation inconsistencies can have a severe biasing effect on ICESat-based glacier changes when not accounted for properly – in particular where they vary for different ICESat campaigns. A method discussion, in particular on biasing influences on ICESat glacier surface elevation change rates, is provided in Appendix D.
5.1 Coincident lake growth and glacier thickening The regions with glacier thickening, or thickening of upper glacier areas (Fig. 3a), spatially match the areas with growing endorheic lakes on the TP and where MERRA-2 data
sug-gest a stepwise increase in summer precipitation around the year 2000. The changes in available precipitation amounts, lake water volume, and glacier mass balances are of the same magnitude and match well in terms of timing. Stud-ies analysing individual lake time serStud-ies suggest the increase started closer to the year 2000 (Lei et al., 2013; Zhang et al., 2017, 2018; Song et al., 2015) than our Fig. 5 suggests. This could be due to the application of a median filter which con-tributes to shifting the onset of volume change in the middle of a period with large Landsat data gaps (1996, 1997; see Appendix A4). The recent growth of the TP’s lakes is estab-lished by numerous recent studies (e.g. Zhang et al., 2011, 2013; Song et al., 2015; Zhang et al., 2017). In this study, lake volume changes on the TP serve as proxies for precip-itation changes, but they may also help in resolving satellite gravimetric signals to compute glacier mass changes (see in-troduction). The fact that glacier volumes are increasing in regions where also lake volumes increase and the fact that lake volumes are also increasing in little or not glacierised basins both suggest that the increases in lake volumes over the study region are not mainly driven by increased water influx from glacier mass loss (see e.g. Song et al., 2015).
However, glacier mass loss can certainly play an additional role for lakes with declining glaciers in their catchment. This is in line with, and extends geographically, water balance modelling by Lei et al. (2013) for six selected lakes in our eastern TP zone (Fig. 4b), which suggests that mainly pre-cipitation increases are behind the increases in lake volumes, accompanied by decreases in potential evaporation due to de-creasing wind speed and to a lesser extent increases in glacier runoff (Song et al., 2015). Evaporation may also have de-creased due to inde-creased humidity from higher precipitation amounts. For 1981–2013, Zhang et al. (2018) find a signif-icant decrease in pan evaporation from meteorological sta-tions on the eastern TP (these are however further east than the endorheic lakes). For the Siling Co lake in our eastern TP region, potential evaporation showed stable conditions or a slight increase between the middle and end of the 1990s to 2010, although it was decreasing overall over 1961–2010 (Guo et al., 2019), underlining the key role of precipitation increases for the observed lake volume increase. The reanal-ysis products used in this study do not show a coherent sig-nal for evaporation. They suggest relatively stable (ERA-Interim) or increasing (MERRA-2) evaporation in the south-ern three regions of the TP and decreasing (ERA-Interim) or roughly stable (MERRA-2) evaporation for the two regions in the north. It is noteworthy that correcting precipitation data with evaporation allows us to somewhat reconcile the two re-analysis datasets: also ERA-Interim shows an increase in so-computed net water availability, although it is smaller than for MERRA-2.
Lei et al. (2013) suggest that groundwater exchange be-tween different basins has very limited influence on the wa-ter balance of each lake due to the impermeability of sur-rounding permafrost. Such groundwater exchange does not
D. Treichler et al.: HMA glacier, lake and precipitation changes 2991 affect the basin-wide water volume changes of this study, but
thawing permafrost could be another potential source of wa-ter. An increase in active layer depth also causes an increase in groundwater storage capacity in ice-free ground and may change the amount of precipitation or water from snowmelt that is retained or released (Sebastian Westermann, personal communication, 2019). However, we are not aware of stud-ies that quantify the amount of water available from these processes. Modelling studies (Ran et al., 2018; Zou et al., 2017) find continuous permafrost in the northern part of the TP (our regions NW, NE, C and most of E) and discontinuous permafrost including larger areas of non-frozen ground in the southern/eastern parts of the TP (our regions SW and most of QQ). Recent and ongoing temperature rise led to an increase in the active layer and degrading permafrost that seems to have been greatest during the 1960s and 2000s as well as in the southern and eastern parts of the TP (Ran et al., 2018), where we find little lake change (SW) and strong lake growth (E), respectively.
5.2 Precipitation increase on the TP and glacier sensitivity to these changes
In particular, the MERRA-2 reanalysis and to a lesser degree also ERA-Interim and station data suggest precipitation on the TP has increased around 1995–2000. The spatial patterns of decadal precipitation increases and the glacier growth on the TP and in the Kunlun Shan suggest a causal relationship. Increased precipitation in the region has been noted before: Yao et al. (2012) attributed a pattern of precipitation/glacier changes to a strengthening of the westerlies while the In-dian monsoon is weakening. A rise in extreme precipita-tion events at staprecipita-tions in the study region was attributed to a weakening East Asian monsoon (Sun and Zhang, 2017). Fu-jita and Nuimura (2011) and Sakai and FuFu-jita (2017) model a decrease in theoretical equilibrium line altitudes (ELAs) in western Tibet between 1988 and 2007, and they attribute these trends to increasing precipitation in western Tibet (but decreasing precipitation in the Western Pamirs and the West-ern Himalaya). Glaciers in the westWest-ern Kunlun Shan were in general shrinking between 1970 and 2001, and only those on the south slope were already growing between 1991 and 2001 (Shangguan et al., 2007).
While the reanalysis data does not suggest an increase in summer precipitation in the Eastern Pamirs and on the west-ern and northwest-ern boundary of the Tarim Basin, Tao et al. (2011, 2014) found indications for a wetter climate and in-creasing streamflow in the entire basin. Shi et al. (2007) sug-gest that a shift from a warm-dry to a warm-wet climate in the entire northwest of China happened already around 1987. Our results indicate that glaciers on the southernmost orographic barrier in the Tien Shan are closer to balance than glaciers further north/west. We thus speculate that the change in circulation patterns behind the positive precipi-tation change, centred further south, extends across the
en-tire Tarim Basin and with it more favourable conditions for glaciers on the edge of the entire basin.
The lack of meteorological observations on large parts of HMA results in substantial uncertainties with recent precip-itation changes on the TP (Kang et al., 2010) and available gridded precipitation datasets (Sun et al., 2018; Smith and Bookhagen, 2018). While they are also affected by the lack of direct observations, reanalysis products are an important source of physically based model data in such data-sparse regions (Cuo and Zhang, 2017). Orsolini et al. (2019) find that MERRA-2 does not model snow depth or snow cover fraction well on the TP but still best matches total precip-itation amounts on the TP compared to ERA-Interim and other reanalysis products which overestimate precipitation compared to reference data. Assimilation of snow observa-tions and a better parameterisation of snow-related physical processes are thus needed to improve model performance for the often thin and short-lived snow cover and should improve future reanalysis products on the TP (Orsolini et al., 2019). Given the importance of evaporation in this dry region and how much the two analysed reanalysis products differ in this regard, it seems that evaporation could also be better repre-sented in the models. Improved spatial resolution should con-tribute to better model high-altitude precipitation due to the importance of spatial resolution to capture orographic pro-cesses. Examples are the High Asia Reanalysis (HAR; avail-able for most of HMA but unfortunately a time span of 10 years only; Maussion et al., 2014) or the upcoming ERA5-Land reanalysis, which is more suitable for mountainous ar-eas than ERA5 (Orsolini et al., 2019).
Maussion et al. (2014) proposed a new classification for HMA glaciers based on their main accumulation season from 2000–2011 HAR precipitation data. Our pattern of positive glacier changes matches very well with their classification of the predominant glacier accumulation season as spring or early summer. On the TP, Maussion et al. (2014) find a gradual transition towards later accumulation (monsoon-dominated), whereas there is a crisp boundary to winter accu-mulation in the Karakoram/Pamir Mountains. Both patterns correspond to the zonal boundary of “extreme continental (polar) glaciers” suggested by Shi and Liu (2000), which en-compasses the northwestern half of the TP, glaciers north of central Karakoram, the easternmost Pamir Mountains and the entire Kunlun Shan. On a coarser spatial and longer temporal scale, Kapnick et al. (2014) suggest that glacier accumulation in the Karakoram is least sensitive to atmospheric warming due to dominating non-monsoonal winter precipitation in this region.
Forsythe et al. (2017) attribute summer cooling in the Karakoram since the 1960s to a southerly shift of a circu-lation system that they named the Karakoram vortex. In the Karakoram area the southerly shift leads to increased pas-sage of westerly depressions and corresponding cooler tem-peratures due to increased cloud cover and decreased insola-tion. The effect of this may extend to the areas to the north,
namely the Kunlun Shan, Pamir Mountains, Tien Shan and Tarim Basin (see their Fig. 2b). de Kok et al. (2018) model the effect of increased irrigation intensity in the lowlands of HMA and find that they may cause increased summer snow-fall and a decrease in net radiance in the Kunlun Shan and parts of the Pamir Mountains and northern Tibet.
Fujita (2008) finds that HMA’s glaciers are more af-fected by precipitation seasonality and concentration than by changes in annual precipitation. Where accumulation and warming happen at the same time (i.e. summer), rising tem-peratures increase both melt and the share of precipitation that falls as rain instead of snow. While temperatures are rising in the entire region of HMA, the glacier sensitivity study of Fujita and Nuimura (2011) suggests that tempera-ture was not the limiting factor for glacier existence every-where. In the extremely dry and cold TP and Kunlun Shan, with glaciers and in particular their accumulation areas at high elevations (Fig. 1), glacier growth due to increased pre-cipitation is thus entirely plausible – despite a warming trend. This also stresses that the elevation of HMA glaciers (Fig. 1) is an important factor in their respective responses to temper-ature and precipitation changes (Sakai and Fujita, 2017), and thus in the here-observed glacier volume changes.
5.3 Glacier geometry changes on the TP
In light of continued climatic changes and rising tempera-tures in the study region, ICESat only provides a short snap-shot of ongoing glacier reactions. This snapsnap-shot falls exactly into the decade where an increase in precipitation on the TP around the year 2000 would cause the largest effects on glacier volume changes: with some delay, glaciers dynami-cally change the geometry of their ablation areas (which are thickening) to adjust to a new glacier equilibrium state (Kääb et al., 2018; Gilbert et al., 2018). Ke et al. (2015) and Bao et al. (2015) report such a stronger surface elevation gain for ablation areas compared to elevation gains in accumulation areas in what they refer to as the western Kunlun Shan (our unit KS1, plus four to the north and east of it). As is visi-ble in Fig. 3c, we find the same signal for a larger area of an additional eight adjacent units, including those to the south (area marked “D”). Care has to be taken when analysing el-evation changes over only parts of a glacier as this violates the condition of mass continuity. Thickening of the ablation parts of a glacier can be caused by either positive surface mass balance or dynamical changes (i.e. increased ice flux). In the case of the western Kunlun Shan, a stronger thicken-ing of the tongues compared to upper glacier areas could in-dicate that both were happening: a general glacier thickening from ongoing positive mass balances plus a delayed dynam-ical thickening from earlier mass gain in the accumulation areas.
The rate of warming on the TP is greatest for the elevations where glaciers have their ablation areas (Yao et al., 2012; Ran et al., 2018). In the southeastern part of the TP, dh–elevation
gradients are largest (darker units in Fig. 3d), which could indicate that dynamical changes are happening also there: an overall thinning signal could be composed of increased melt at lower elevations, causing strongly negative dh, while the accumulation areas are thickening or stable due to increased precipitation/accumulation, causing stable surface elevations or positive dh. This interpretation is supported by the grad-ual transition visible in Fig. 3c: in the eastern Kunlun Shan and central TP, we see a thickening of accumulation areas and no change on the tongues (area marked “G”), and further east/south accumulation areas experienced little change but tongues were thinning (marked “L/A”).
Dynamic glacier geometry adjustments might also be re-flected in glacier flow. Dehecq et al. (2019) found that for the 2000–2016 period, the flow speed of HMA glacier tongues decreased everywhere but in the Kunlun Shan and Karako-ram and only slightly decreased on the TP. While the differ-ent time periods and spatial aggregation do not allow a more detailed comparison, their results confirm that these regions were either not affected or less affected by rapid glacier mass loss with thinning and increasingly inactive tongues. 5.4 Glacier thinning on the eastern Tibetan Plateau The negative elevation change rates on the eastern border of the TP agree with the reported glacier mass loss in this area, although varying annually and in space (Kang et al., 2009; Yao et al., 2012). For this part of the southeastern TP, Mölg et al. (2014) found that the competition between the monsoon and large-scale westerly waves of the mid-latitude circulation in spring/early summer determines annual mass balance. The south–north transition of the jet stream across the TP in spring varies in timing and efficiency, and its re-intensification in summer on the northern edge of the TP is related to the onset of the summer monsoon (Schiemann et al., 2009). This interplay affects both precipitation and summer air temperature. All glaciers in the region are of summer accumulation type, except for the East Nyainqên-tanglha Shan and Hengduan Shan (Maussion et al., 2014). The area where the atmospheric flow strength over the TP correlates strongly with summer temperatures (Mölg et al., 2014) forms an arc-shaped band from the above-mentioned mountain ranges along the northern slopes of the East Nyain-qêntanglha Shan to the easternmost glacierised mountains in the area. The correlation of the monsoon/westerlies competi-tion with temperature is decreasing rapidly north towards the easternmost Kunlun Shan and south to the Goikarla Rigyu range just north of the Yarlung Tsangpo valley. This pat-tern corresponds well with our findings of only slight glacier thinning in the Goikarla Rigyu/eastern Kunlun Shan (units N1 and KS2) but more negative volume changes in the east-ernmost HMA glaciers (our unit HS). Reconstructed mass balances from six glaciers on the eastern slope of Minya Gongga (in the very east of unit HS) were −0.79 m w.e. a−1 in 2001–2009, a notable further decrease from an already
D. Treichler et al.: HMA glacier, lake and precipitation changes 2993 negative average of −0.35 m w.e. a−1in 1952–2000 (Zhang
et al., 2012). Converted to mass loss, our results in this area are −0.75 ± 0.43 m w.e. a−1– the large uncertainty reflects the sparse glacier coverage and low sample numbers in this unit. Zhang et al. (2012) report that both the ELA and tem-peratures in the beginning and end of the melt season were strongly rising during the ICESat decade.
Glaciers in the Qilian Shan in the very northeast of the TP have been shrinking less than those further south in the last decades (Tian et al., 2014). In situ mass balances on the Qiyi Glacier were strongly negative in 2005–2006 (−0.95 m w.e. a−1) but less so in 2006–2007 (−0.3 m w.e. a−1). The 2006 negative mass balance is indeed visible as a marked decrease between ICESat’s 2005 and 2006 autumn campaign median dh in all our units north of the Nyainqêntanglha Shan (not shown). We find only mod-erate thinning in the eastern part of the Qilian Shan (con-verted to mass changes: −0.26 ± 0.14 m w.e. a−1), where the Qiyi Glacier lies, and even less negative values further west (−0.14 ± 0.10 m w.e. a−1), in line with Tian et al. (2014). Towards the east, glaciers become smaller and elevations lower, and the influence of the East Asian Monsoon becomes stronger.
5.5 Glacier mass balance and precipitation in the Himalayas
We find consistently less severe glacier thinning on the first orographic ridge across the entire Himalayan Range. Mis-classifications of for example perennial snow patches with stable surface elevations classified as glaciers would cause a mixed glacier/land trend with a weaker surface lowering sig-nal. To achieve this effect, the misclassification would have to be severe (ca. half of the samples) and be present in both our manual classification and the RGI, as the pattern is vis-ible with both glacier classifications. We carefully classify our samples manually to avoid precisely such mixed signals; thus we consider this bias unlikely. Another cause could be reduced melt due to insulation from debris cover. It has pre-viously been shown that stagnant (debris-covered) tongues lose mass at a similar rate as clean ice glaciers (Kääb et al., 2012; Gardelle et al., 2012b; Pellicciotti et al., 2015; Raget-tli et al., 2016). We thus assume that debris cover is not the cause of the observed differences.
A potential explanation for the less negative mass bal-ances on the first, and thus wettest, orographic ridge in the Himalaya is a locally lower sensitivity of glacier mass bal-ances to precipitation (and changes thereof). Precipitation from summer monsoon influx decreases sharply after large changes in relief (Bookhagen and Burbank, 2006). Maussion et al. (2014) find that precipitation regimes are strongly vary-ing over short distances in the Himalaya, not least due to glacier orientation on the windward or leeward side of the a mountain range. Wagnon et al. (2013) and Sherpa et al. (2016) mention the meteorologically exposed location of the
Mera Glacier (4949–6420 m a.s.l.) in the Khumbu region, Nepal, as a possible explanation of its roughly stable mass balance since 2007 when in situ measurements began. This stands in stark contrast to the considerable mass loss seen in the Pokalde and Changri Nup glaciers only 30 km further north (the latter are also smaller and located at lower and thus warmer elevations, which likely contributes to these differ-ences). In our ICESat zonation, these glaciers are located in units H1 (−0.12±0.25 m a−1) and H2 (−0.50±0.32 m a−1). Wagnon et al. (2013) note that, in the DEM differencing study of Gardelle et al. (2013), larger glaciers in the same range as Pokalde/Changri Nup also seem to experience more surface lowering than the Mera Glacier further south. Our consistently less negative glacier volume changes of the first orographic ridge across the entire Himalayan Range sup-port the interpretation of Wagnon et al. (2013) and Sherpa et al. (2016) and suggest the effect is visible along the entire Himalayan Range. However, the 2004–2008 average annual mass balances of the well-studied Chorabari and Chhota Shi-gri glaciers in Western Himalaya do not follow this pattern. The south-facing Chorobari lies on the outermost orographic ridge and lost mass at a rate of −0.73 m w.e. a−1 (Dob-hal et al., 2013), which is comparable to the north-facing Chhota Shigri’s balance of −0.9 m w.e. a−1 (Ramanathan, 2011). Both glaciers lie at comparable elevations (ca. 4000– 6400 m a.s.l.).
The ELA sensitivity study of Fujita and Nuimura (2011) is too coarse to confirm orography-related spatial differences across the Himalaya, but along the mountain ridge their find-ings correlate well with both Yao et al. (2012) and our pat-tern of glacier changes in the inner Himalayan ranges (see also Sakai and Fujita, 2017). In particular the stable glacier elevations in our unit HK1 – between areas of glacier loss in the Hindu Kush and the particularly negative Western Hi-malaya (units H4–H6) – are backed up by their modelled stable ELAs. According to MERRA-2 data (but not ERA-Interim), the area experienced an increase in summer precip-itation between the 1990s and 2000s (Fig. 8a, b). The partic-ularly negative surface elevation change in the Western Hi-malaya has previously been attributed to rapidly shrinking accumulation areas, seen in rising firn lines in Landsat im-ages (Kääb et al., 2015, area called Spiti Lahaul). Kääb et al. (2015) see the same pattern for the strongly negative glacier evolution in the Nyainqêntanglha Shan/Hengduan, which has low-lying accumulation areas. Thus, once the accumulation area becomes too small or disappears entirely, abundant or increasing precipitation cannot compensate for melt due to increased temperatures (Sakai and Fujita, 2017).
5.6 Dissimilar glacier behaviour in the Karakoram/Kunlun Shan
The zonation we present here is the result of a compromise between within-unit glacier similarity, representative sam-pling and stable glacier surface change rates. In the